| Param | Original file | Final file |
|---|---|---|
| Filename | modeM0/AS1A04_229T01_9000002096_14193cztM0_level2.evt | modeM0/AS1A04_229T01_9000002096_14193cztM0_level2_quad_clean.evt |
| Size (bytes) | 1,002,271,680 | 187,536,960 |
| Size | 955.8 MB | 178.8 MB |
| Events in quadrant A | 6,784,606 | 1,193,336 |
| Events in quadrant B | 7,314,869 | 1,249,646 |
| Events in quadrant C | 6,994,012 | 1,161,913 |
| Events in quadrant D | 8,309,310 | 1,103,976 |
| Mode M9 | |||
|---|---|---|---|
| Quadrant | BADHDUFLAG | Total packets | Discarded packets |
| A | 0 | 16 | 0 |
| B | 0 | 16 | 0 |
| C | 0 | 16 | 0 |
| D | 0 | 16 | 0 |
| Mode M0 | |||
|---|---|---|---|
| Quadrant | BADHDUFLAG | Total packets | Discarded packets |
| A | 0 | 29375 | 3 |
| B | 0 | 30595 | 3 |
| C | 0 | 29419 | 3 |
| D | 0 | 33850 | 3 |
| Mode SS | |||
|---|---|---|---|
| Quadrant | BADHDUFLAG | Total packets | Discarded packets |
| A | 0 | 284 | 0 |
| B | 0 | 284 | 0 |
| C | 0 | 284 | 0 |
| D | 0 | 284 | 0 |
| Quadrant | Total seconds | Saturated seconds | Saturation percentage |
|---|---|---|---|
| A | 14077 | 90 | 0.639341% |
| B | 14077 | 184 | 1.307097% |
| C | 14077 | 83 | 0.589614% |
| D | 14077 | 170 | 1.207644% |
Noise dominated data is calculated using 1-second bins in cleaned event files. If a bin has >2000 counts, and if more than 50% of those come from <1% of pixels, then it is considered to be noise-dominated and hence unusable.
| Quadrant | # 1 sec bins | Bins with >0 counts | Bins with >2000 counts | High rate bins dominated by noise | Noise dominated (total time) | Noise dominated (detector-on time) | Marked lightcurve |
|---|---|---|---|---|---|---|---|
| A | 15523 | 14081 | 14 | 14 | 0.09% | 0.10% | 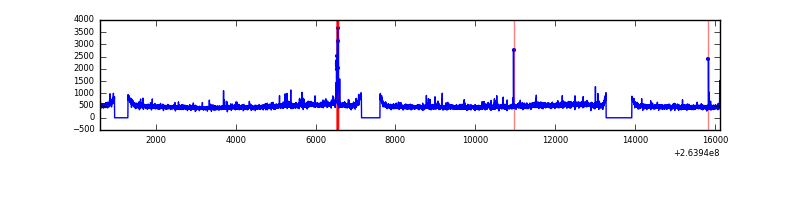 |
| B | 15523 | 14081 | 32 | 32 | 0.21% | 0.23% | 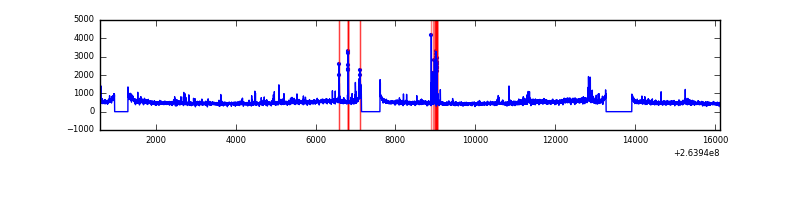 |
| C | 15523 | 14081 | 9 | 9 | 0.06% | 0.06% | 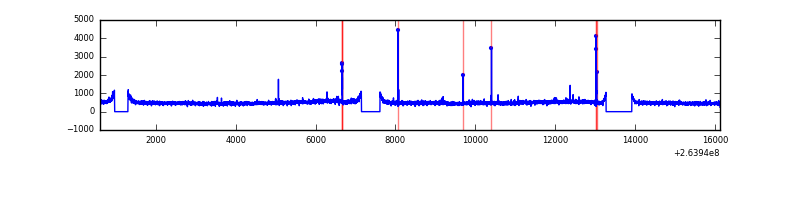 |
| D | 15523 | 14081 | 115 | 115 | 0.74% | 0.82% | 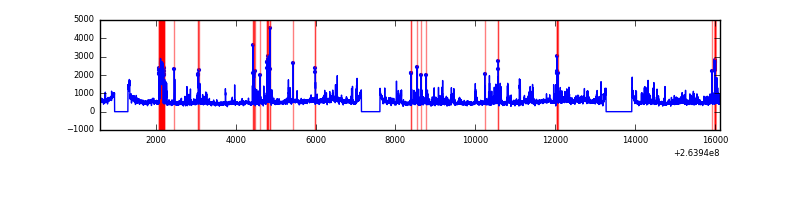 |
Top three noisy pixels from each quadrant. If the there are fewer than three noisy pixels in the level2.evt file, extra rows are filled as -1
| Pixel properties | Quadrant properties | ||||||
|---|---|---|---|---|---|---|---|
| Quadrant | DetID | PixID | Counts | Sigma | Mean | Median | Sigma |
| A | 12 | 189 | 64641 | 182.93 | 1697 | 1664 | 344.3 |
| A | 15 | 69 | 62822 | 177.64 | 1697 | 1664 | 344.3 |
| A | 9 | 143 | 52442 | 147.49 | 1697 | 1664 | 344.3 |
| B | 0 | 219 | 258603 | 791.85 | 1709 | 1668 | 324.5 |
| B | 4 | 48 | 115601 | 351.13 | 1709 | 1668 | 324.5 |
| B | 0 | 189 | 70305 | 211.53 | 1709 | 1668 | 324.5 |
| C | 3 | 233 | 518727 | 1359.61 | 1648 | 1660 | 380.3 |
| C | 14 | 234 | 34886 | 87.37 | 1648 | 1660 | 380.3 |
| C | 0 | 207 | 18980 | 45.54 | 1648 | 1660 | 380.3 |
| D | 8 | 195 | 621545 | 1599.3 | 1630 | 1588 | 387.6 |
| D | 10 | 199 | 464412 | 1193.94 | 1630 | 1588 | 387.6 |
| D | 12 | 110 | 390126 | 1002.31 | 1630 | 1588 | 387.6 |
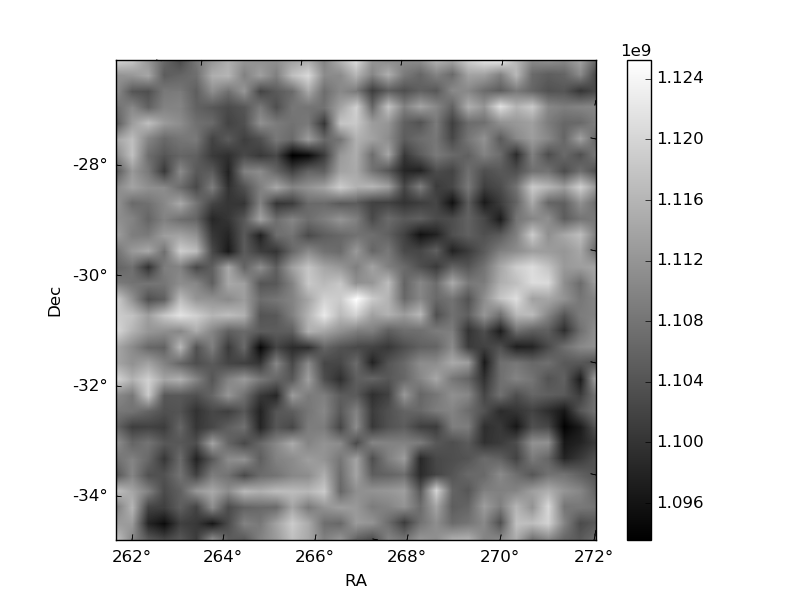
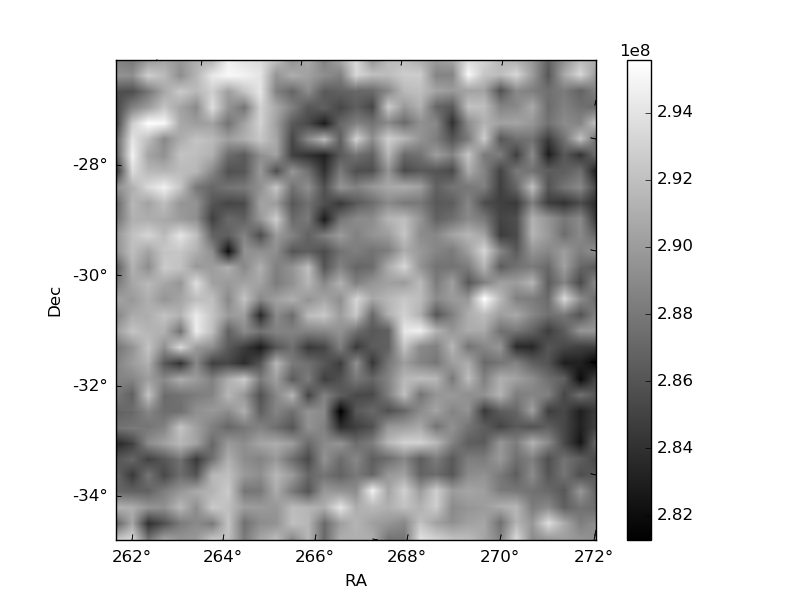
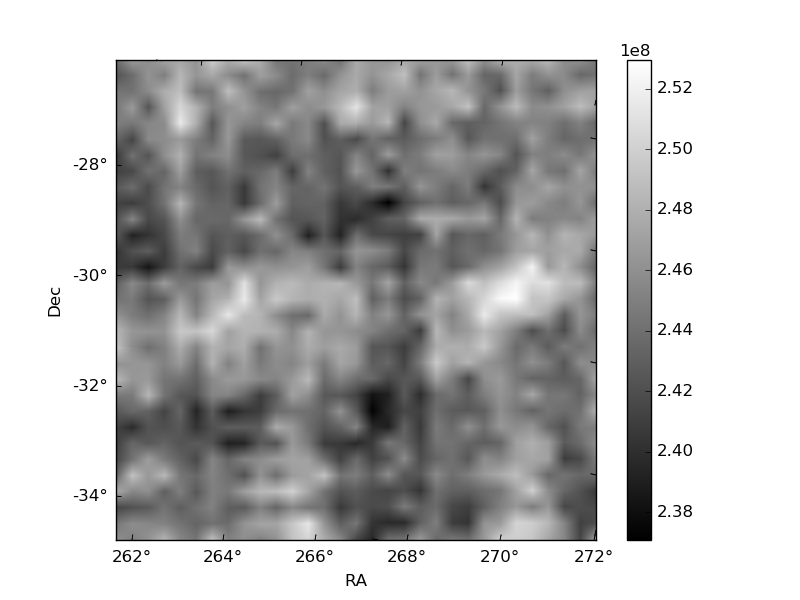
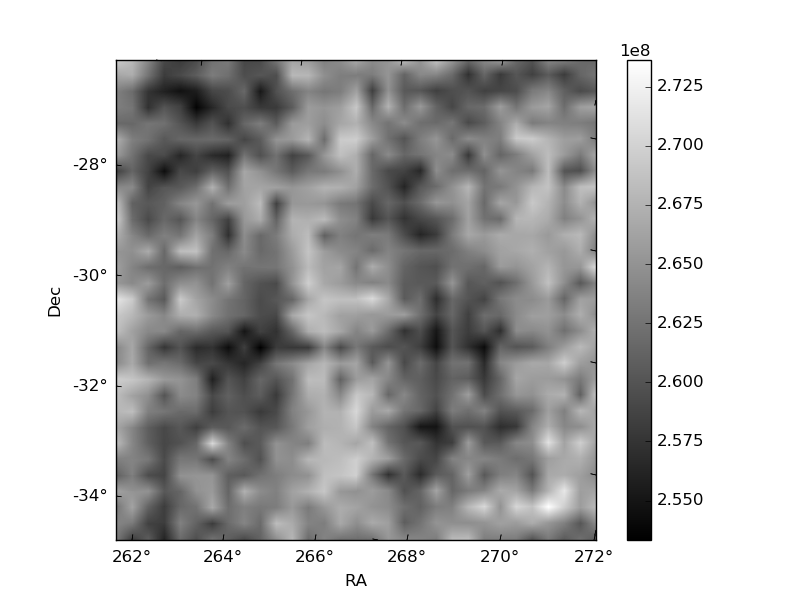
Histogram calculated using DETX and DETY for each event in the final _common_clean file
| Quadrant A | 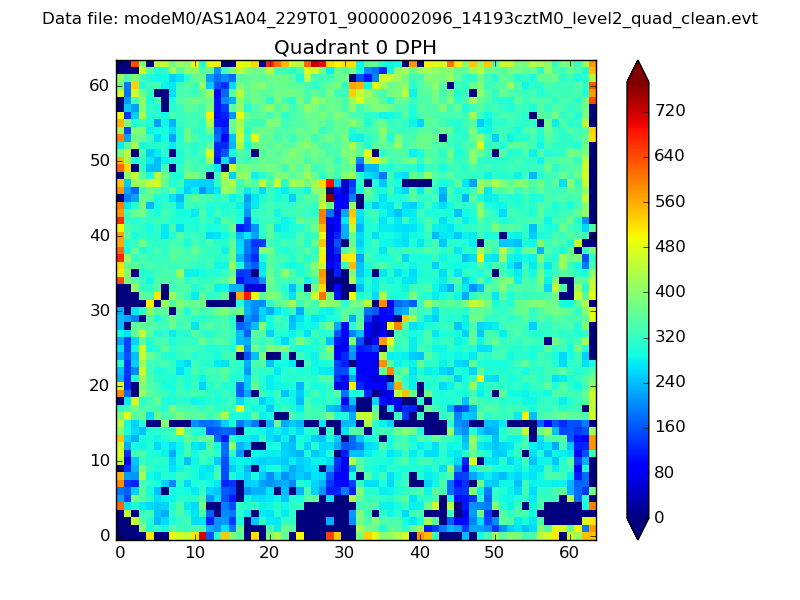 |
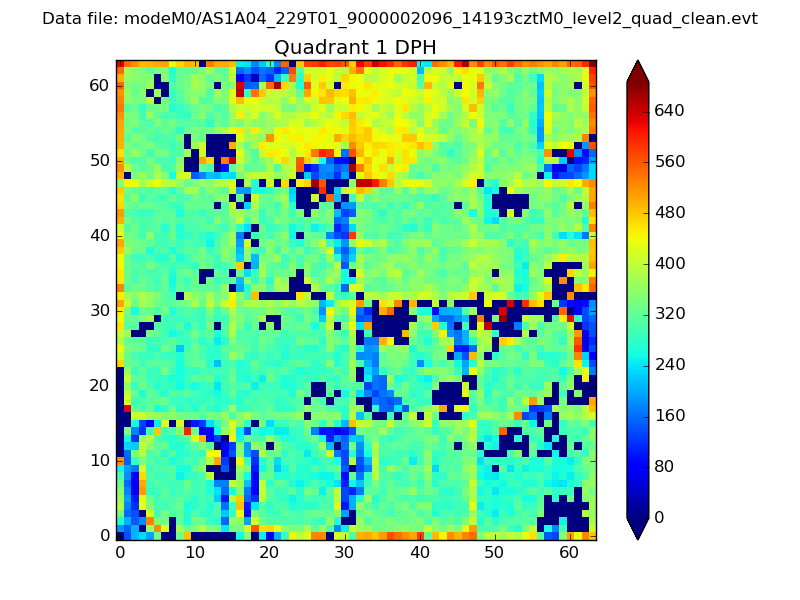 |
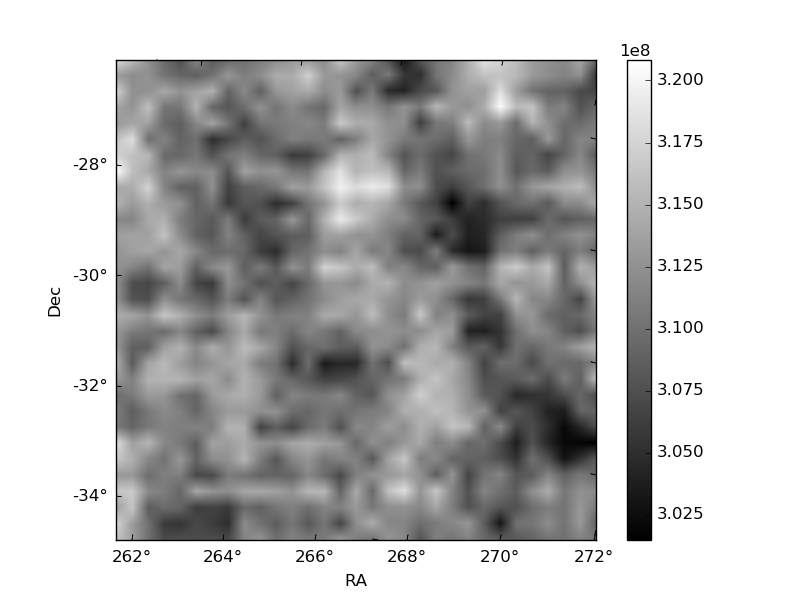
Quadrant B |
|---|---|---|---|
| Quadrant D | 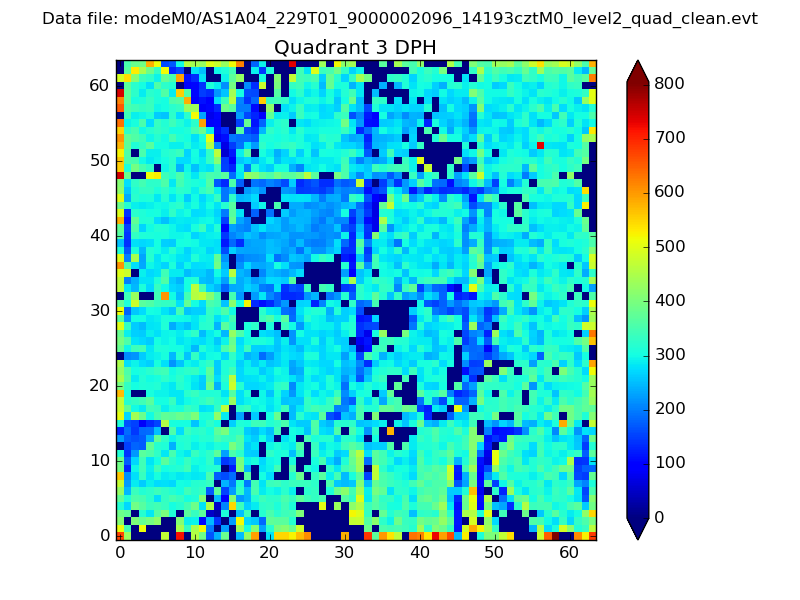 |
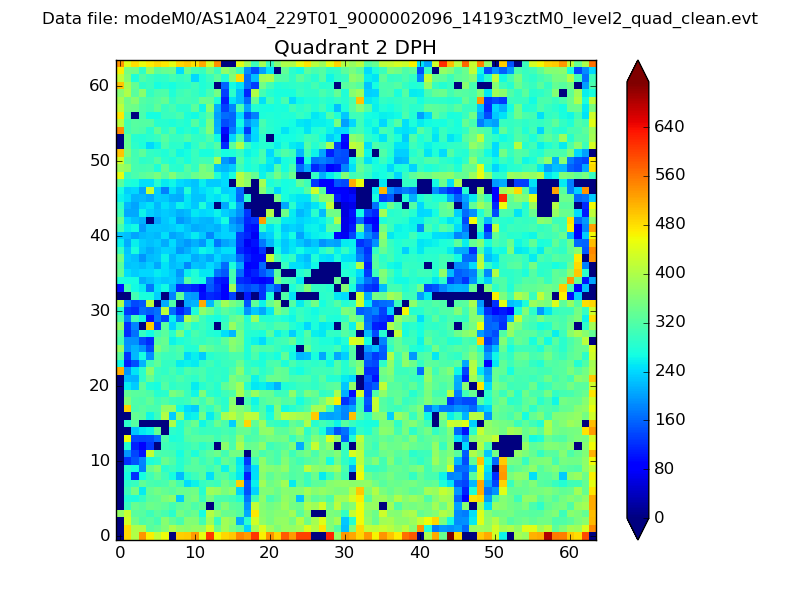 |
Quadrant C |
| Plot type | Count rate plots | Images |
|---|---|---|
| Comparison with Poisson distribution Blue bars denote a histogram of data divided into 1 sec bins. Red curve is a Poisson curve with rate = median count rate of data. |
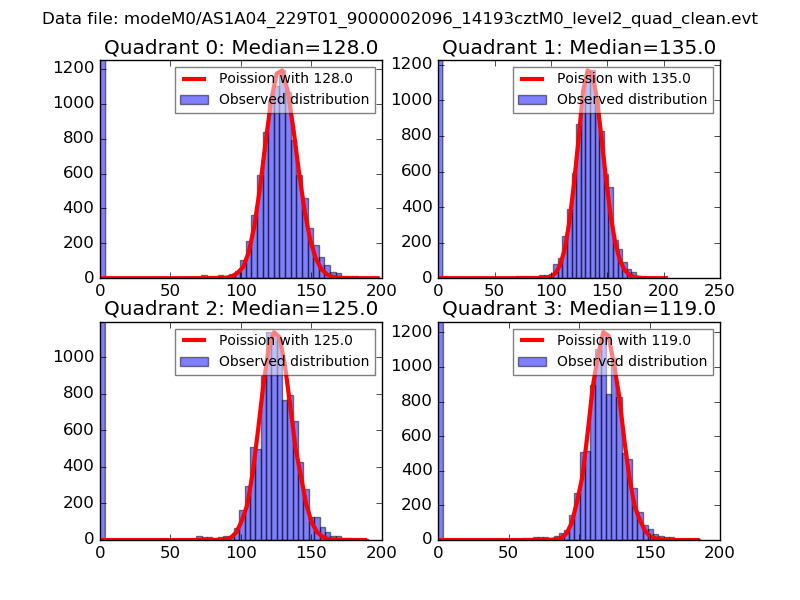 |
 |
| Quadrant-wise count rates Data is divided into 100 sec bins |
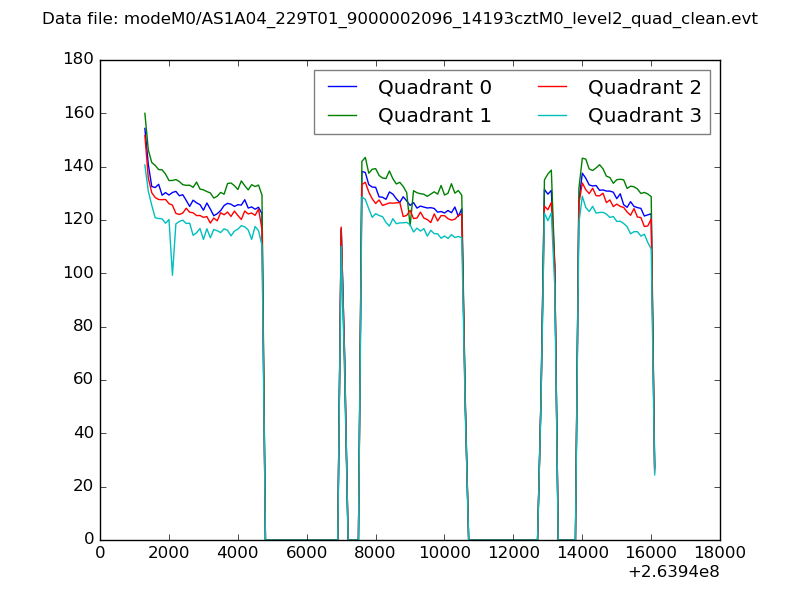 |
|
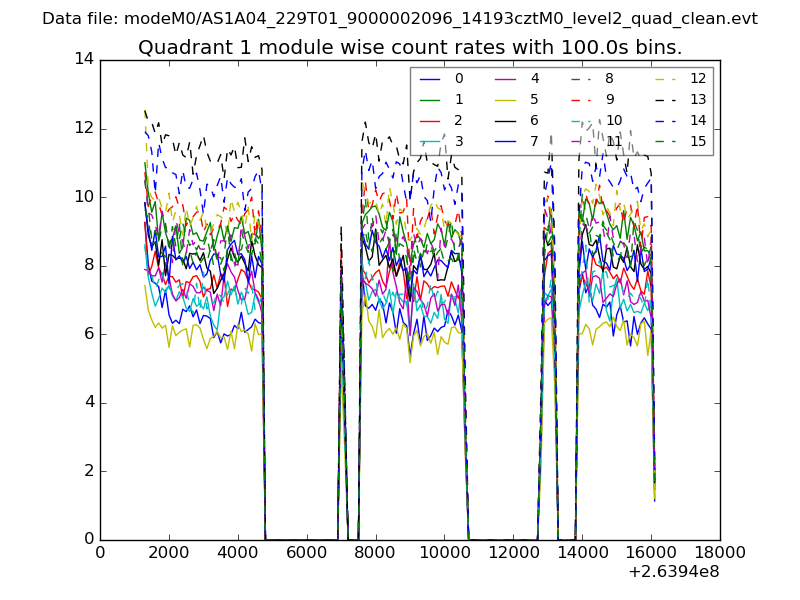
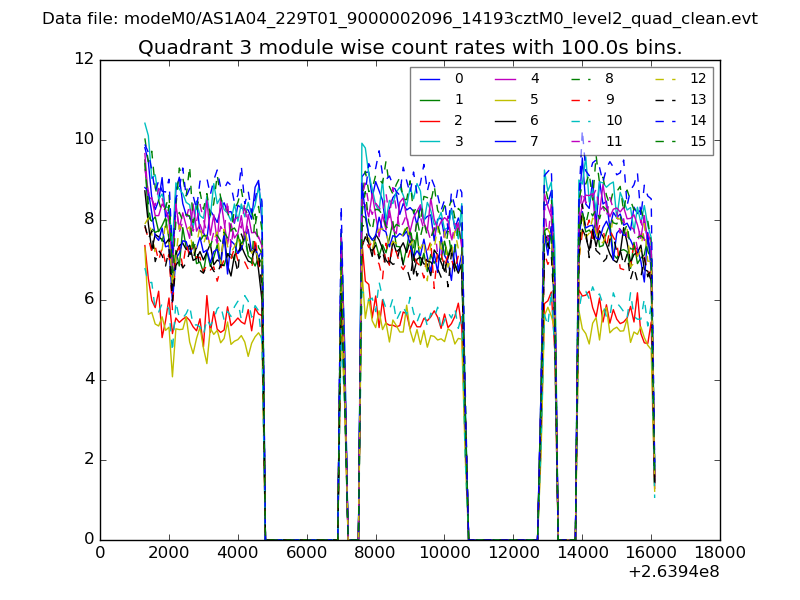
| Module-wise count rates for Quadrant A Data is divided into 100 sec bins |
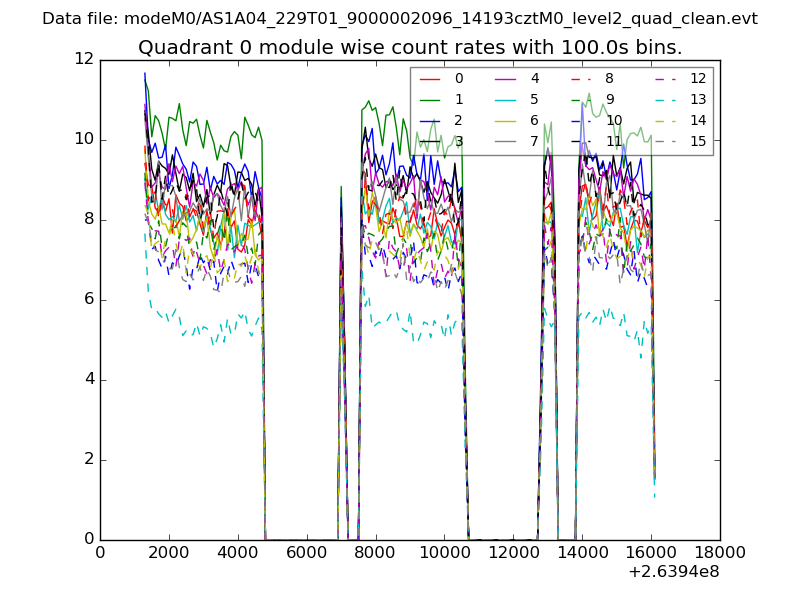 |
 |
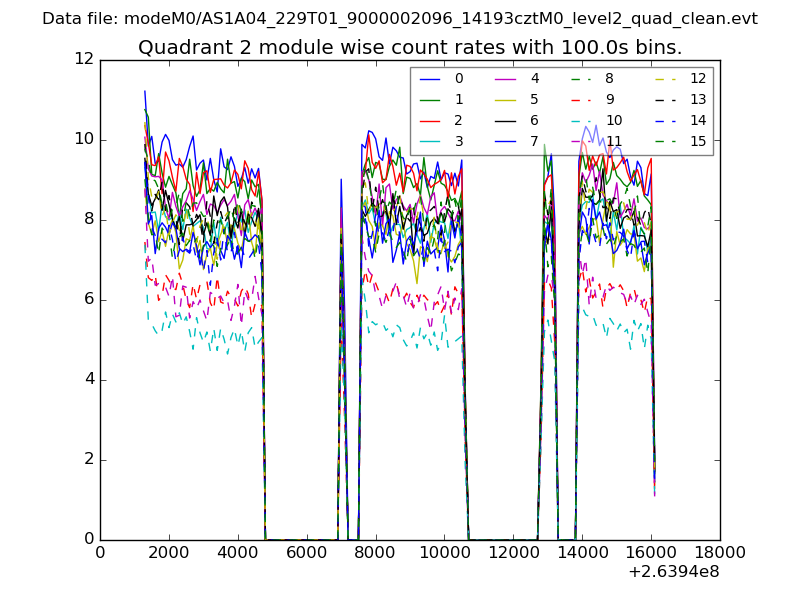
| Module-wise count rates for Quadrant B Data is divided into 100 sec bins |
 |
 |
| Module-wise count rates for Quadrant C Data is divided into 100 sec bins |
 |
 |
| Module-wise count rates for Quadrant D Data is divided into 100 sec bins |
 |
 |
| Parameter | Plot |
|---|---|
| CZT HV Monitor | 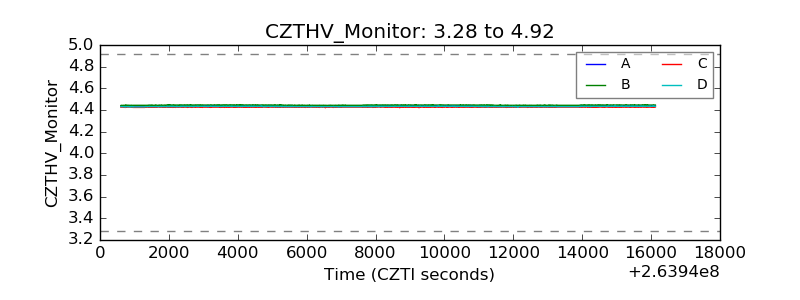 |
| D_VDD | 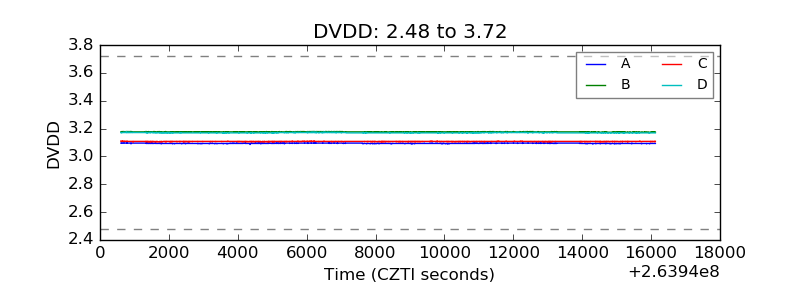 |
| Temperature 1 | 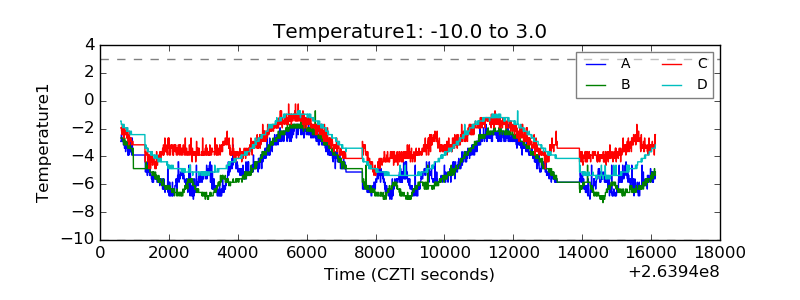 |
| Veto HV Monitor | 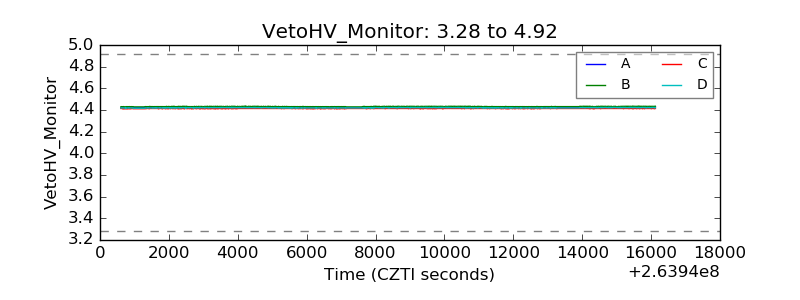 |
| Veto LLD | 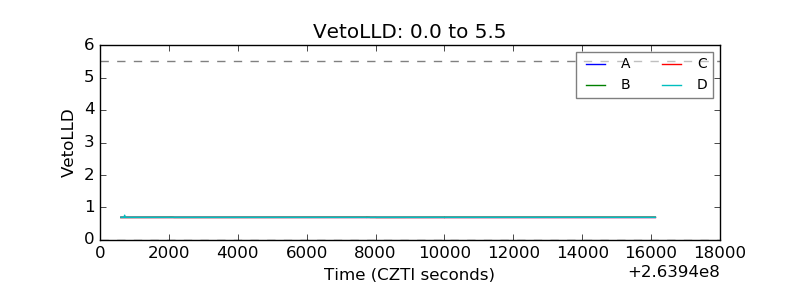 |
| Alpha Counter | 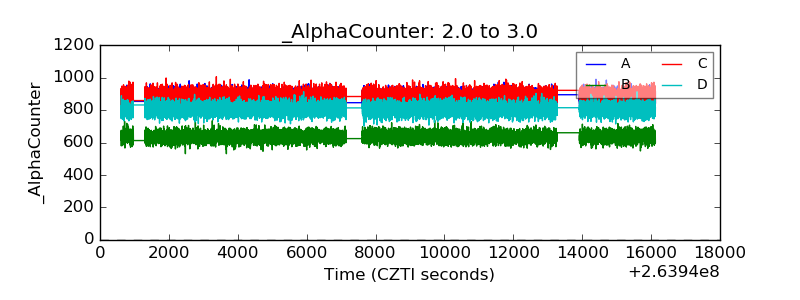 |
| _CPM_Rate | 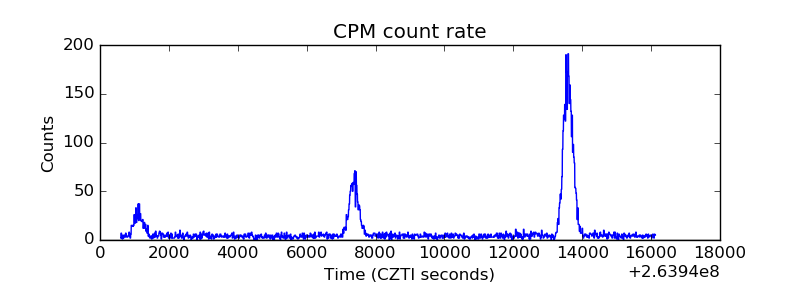 |
| CZT Counter | 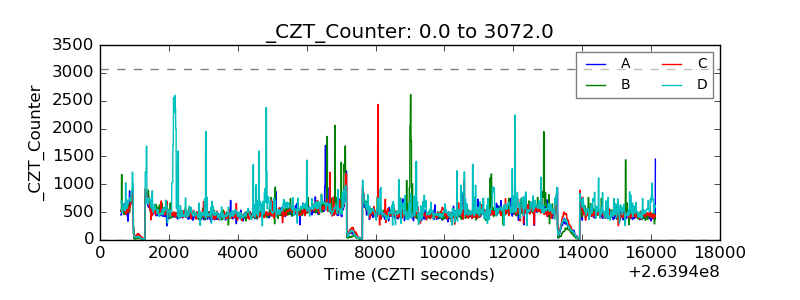 |
| +2.5 Volts monitor |  |
| +5 Volts monitor |  |
| _ROLL_ROT | 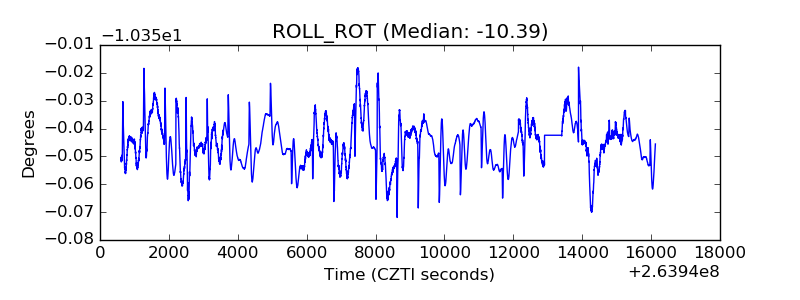 |
| _Roll_DEC | 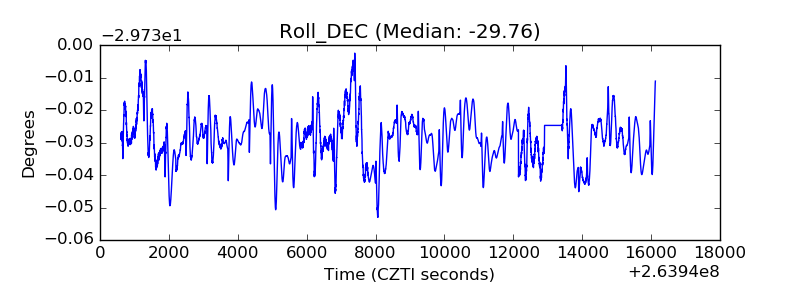 |
| _Roll_RA | 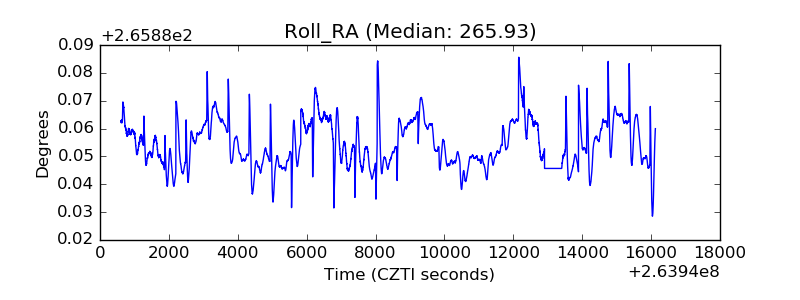 |
| Veto Counter | 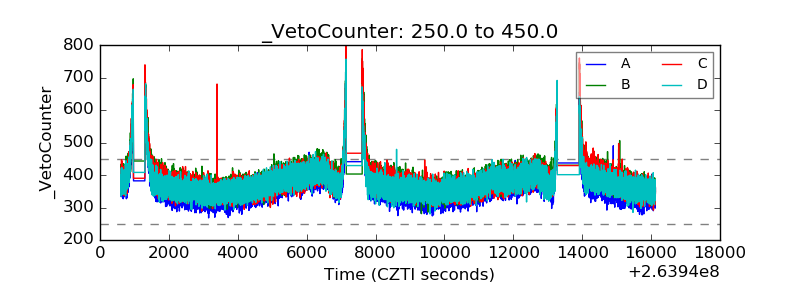 |