| Param | Original file | Final file |
|---|---|---|
| Filename | modeM0/AS1G08_024T02_9000002094cztM0_level2.fits | modeM0/AS1G08_024T02_9000002094cztM0_level2_quad_clean.evt |
| Size (bytes) | 438,572,160 | 403,139,520 |
| Size | 418.3 MB | 384.5 MB |
| Events in quadrant A | 2,723,864 | 2,357,314 |
| Events in quadrant B | 2,582,486 | 2,290,750 |
| Events in quadrant C | 2,695,232 | 2,419,301 |
| Events in quadrant D | 2,349,160 | 2,209,598 |
| Mode M0 | |||
|---|---|---|---|
| Quadrant | BADHDUFLAG | Total packets | Discarded packets |
| A | 0 | 89655 | 0 |
| B | 0 | 105601 | 0 |
| C | 0 | 89870 | 0 |
| D | 0 | 105389 | 0 |
| Mode SS | |||
|---|---|---|---|
| Quadrant | BADHDUFLAG | Total packets | Discarded packets |
| A | 0 | 866 | 0 |
| B | 0 | 866 | 0 |
| C | 0 | 866 | 0 |
| D | 0 | 866 | 0 |
| Mode M9 | |||
|---|---|---|---|
| Quadrant | BADHDUFLAG | Total packets | Discarded packets |
| A | 0 | 96 | 0 |
| B | 0 | 96 | 0 |
| C | 0 | 96 | 0 |
| D | 0 | 96 | 0 |
| Quadrant | Total seconds | Saturated seconds | Saturation percentage |
|---|---|---|---|
| A | 42716 | 606 | 1.418672% |
| B | 42718 | 1974 | 4.621003% |
| C | 42718 | 472 | 1.104921% |
| D | 42718 | 611 | 1.430310% |
Noise dominated data is calculated using 1-second bins in cleaned event files. If a bin has >2000 counts, and if more than 50% of those come from <1% of pixels, then it is considered to be noise-dominated and hence unusable.
| Quadrant | # 1 sec bins | Bins with >0 counts | Bins with >2000 counts | High rate bins dominated by noise | Noise dominated (total time) | Noise dominated (detector-on time) | Marked lightcurve |
|---|---|---|---|---|---|---|---|
| A | 51512 | 42715 | 0 | 0 | 0.00% | 0.00% |  |
| B | 51512 | 42714 | 0 | 0 | 0.00% | 0.00% |  |
| C | 51512 | 42716 | 0 | 0 | 0.00% | 0.00% |  |
| D | 51512 | 42716 | 0 | 0 | 0.00% | 0.00% |  |
Top three noisy pixels from each quadrant. If the there are fewer than three noisy pixels in the level2.evt file, extra rows are filled as -1
| Pixel properties | Quadrant properties | ||||||
|---|---|---|---|---|---|---|---|
| Quadrant | DetID | PixID | Counts | Sigma | Mean | Median | Sigma |
| A | 0 | 29 | 2531 | 10.82 | 707 | 664 | 172.5 |
| A | 7 | 110 | 2245 | 9.17 | 707 | 664 | 172.5 |
| A | 9 | 19 | 2004 | 7.77 | 707 | 664 | 172.5 |
| B | 2 | 9 | 2232 | 11.68 | 680 | 650 | 135.5 |
| B | 2 | 8 | 1727 | 7.95 | 680 | 650 | 135.5 |
| B | 5 | 128 | 1695 | 7.71 | 680 | 650 | 135.5 |
| C | 1 | 81 | 2031 | 7.36 | 712 | 667 | 185.4 |
| C | 1 | 80 | 2016 | 7.28 | 712 | 667 | 185.4 |
| C | 12 | 241 | 1833 | 6.29 | 712 | 667 | 185.4 |
| D | 6 | 231 | 1718 | 6.19 | 670 | 612 | 178.6 |
| D | 10 | 189 | 1678 | 5.97 | 670 | 612 | 178.6 |
| D | 1 | 19 | 1567 | 5.35 | 670 | 612 | 178.6 |
Histogram calculated using DETX and DETY for each event in the final _common_clean file
| Quadrant A | 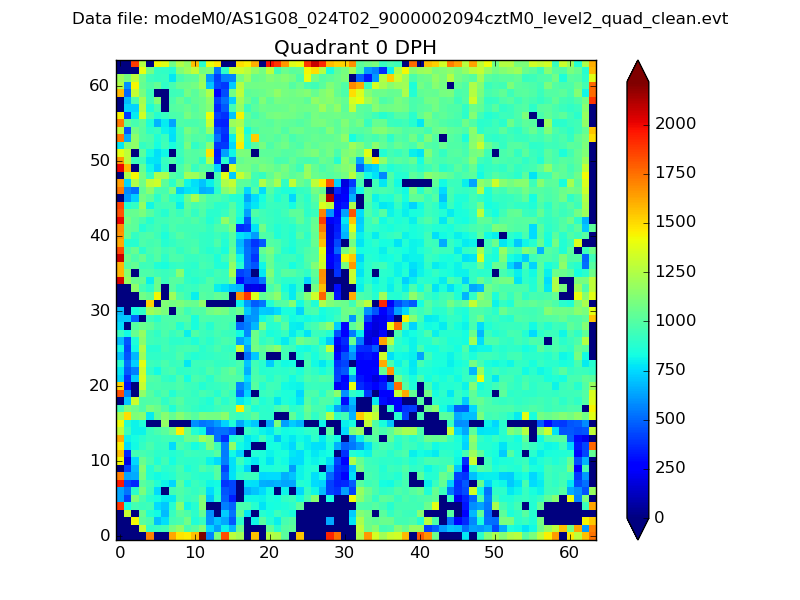 |
 |
Quadrant B |
|---|---|---|---|
| Quadrant D | 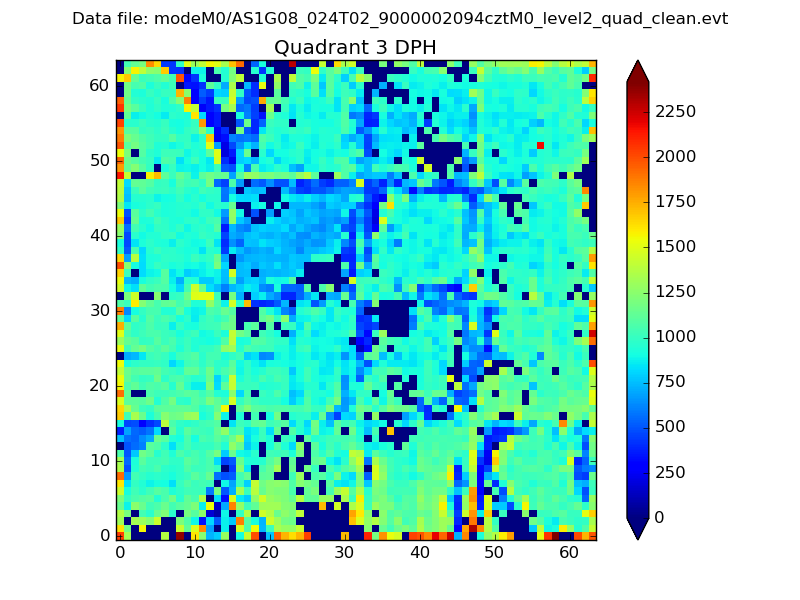 |
 |
Quadrant C |
| Plot type | Count rate plots | Images |
|---|---|---|
| Comparison with Poisson distribution Blue bars denote a histogram of data divided into 1 sec bins. Red curve is a Poisson curve with rate = median count rate of data. |
 |
 |
| Quadrant-wise count rates Data is divided into 100 sec bins |
 |
|
| Module-wise count rates for Quadrant A Data is divided into 100 sec bins |
 |
 |
| Module-wise count rates for Quadrant B Data is divided into 100 sec bins |
 |
 |
| Module-wise count rates for Quadrant C Data is divided into 100 sec bins |
 |
 |
| Module-wise count rates for Quadrant D Data is divided into 100 sec bins |
 |
 |
| Parameter | Plot |
|---|---|
| CZT HV Monitor |  |
| D_VDD | 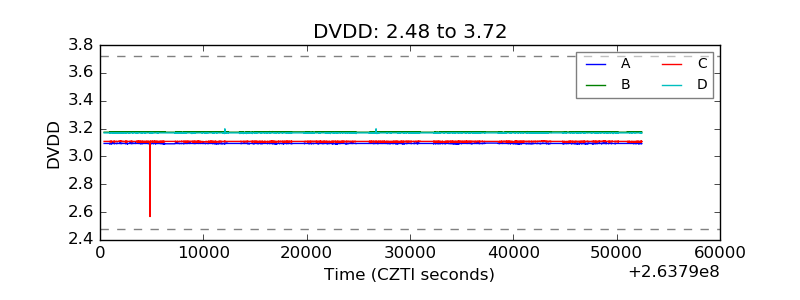 |
| Temperature 1 |  |
| Veto HV Monitor |  |
| Veto LLD |  |
| Alpha Counter |  |
| _CPM_Rate |  |
| CZT Counter |  |
| +2.5 Volts monitor |  |
| +5 Volts monitor |  |
| _ROLL_ROT |  |
| _Roll_DEC |  |
| _Roll_RA |  |
| Veto Counter |  |