| Param | Original file | Final file |
|---|---|---|
| Filename | modeM0/AS1G08_024T02_9000002094_14164cztM0_level2.evt | modeM0/AS1G08_024T02_9000002094_14164cztM0_level2_quad_clean.evt |
| Size (bytes) | 101,367,360 | 29,070,720 |
| Size | 96.7 MB | 27.7 MB |
| Events in quadrant A | 673,063 | 187,128 |
| Events in quadrant B | 861,053 | 186,966 |
| Events in quadrant C | 709,851 | 202,628 |
| Events in quadrant D | 723,106 | 194,159 |
| Mode M0 | |||
|---|---|---|---|
| Quadrant | BADHDUFLAG | Total packets | Discarded packets |
| A | 0 | 2988 | 2 |
| B | 0 | 3501 | 1 |
| C | 0 | 3006 | 1 |
| D | 0 | 3028 | 1 |
| Mode SS | |||
|---|---|---|---|
| Quadrant | BADHDUFLAG | Total packets | Discarded packets |
| A | 0 | 28 | 0 |
| B | 0 | 28 | 0 |
| C | 0 | 28 | 0 |
| D | 0 | 28 | 0 |
| Mode M9 | |||
|---|---|---|---|
| Quadrant | BADHDUFLAG | Total packets | Discarded packets |
| A | 0 | 6 | 0 |
| B | 0 | 6 | 0 |
| C | 0 | 6 | 0 |
| D | 0 | 6 | 0 |
| Quadrant | Total seconds | Saturated seconds | Saturation percentage |
|---|---|---|---|
| A | 1474 | 4 | 0.271370% |
| B | 1474 | 37 | 2.510176% |
| C | 1474 | 1 | 0.067843% |
| D | 1474 | 1 | 0.067843% |
Noise dominated data is calculated using 1-second bins in cleaned event files. If a bin has >2000 counts, and if more than 50% of those come from <1% of pixels, then it is considered to be noise-dominated and hence unusable.
| Quadrant | # 1 sec bins | Bins with >0 counts | Bins with >2000 counts | High rate bins dominated by noise | Noise dominated (total time) | Noise dominated (detector-on time) | Marked lightcurve |
|---|---|---|---|---|---|---|---|
| A | 1475 | 1475 | 0 | 0 | 0.00% | 0.00% | 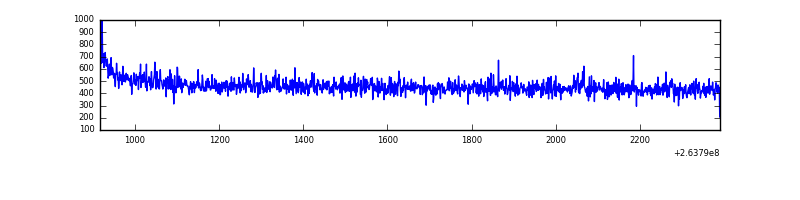 |
| B | 1475 | 1475 | 17 | 17 | 1.15% | 1.15% | 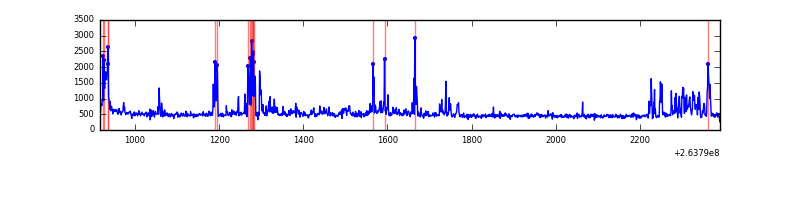 |
| C | 1475 | 1475 | 0 | 0 | 0.00% | 0.00% | 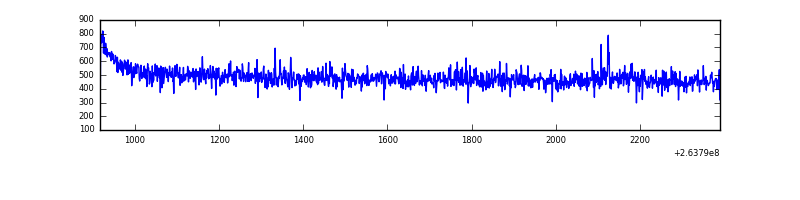 |
| D | 1475 | 1475 | 0 | 0 | 0.00% | 0.00% | 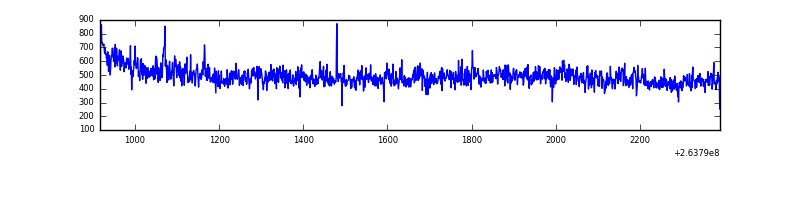 |
Top three noisy pixels from each quadrant. If the there are fewer than three noisy pixels in the level2.evt file, extra rows are filled as -1
| Pixel properties | Quadrant properties | ||||||
|---|---|---|---|---|---|---|---|
| Quadrant | DetID | PixID | Counts | Sigma | Mean | Median | Sigma |
| A | 12 | 189 | 4965 | 129.65 | 173 | 170 | 37.0 |
| A | 0 | 226 | 1563 | 37.67 | 173 | 170 | 37.0 |
| A | 12 | 194 | 1345 | 31.77 | 173 | 170 | 37.0 |
| B | 0 | 85 | 155678 | 4461.07 | 172 | 168 | 34.9 |
| B | 10 | 252 | 21839 | 621.67 | 172 | 168 | 34.9 |
| B | 4 | 80 | 5833 | 162.51 | 172 | 168 | 34.9 |
| C | 3 | 233 | 33166 | 785.23 | 173 | 174 | 42.0 |
| C | 14 | 234 | 1486 | 31.23 | 173 | 174 | 42.0 |
| C | 13 | 61 | 1233 | 25.21 | 173 | 174 | 42.0 |
| D | 8 | 195 | 69978 | 1664.9 | 169 | 165 | 41.9 |
| D | 2 | 234 | 4180 | 95.75 | 169 | 165 | 41.9 |
| D | 2 | 152 | 3753 | 85.57 | 169 | 165 | 41.9 |
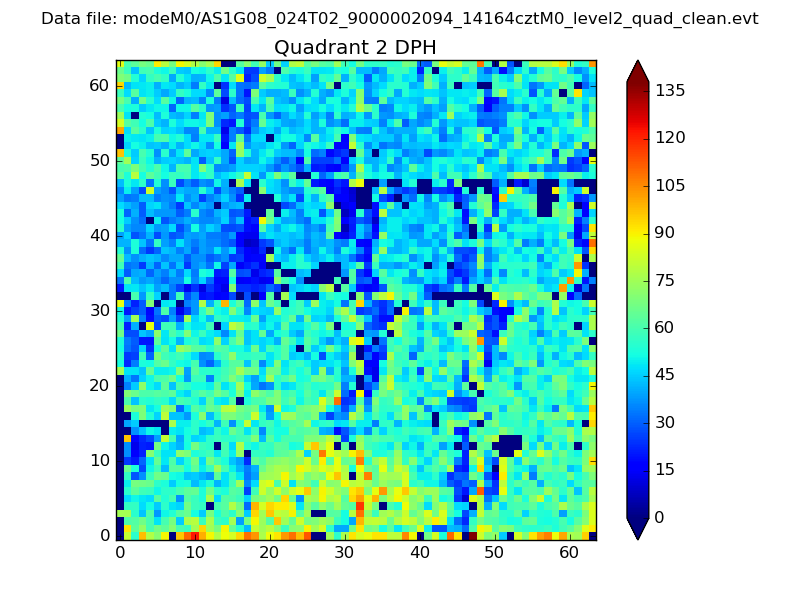
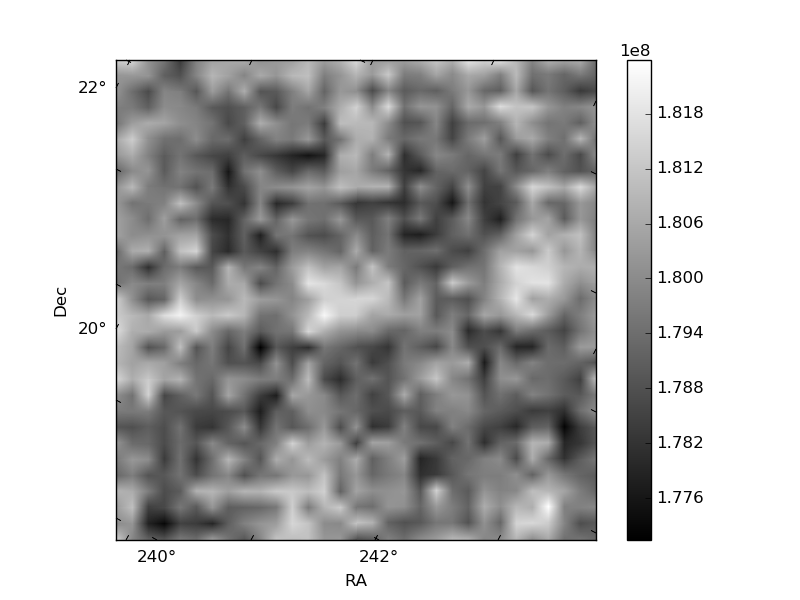
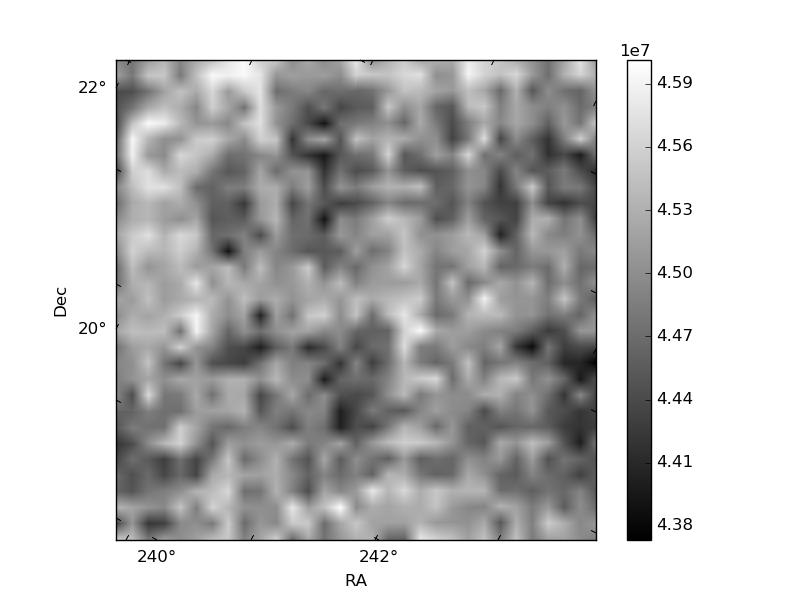
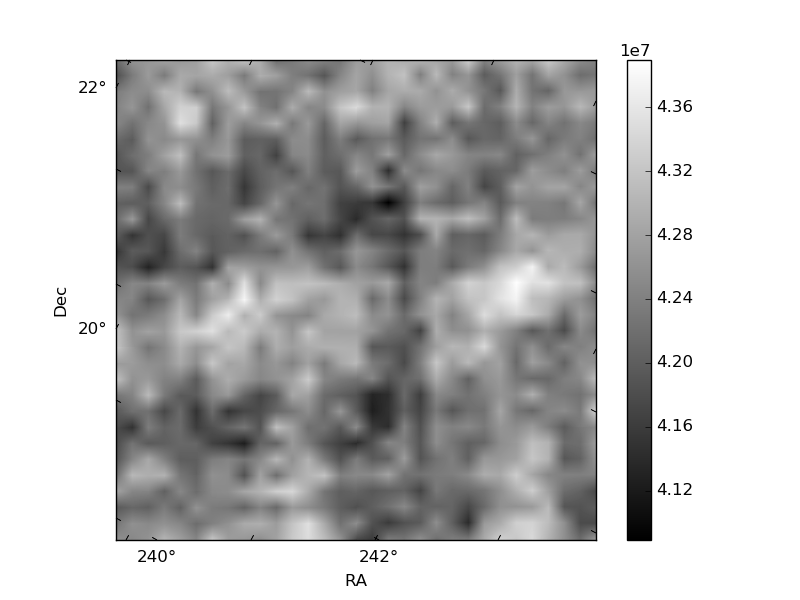
Histogram calculated using DETX and DETY for each event in the final _common_clean file
| Quadrant A | 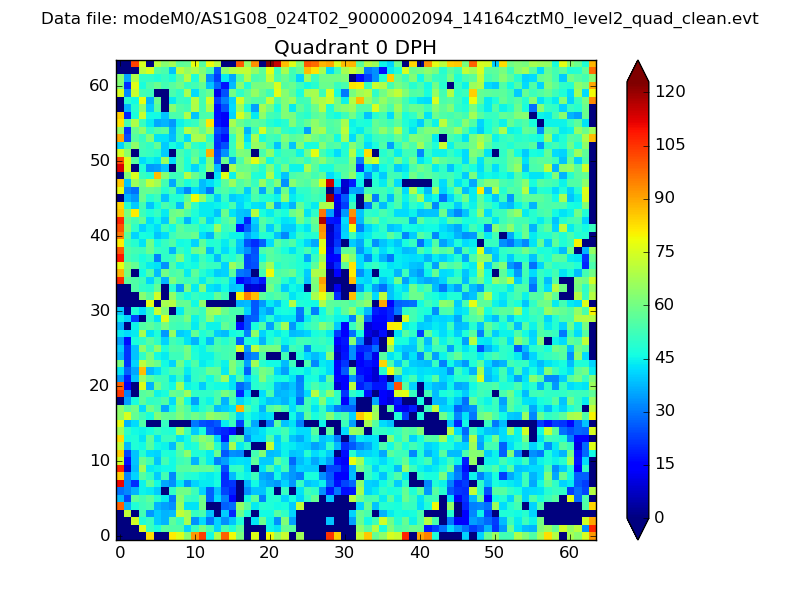 |
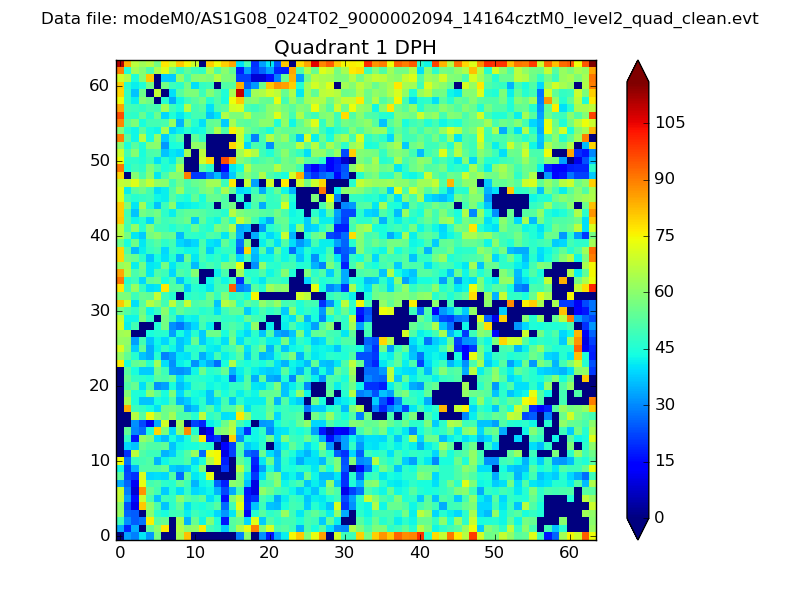 |
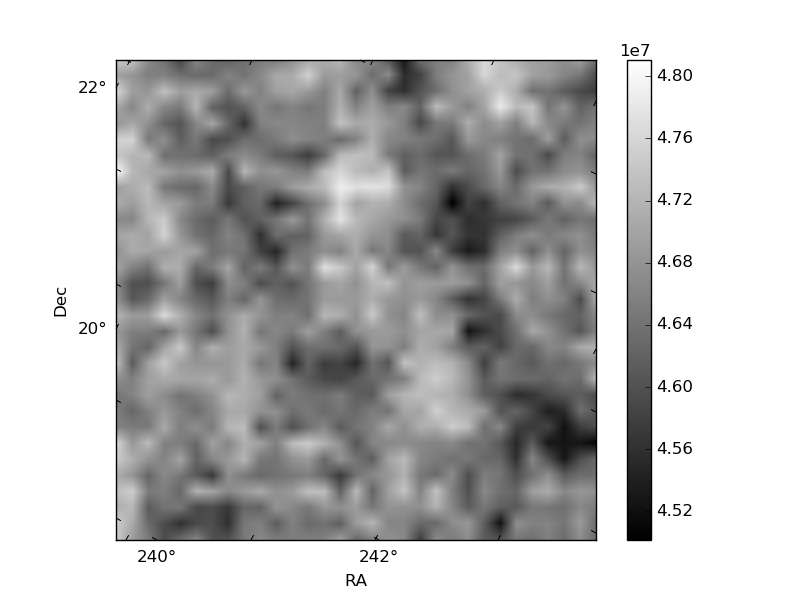
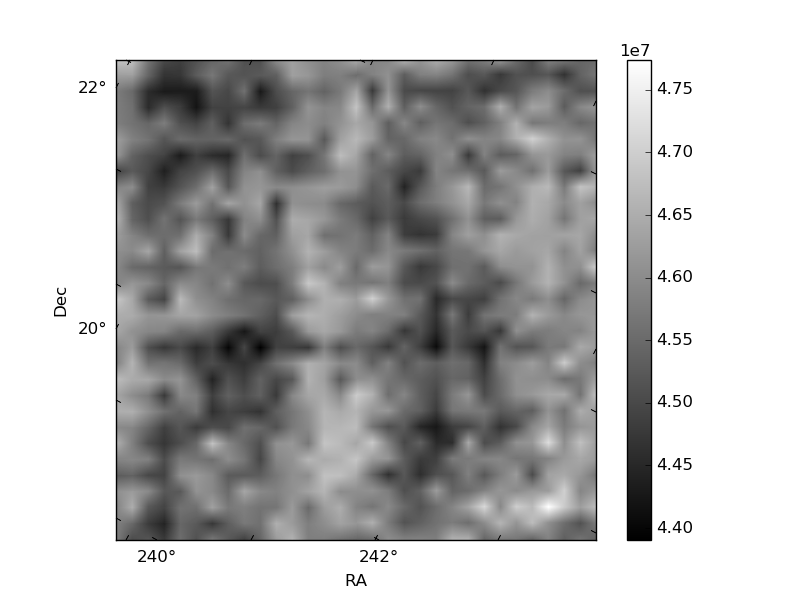
Quadrant B |
|---|---|---|---|
| Quadrant D | 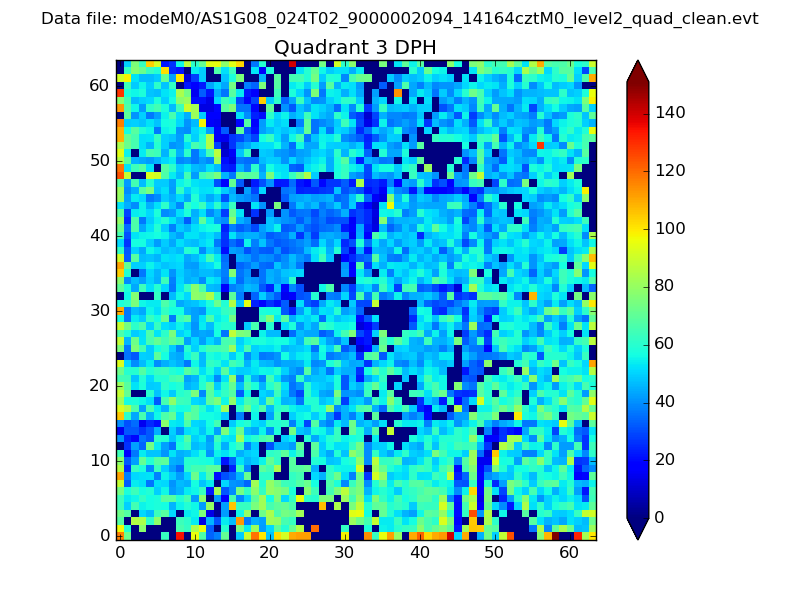 |
 |
Quadrant C |
| Plot type | Count rate plots | Images |
|---|---|---|
| Comparison with Poisson distribution Blue bars denote a histogram of data divided into 1 sec bins. Red curve is a Poisson curve with rate = median count rate of data. |
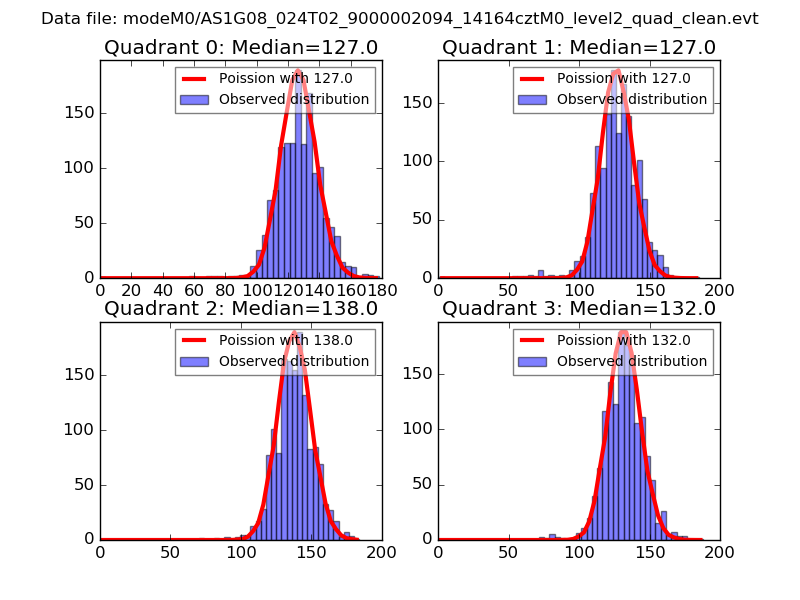 |
 |
| Quadrant-wise count rates Data is divided into 100 sec bins |
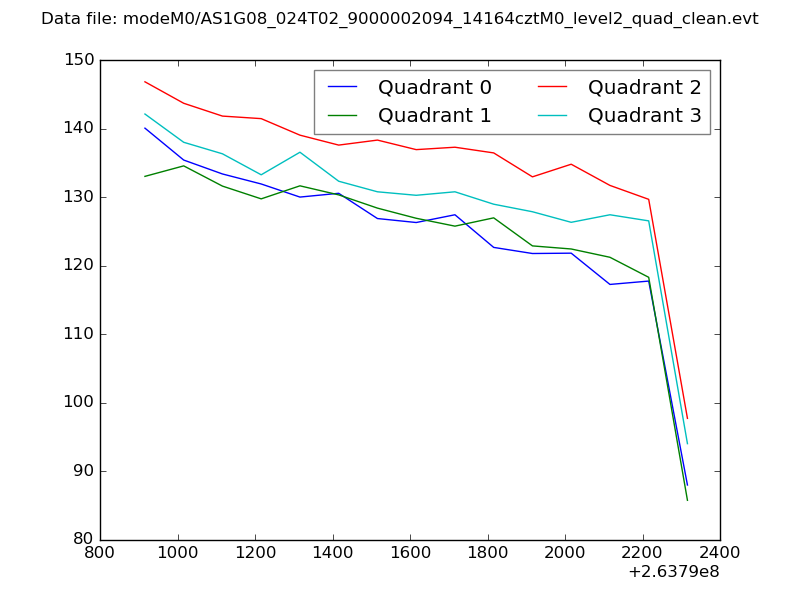 |
|
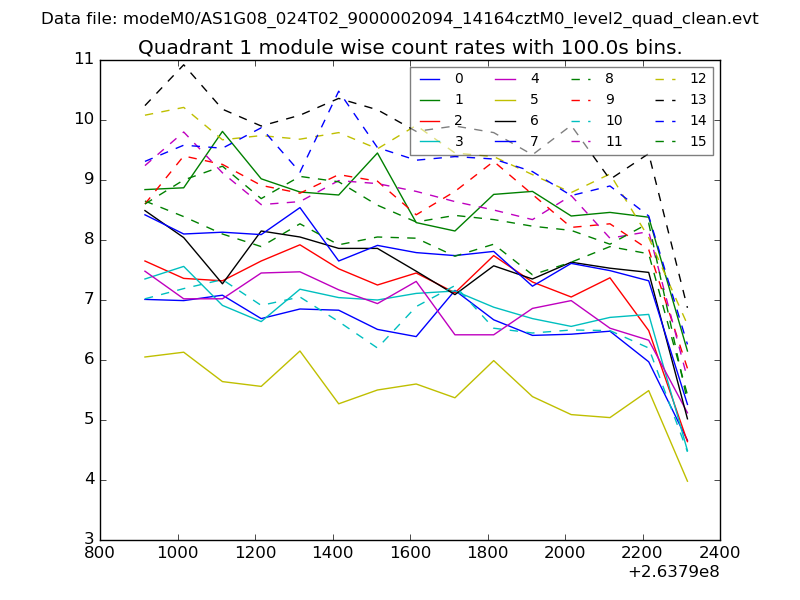
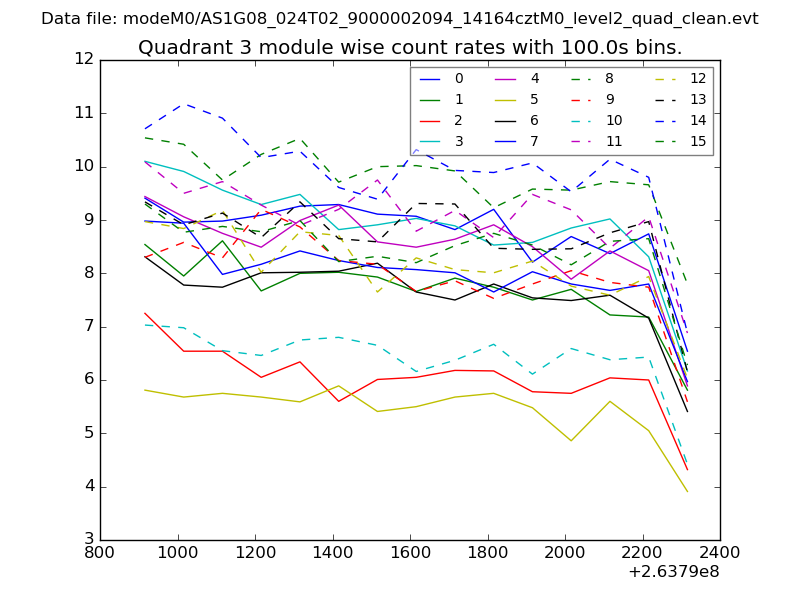
| Module-wise count rates for Quadrant A Data is divided into 100 sec bins |
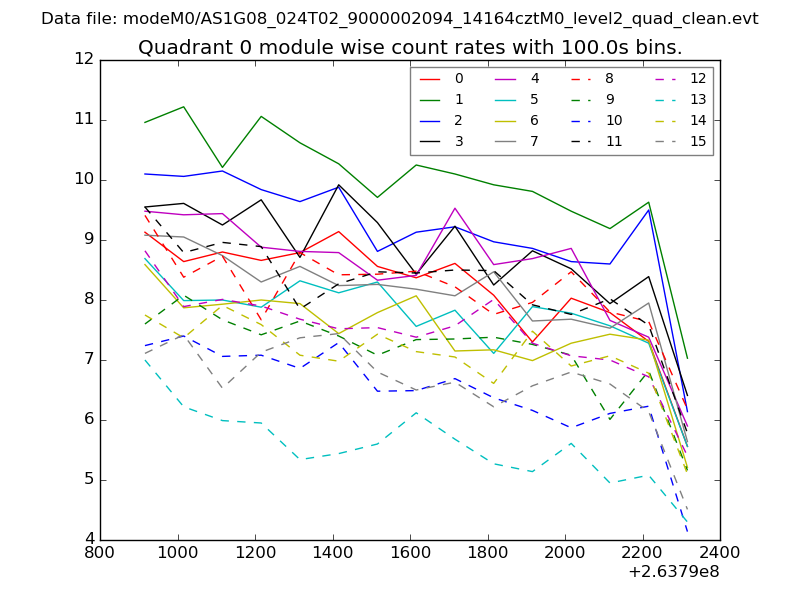 |
 |
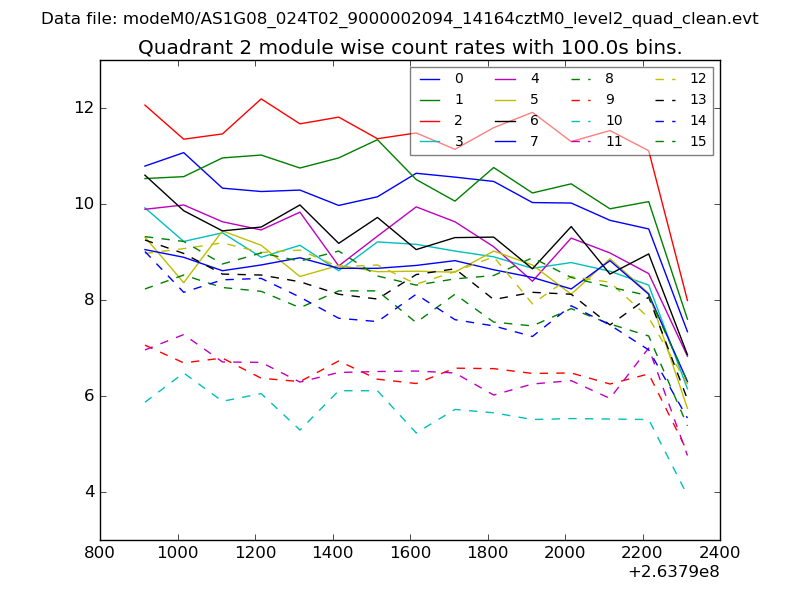
| Module-wise count rates for Quadrant B Data is divided into 100 sec bins |
 |
 |
| Module-wise count rates for Quadrant C Data is divided into 100 sec bins |
 |
 |
| Module-wise count rates for Quadrant D Data is divided into 100 sec bins |
 |
 |
| Parameter | Plot |
|---|---|
| CZT HV Monitor | 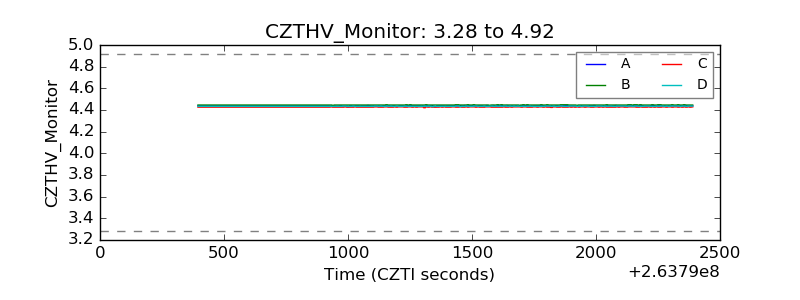 |
| D_VDD | 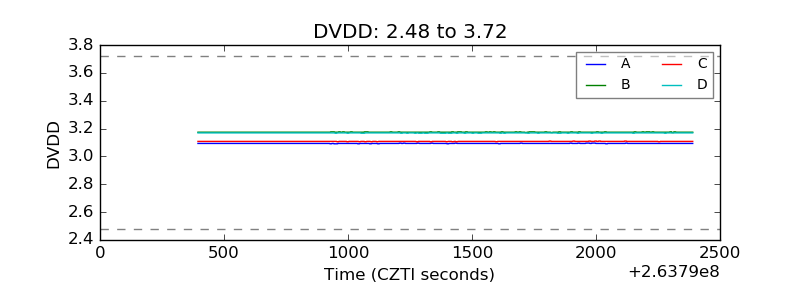 |
| Temperature 1 | 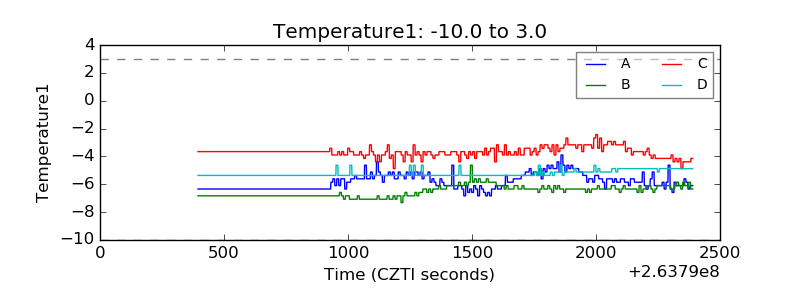 |
| Veto HV Monitor | 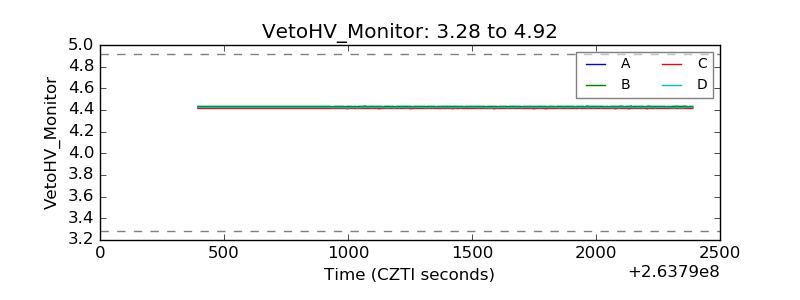 |
| Veto LLD | 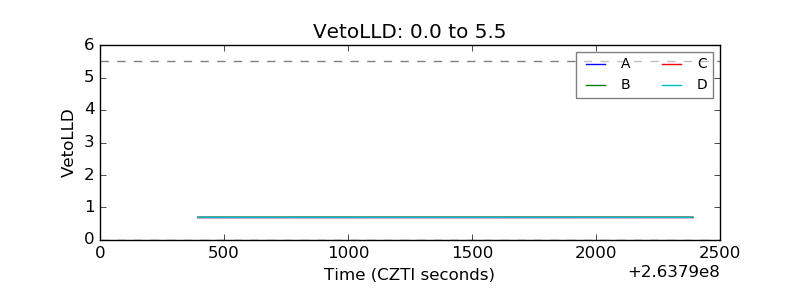 |
| Alpha Counter | 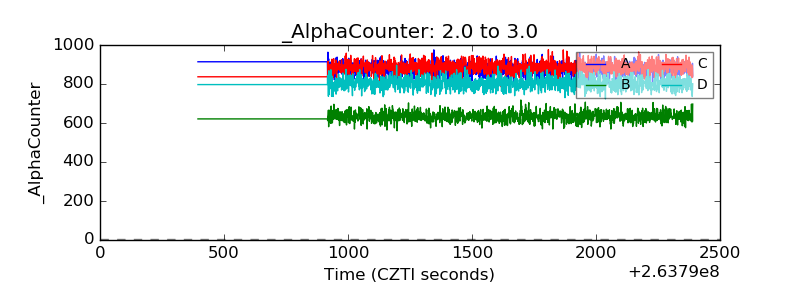 |
| _CPM_Rate | 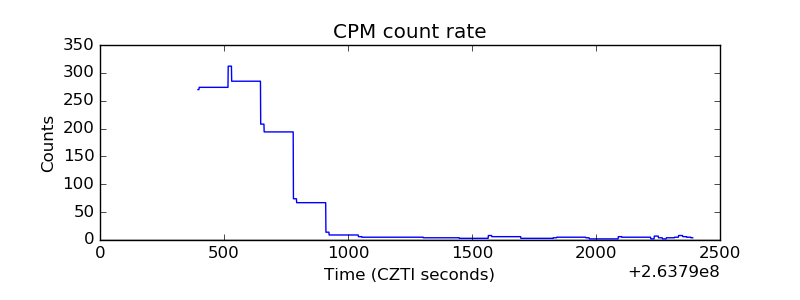 |
| CZT Counter | 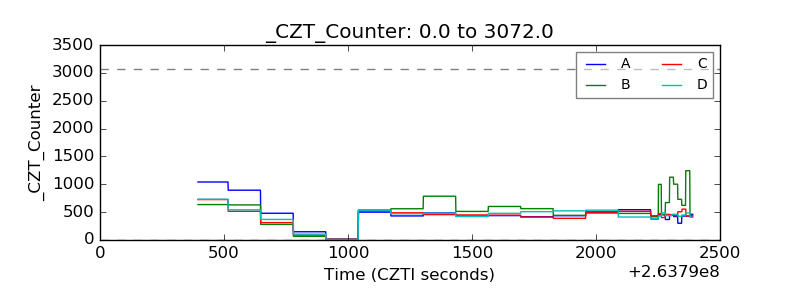 |
| +2.5 Volts monitor |  |
| +5 Volts monitor |  |
| _ROLL_ROT | 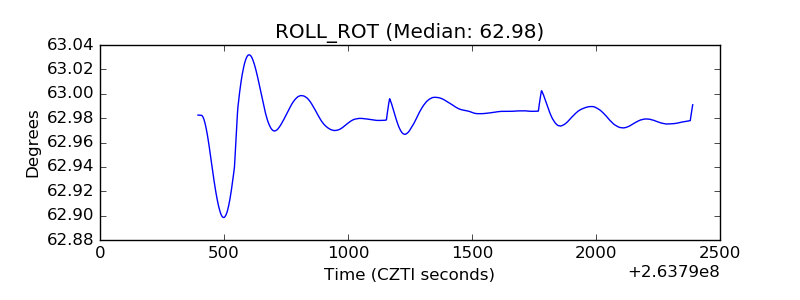 |
| _Roll_DEC | 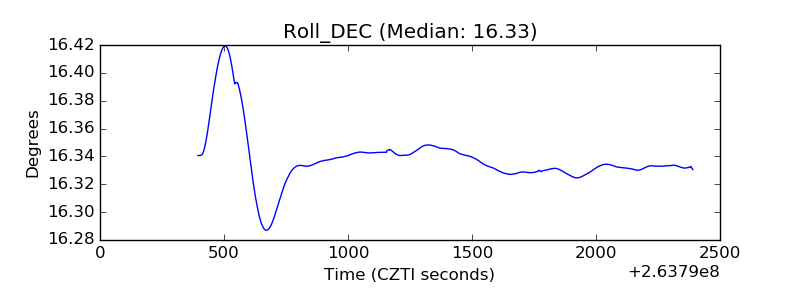 |
| _Roll_RA | 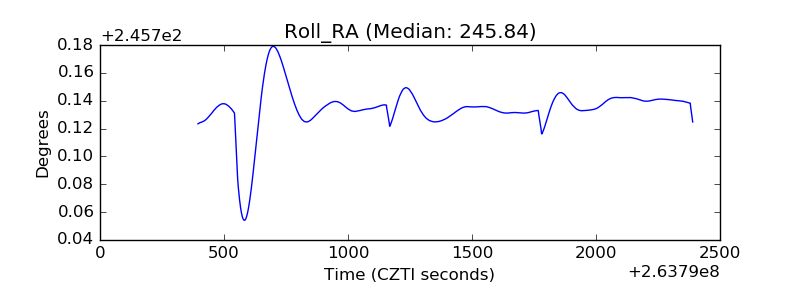 |
| Veto Counter | 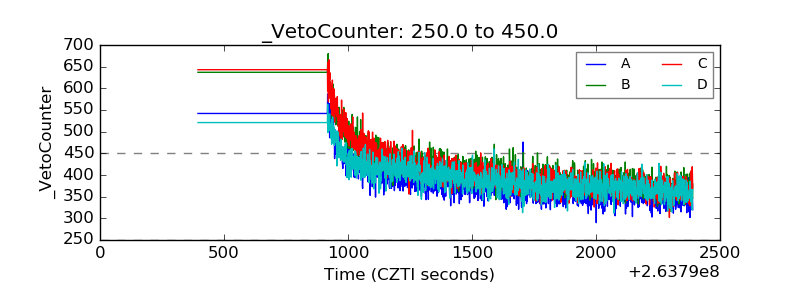 |