| Param | Original file | Final file |
|---|---|---|
| Filename | modeM0/AS1G08_024T02_9000002094_14168cztM0_level2.evt | modeM0/AS1G08_024T02_9000002094_14168cztM0_level2_quad_clean.evt |
| Size (bytes) | 503,182,080 | 73,851,840 |
| Size | 479.9 MB | 70.4 MB |
| Events in quadrant A | 3,287,146 | 442,271 |
| Events in quadrant B | 3,760,195 | 446,549 |
| Events in quadrant C | 3,313,797 | 461,428 |
| Events in quadrant D | 4,446,594 | 442,344 |
| Mode M0 | |||
|---|---|---|---|
| Quadrant | BADHDUFLAG | Total packets | Discarded packets |
| A | 0 | 13617 | 3 |
| B | 0 | 15123 | 2 |
| C | 0 | 13542 | 2 |
| D | 0 | 17891 | 2 |
| Mode SS | |||
|---|---|---|---|
| Quadrant | BADHDUFLAG | Total packets | Discarded packets |
| A | 0 | 130 | 0 |
| B | 0 | 130 | 0 |
| C | 0 | 130 | 0 |
| D | 0 | 130 | 0 |
| Mode M9 | |||
|---|---|---|---|
| Quadrant | BADHDUFLAG | Total packets | Discarded packets |
| A | 0 | 18 | 0 |
| B | 0 | 18 | 0 |
| C | 0 | 18 | 0 |
| D | 0 | 19 | 0 |
| Quadrant | Total seconds | Saturated seconds | Saturation percentage |
|---|---|---|---|
| A | 6354 | 98 | 1.542336% |
| B | 6354 | 182 | 2.864337% |
| C | 6354 | 59 | 0.928549% |
| D | 6354 | 148 | 2.329241% |
Noise dominated data is calculated using 1-second bins in cleaned event files. If a bin has >2000 counts, and if more than 50% of those come from <1% of pixels, then it is considered to be noise-dominated and hence unusable.
| Quadrant | # 1 sec bins | Bins with >0 counts | Bins with >2000 counts | High rate bins dominated by noise | Noise dominated (total time) | Noise dominated (detector-on time) | Marked lightcurve |
|---|---|---|---|---|---|---|---|
| A | 7520 | 6356 | 4 | 4 | 0.05% | 0.06% | 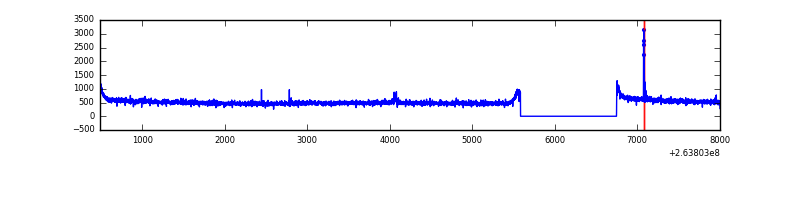 |
| B | 7520 | 6356 | 36 | 36 | 0.48% | 0.57% | 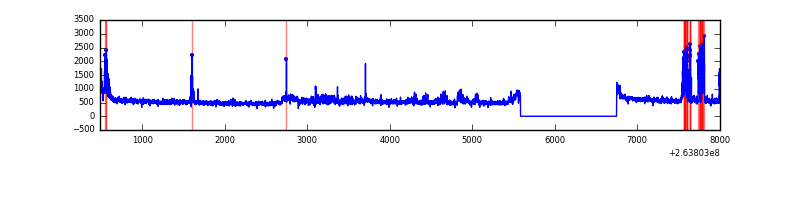 |
| C | 7520 | 6356 | 0 | 0 | 0.00% | 0.00% | 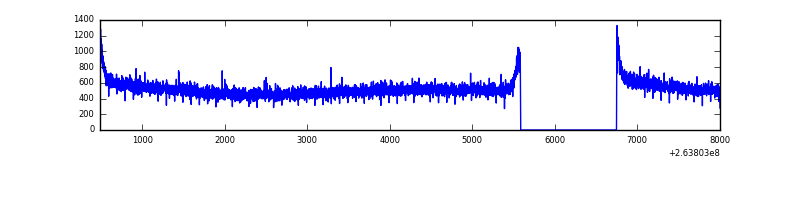 |
| D | 7520 | 6356 | 58 | 58 | 0.77% | 0.91% | 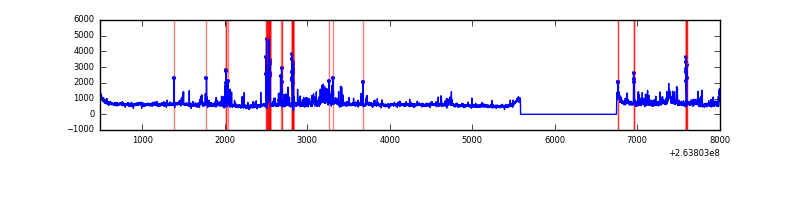 |
Top three noisy pixels from each quadrant. If the there are fewer than three noisy pixels in the level2.evt file, extra rows are filled as -1
| Pixel properties | Quadrant properties | ||||||
|---|---|---|---|---|---|---|---|
| Quadrant | DetID | PixID | Counts | Sigma | Mean | Median | Sigma |
| A | 9 | 143 | 23860 | 136.49 | 843 | 829 | 168.7 |
| A | 12 | 189 | 22694 | 129.58 | 843 | 829 | 168.7 |
| A | 0 | 226 | 7384 | 38.84 | 843 | 829 | 168.7 |
| B | 0 | 85 | 308884 | 1955.47 | 830 | 810 | 157.5 |
| B | 10 | 244 | 199801 | 1263.07 | 830 | 810 | 157.5 |
| B | 12 | 111 | 18640 | 113.17 | 830 | 810 | 157.5 |
| C | 3 | 233 | 124784 | 661.47 | 816 | 825 | 187.4 |
| C | 10 | 22 | 6407 | 29.79 | 816 | 825 | 187.4 |
| C | 13 | 61 | 5816 | 26.63 | 816 | 825 | 187.4 |
| D | 1 | 52 | 780582 | 4068.75 | 812 | 795 | 191.7 |
| D | 8 | 195 | 562479 | 2930.74 | 812 | 795 | 191.7 |
| D | 2 | 234 | 20377 | 102.17 | 812 | 795 | 191.7 |
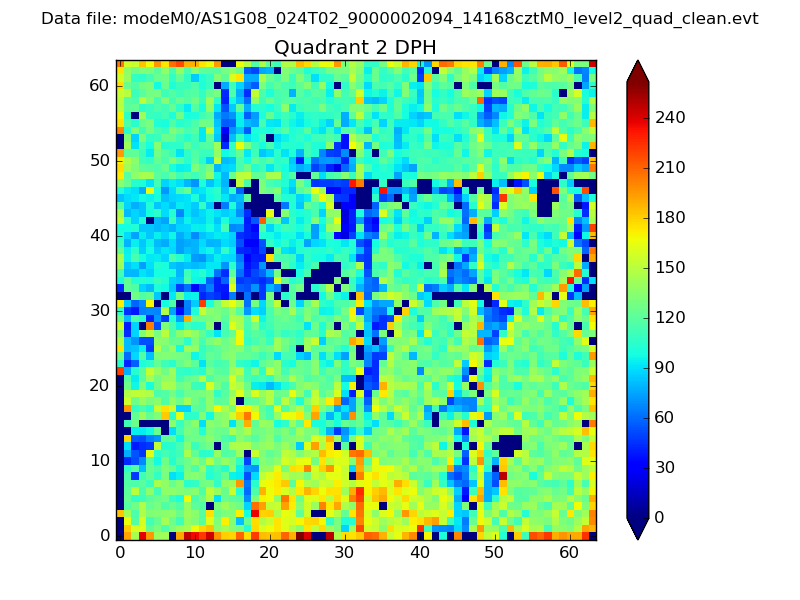
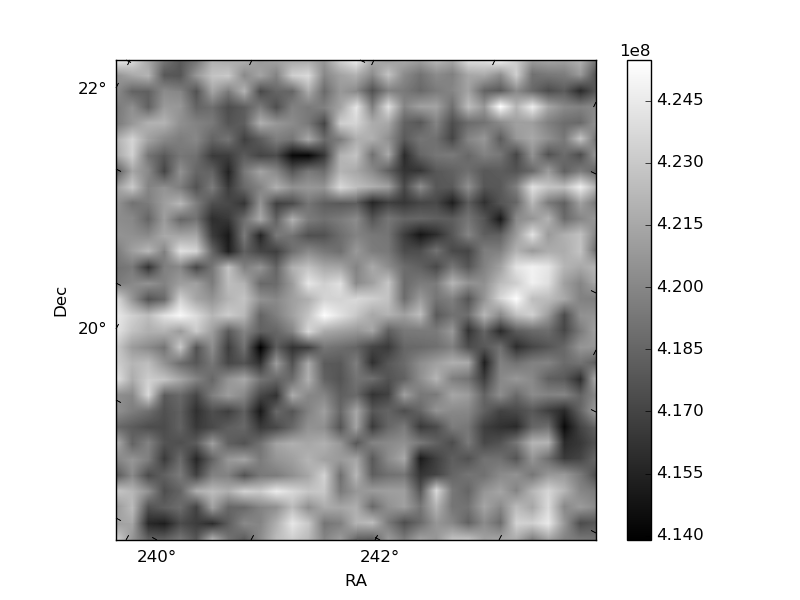
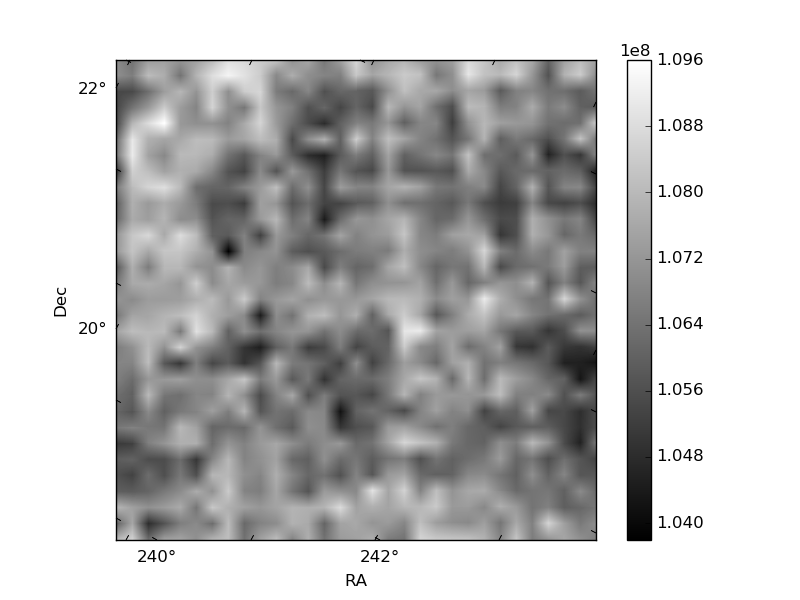
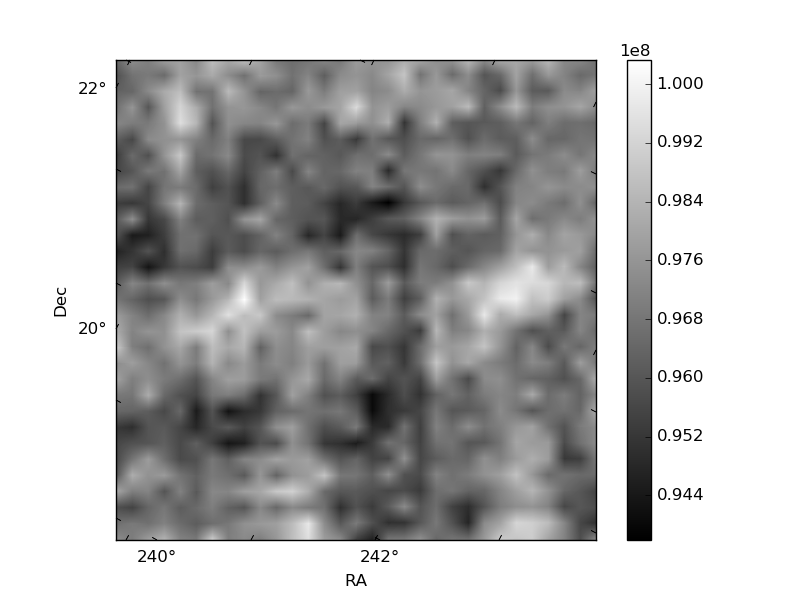
Histogram calculated using DETX and DETY for each event in the final _common_clean file
| Quadrant A | 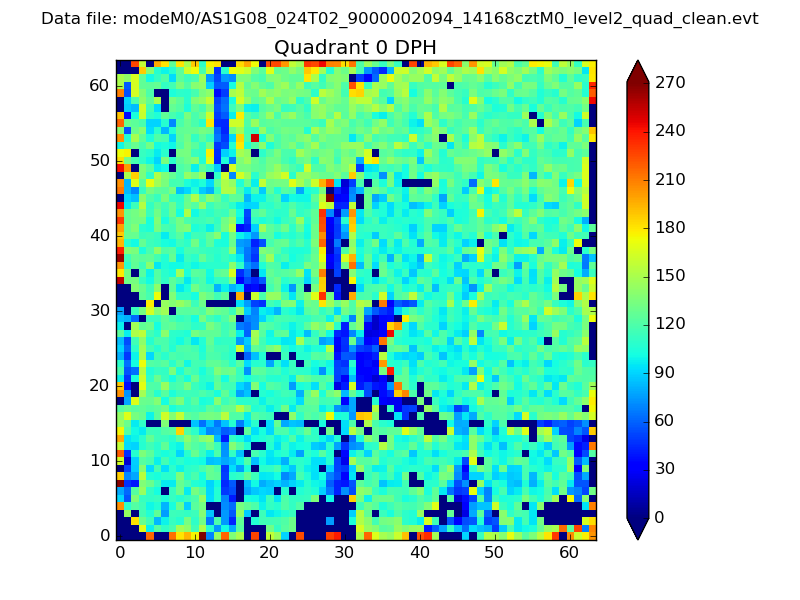 |
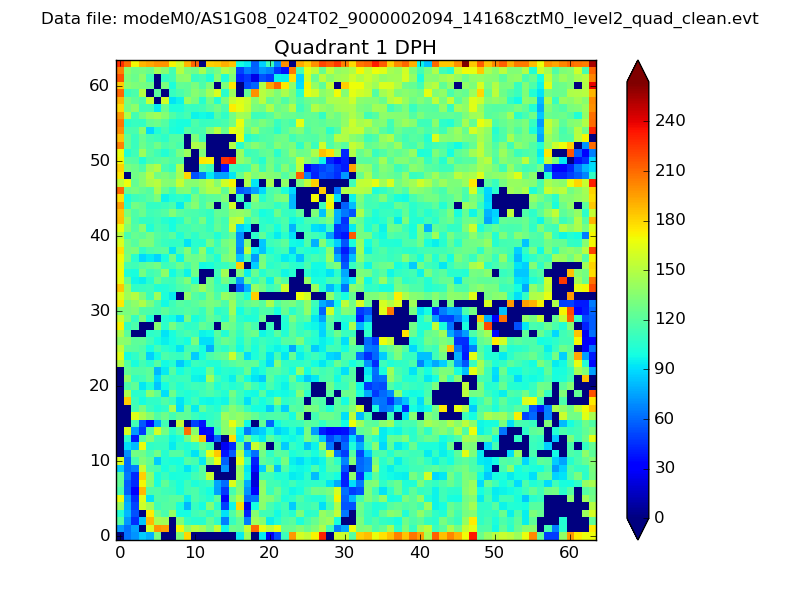 |
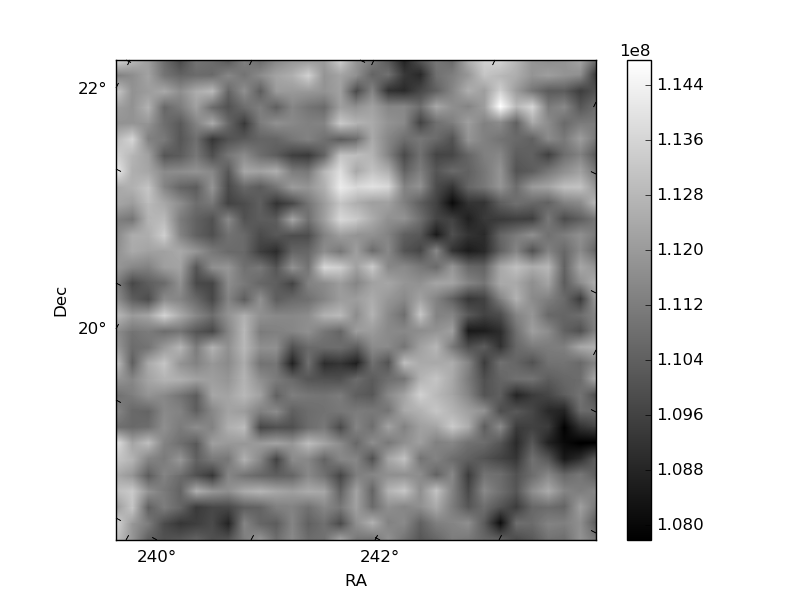
Quadrant B |
|---|---|---|---|
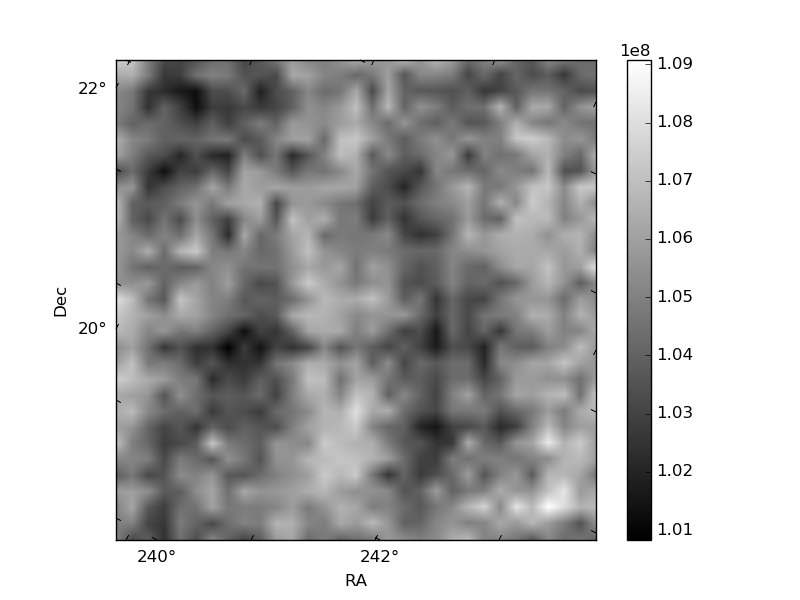
| Quadrant D | 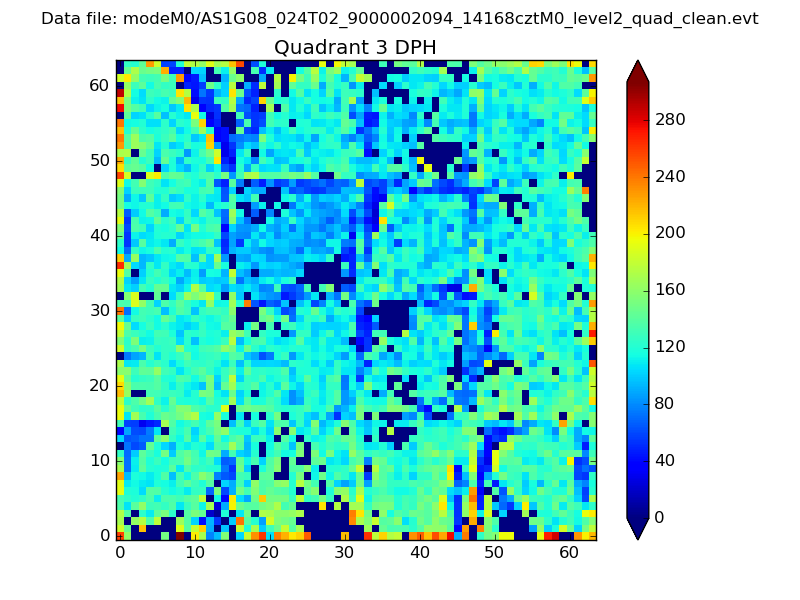 |
 |
Quadrant C |
| Plot type | Count rate plots | Images |
|---|---|---|
| Comparison with Poisson distribution Blue bars denote a histogram of data divided into 1 sec bins. Red curve is a Poisson curve with rate = median count rate of data. |
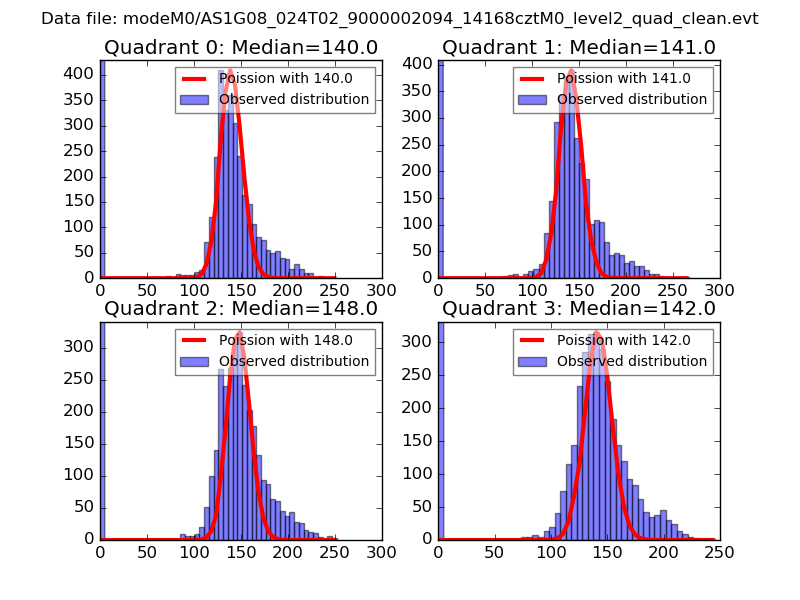 |
 |
| Quadrant-wise count rates Data is divided into 100 sec bins |
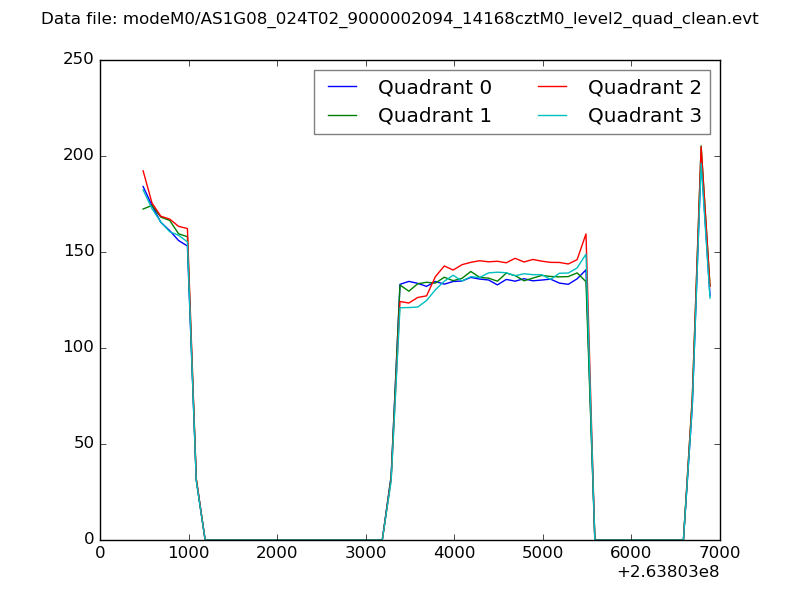 |
|
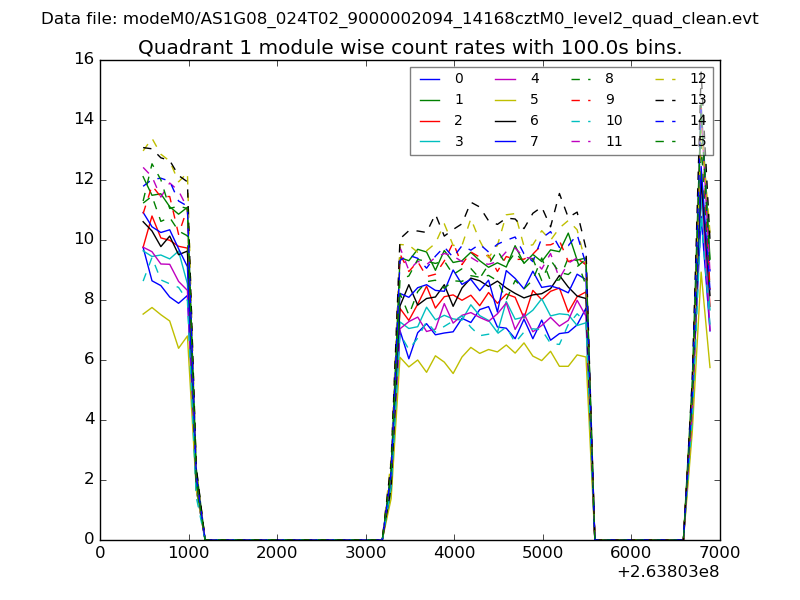
| Module-wise count rates for Quadrant A Data is divided into 100 sec bins |
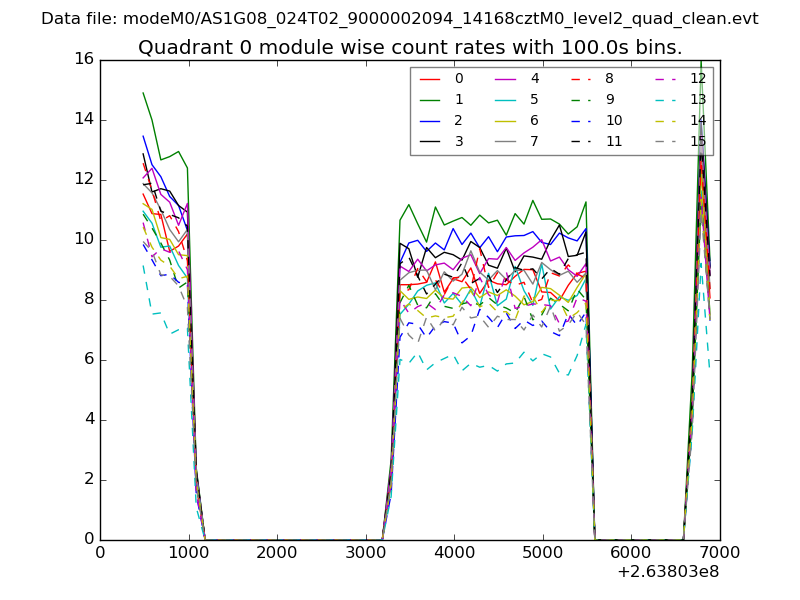 |
 |
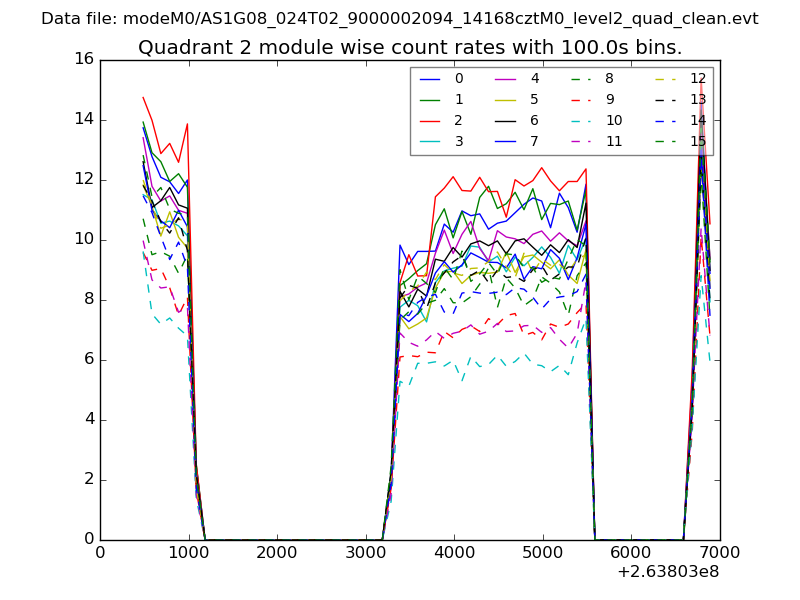
| Module-wise count rates for Quadrant B Data is divided into 100 sec bins |
 |
 |
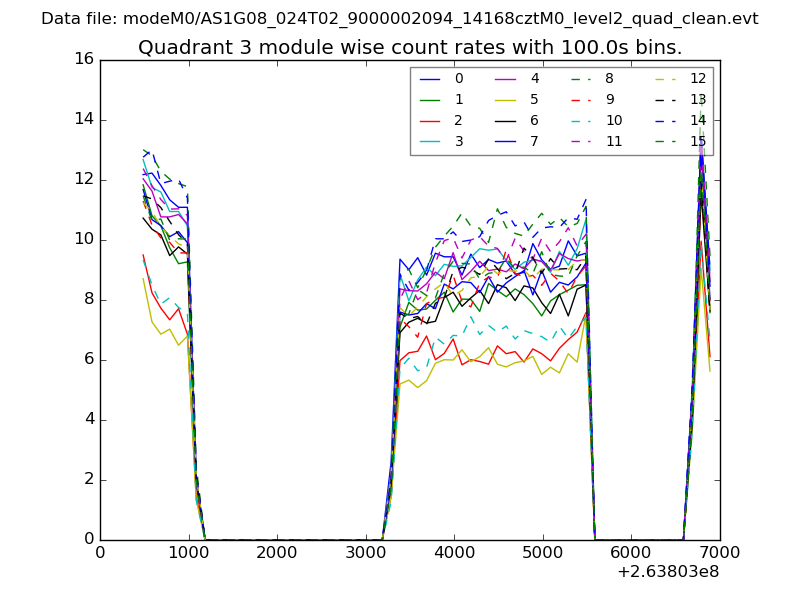
| Module-wise count rates for Quadrant C Data is divided into 100 sec bins |
 |
 |
| Module-wise count rates for Quadrant D Data is divided into 100 sec bins |
 |
 |
| Parameter | Plot |
|---|---|
| CZT HV Monitor | 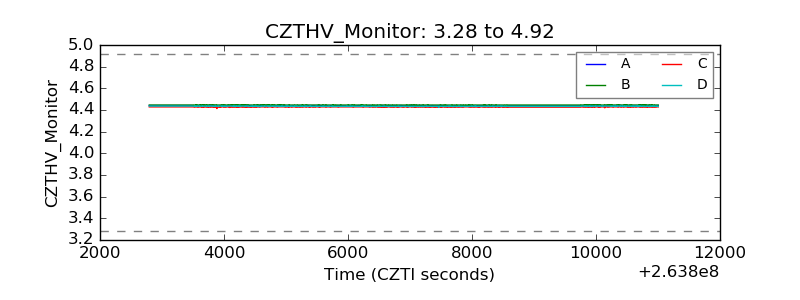 |
| D_VDD | 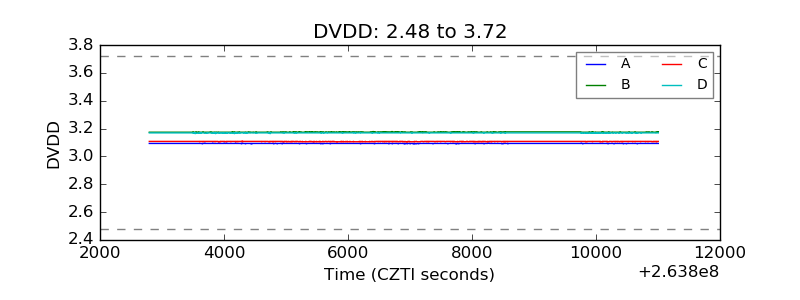 |
| Temperature 1 | 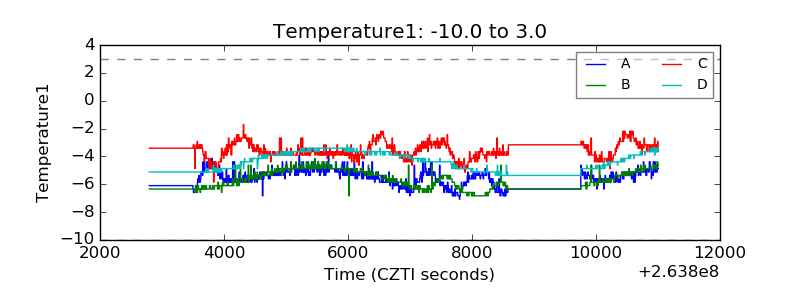 |
| Veto HV Monitor | 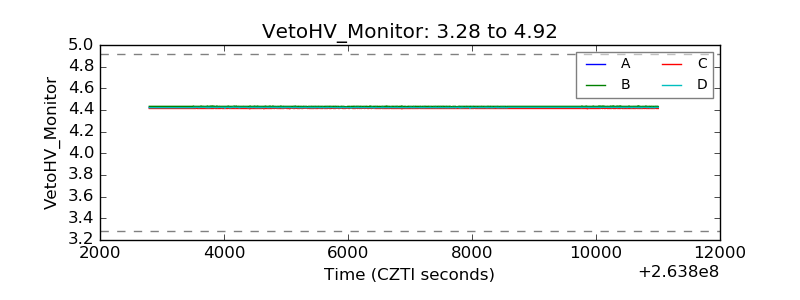 |
| Veto LLD | 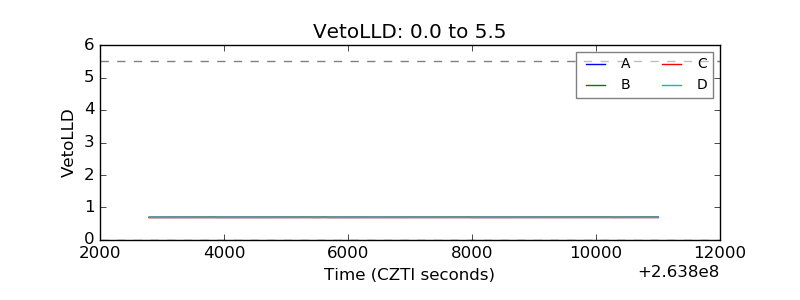 |
| Alpha Counter | 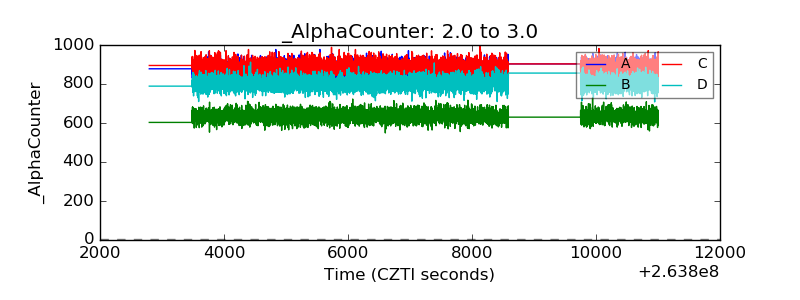 |
| _CPM_Rate | 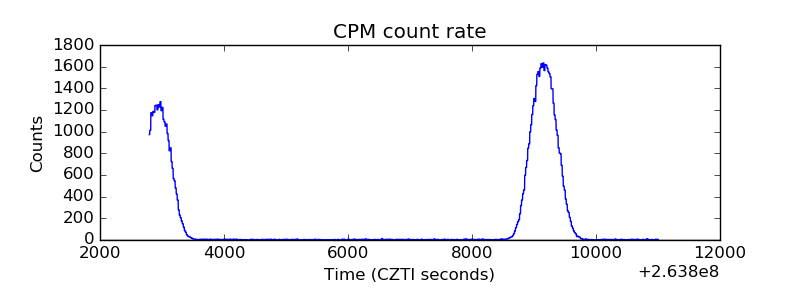 |
| CZT Counter | 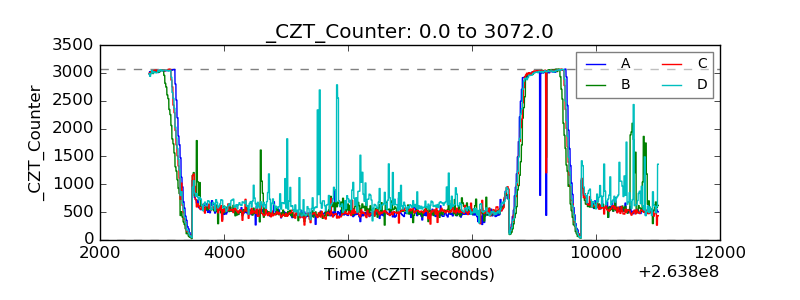 |
| +2.5 Volts monitor |  |
| +5 Volts monitor |  |
| _ROLL_ROT | 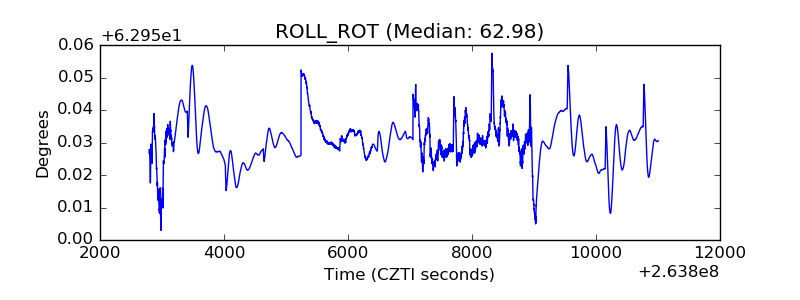 |
| _Roll_DEC | 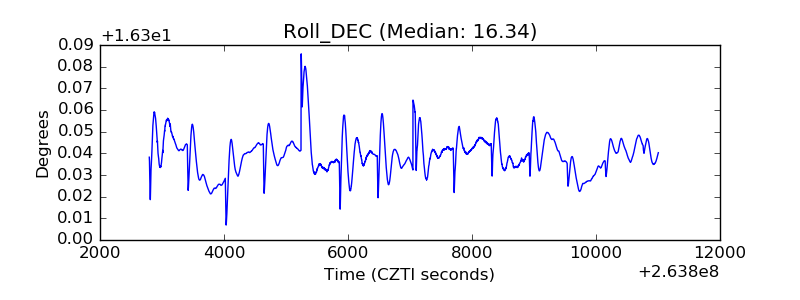 |
| _Roll_RA | 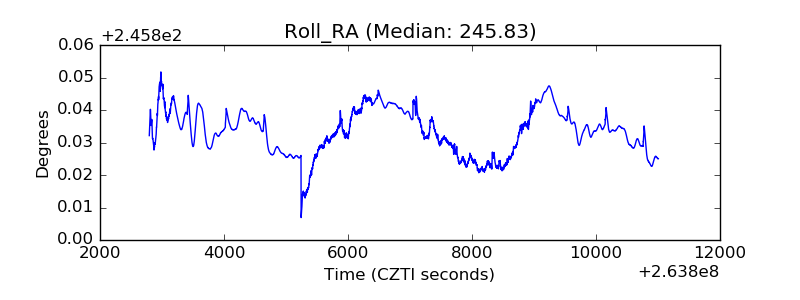 |
| Veto Counter | 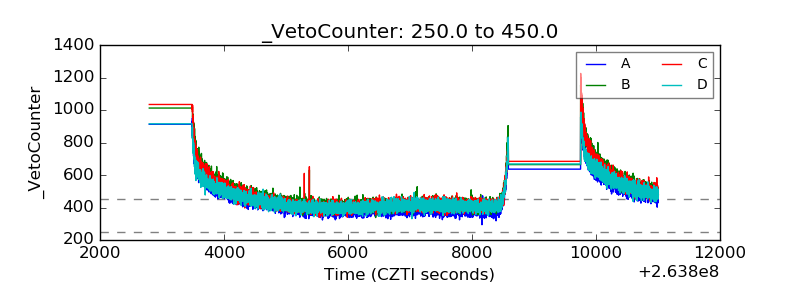 |