| Param | Original file | Final file |
|---|---|---|
| Filename | modeM0/AS1G08_024T02_9000002094_14170cztM0_level2.evt | modeM0/AS1G08_024T02_9000002094_14170cztM0_level2_quad_clean.evt |
| Size (bytes) | 491,299,200 | 70,352,640 |
| Size | 468.5 MB | 67.1 MB |
| Events in quadrant A | 3,359,852 | 416,881 |
| Events in quadrant B | 3,613,786 | 421,263 |
| Events in quadrant C | 3,390,125 | 438,705 |
| Events in quadrant D | 4,094,339 | 420,203 |
| Mode M0 | |||
|---|---|---|---|
| Quadrant | BADHDUFLAG | Total packets | Discarded packets |
| A | 0 | 13731 | 7 |
| B | 0 | 14683 | 2 |
| C | 0 | 13566 | 2 |
| D | 0 | 17061 | 2 |
| Mode SS | |||
|---|---|---|---|
| Quadrant | BADHDUFLAG | Total packets | Discarded packets |
| A | 0 | 126 | 0 |
| B | 0 | 126 | 0 |
| C | 0 | 126 | 0 |
| D | 0 | 126 | 0 |
| Mode M9 | |||
|---|---|---|---|
| Quadrant | BADHDUFLAG | Total packets | Discarded packets |
| A | 0 | 21 | 0 |
| B | 0 | 21 | 0 |
| C | 0 | 21 | 0 |
| D | 0 | 22 | 0 |
| Quadrant | Total seconds | Saturated seconds | Saturation percentage |
|---|---|---|---|
| A | 6205 | 103 | 1.659952% |
| B | 6207 | 135 | 2.174964% |
| C | 6207 | 75 | 1.208313% |
| D | 6207 | 90 | 1.449976% |
Noise dominated data is calculated using 1-second bins in cleaned event files. If a bin has >2000 counts, and if more than 50% of those come from <1% of pixels, then it is considered to be noise-dominated and hence unusable.
| Quadrant | # 1 sec bins | Bins with >0 counts | Bins with >2000 counts | High rate bins dominated by noise | Noise dominated (total time) | Noise dominated (detector-on time) | Marked lightcurve |
|---|---|---|---|---|---|---|---|
| A | 7493 | 6208 | 0 | 0 | 0.00% | 0.00% | 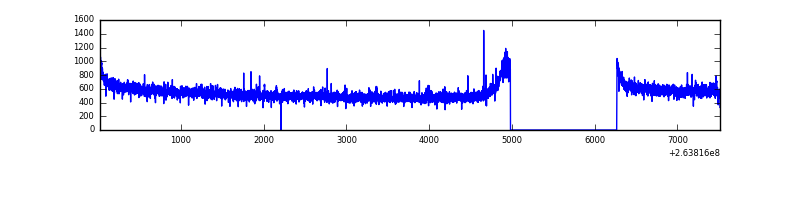 |
| B | 7493 | 6209 | 1 | 1 | 0.01% | 0.02% | 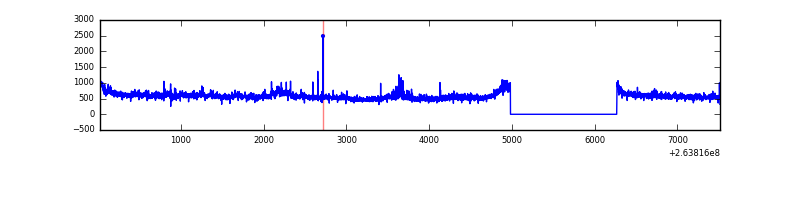 |
| C | 7493 | 6209 | 0 | 0 | 0.00% | 0.00% | 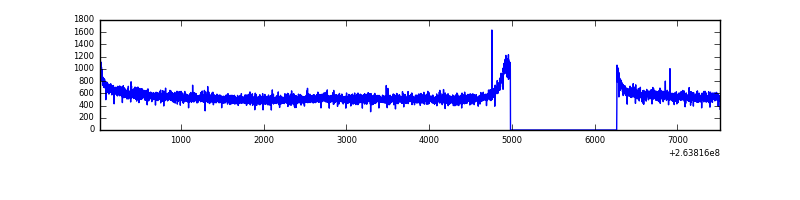 |
| D | 7493 | 6209 | 3 | 3 | 0.04% | 0.05% | 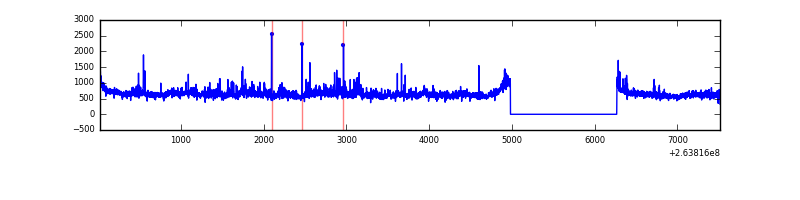 |
Top three noisy pixels from each quadrant. If the there are fewer than three noisy pixels in the level2.evt file, extra rows are filled as -1
| Pixel properties | Quadrant properties | ||||||
|---|---|---|---|---|---|---|---|
| Quadrant | DetID | PixID | Counts | Sigma | Mean | Median | Sigma |
| A | 8 | 15 | 16763 | 92.08 | 865 | 849 | 172.8 |
| A | 12 | 189 | 9763 | 51.58 | 865 | 849 | 172.8 |
| A | 0 | 226 | 7744 | 39.89 | 865 | 849 | 172.8 |
| B | 0 | 85 | 232825 | 1437.49 | 858 | 841 | 161.4 |
| B | 12 | 111 | 18920 | 112.03 | 858 | 841 | 161.4 |
| B | 11 | 111 | 16221 | 95.3 | 858 | 841 | 161.4 |
| C | 3 | 233 | 109245 | 566.83 | 841 | 851 | 191.2 |
| C | 13 | 61 | 6046 | 27.17 | 841 | 851 | 191.2 |
| C | 14 | 234 | 2768 | 10.02 | 841 | 851 | 191.2 |
| D | 8 | 195 | 525701 | 2649.21 | 841 | 823 | 198.1 |
| D | 1 | 52 | 302418 | 1522.23 | 841 | 823 | 198.1 |
| D | 10 | 157 | 39898 | 197.22 | 841 | 823 | 198.1 |
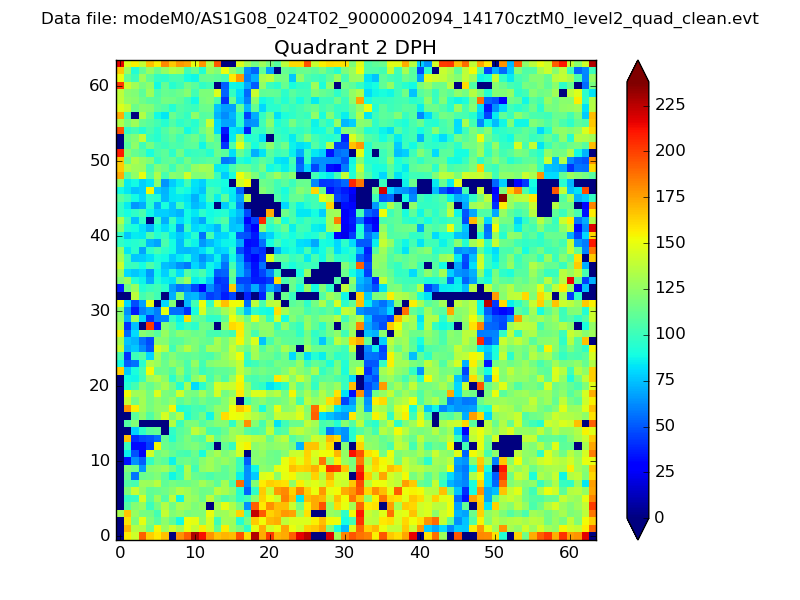
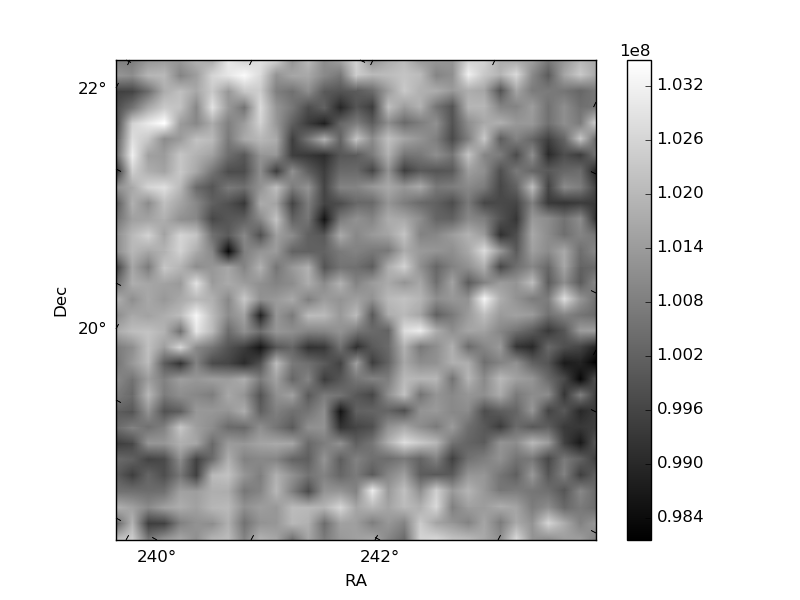
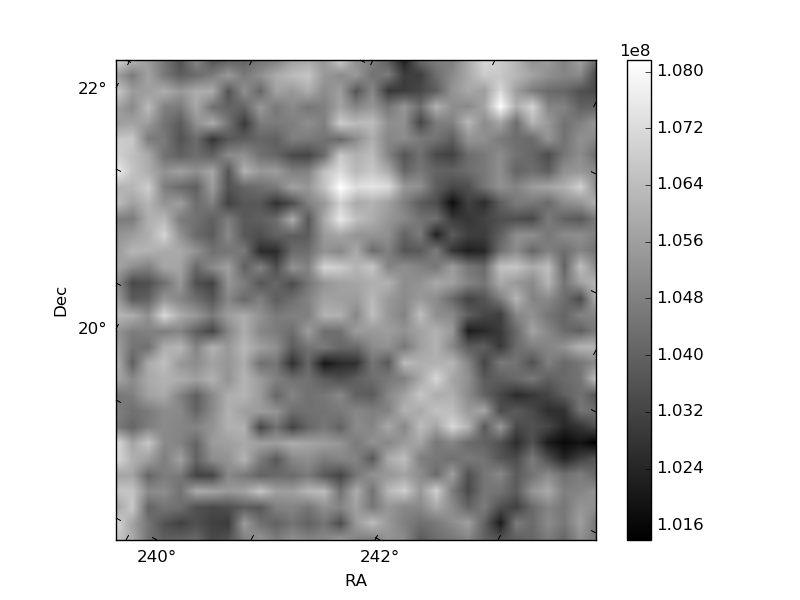
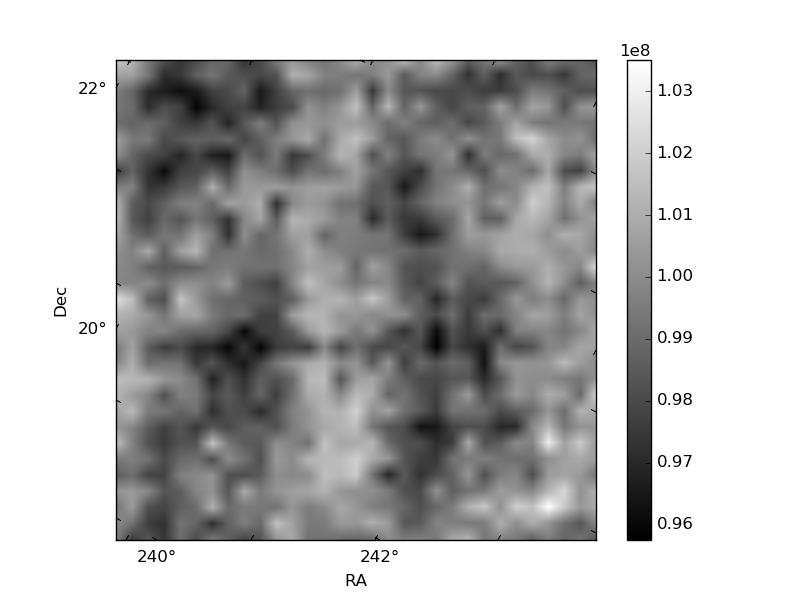
Histogram calculated using DETX and DETY for each event in the final _common_clean file
| Quadrant A | 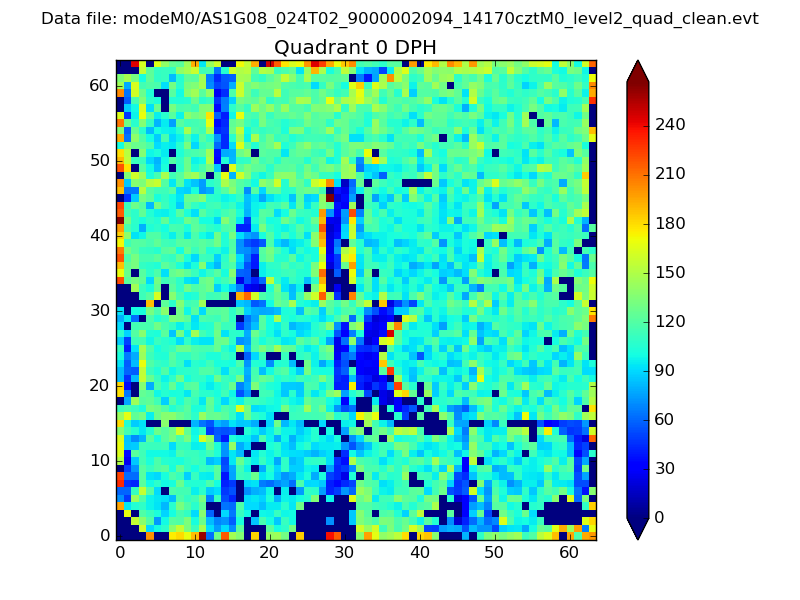 |
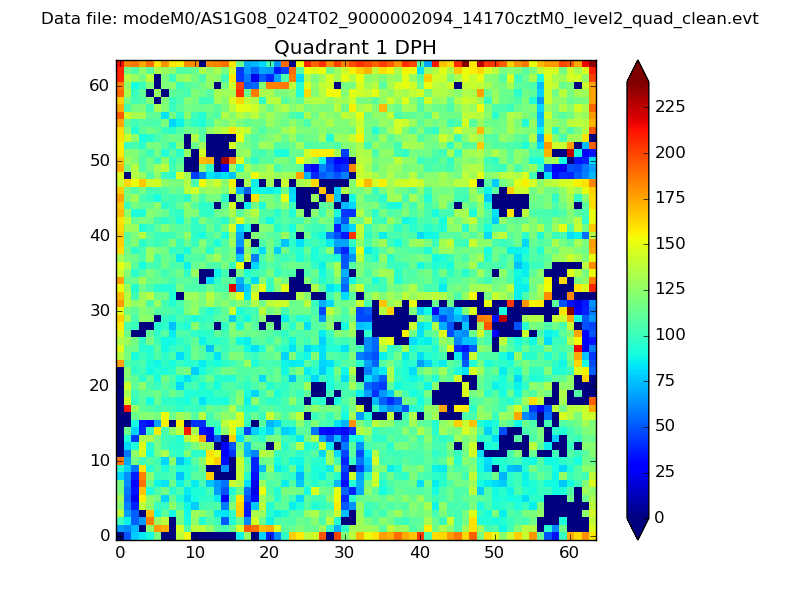 |
Quadrant B |
|---|---|---|---|
| Quadrant D | 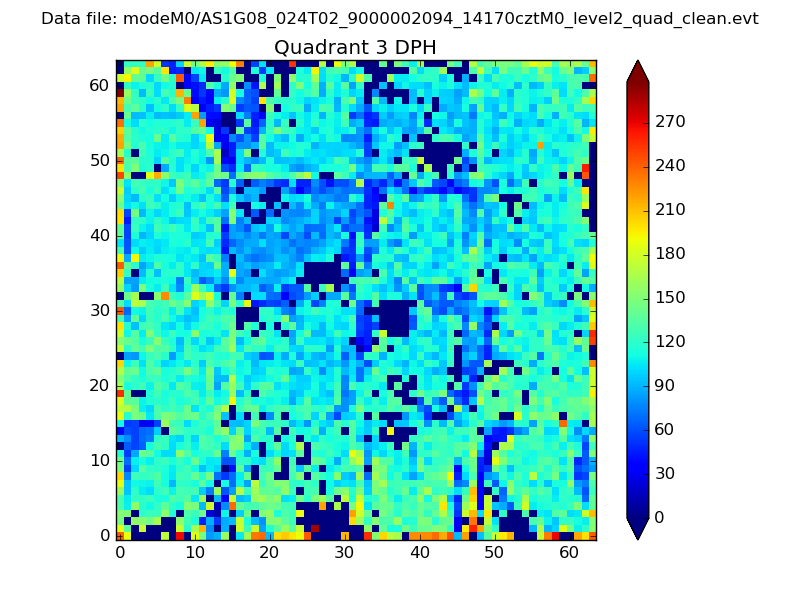 |
 |
Quadrant C |
| Plot type | Count rate plots | Images |
|---|---|---|
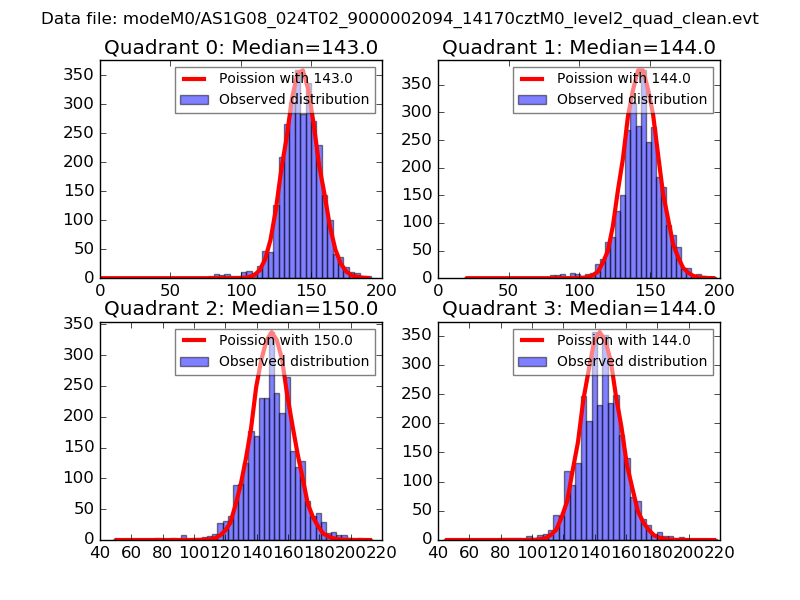
| Comparison with Poisson distribution Blue bars denote a histogram of data divided into 1 sec bins. Red curve is a Poisson curve with rate = median count rate of data. |
 |
 |
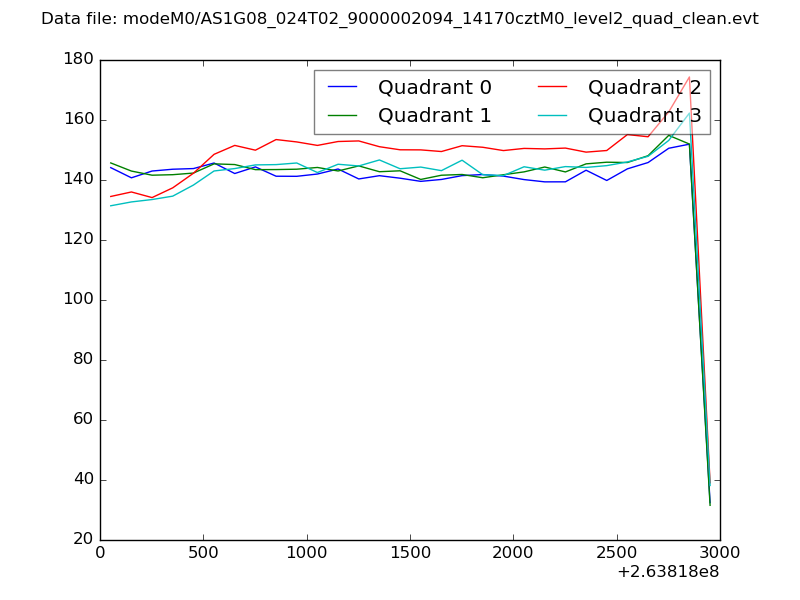
| Quadrant-wise count rates Data is divided into 100 sec bins |
 |
|
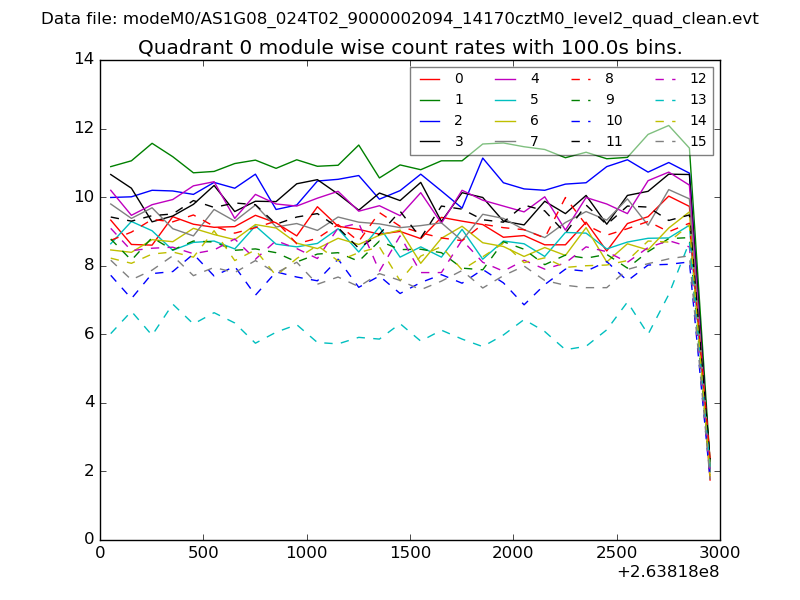
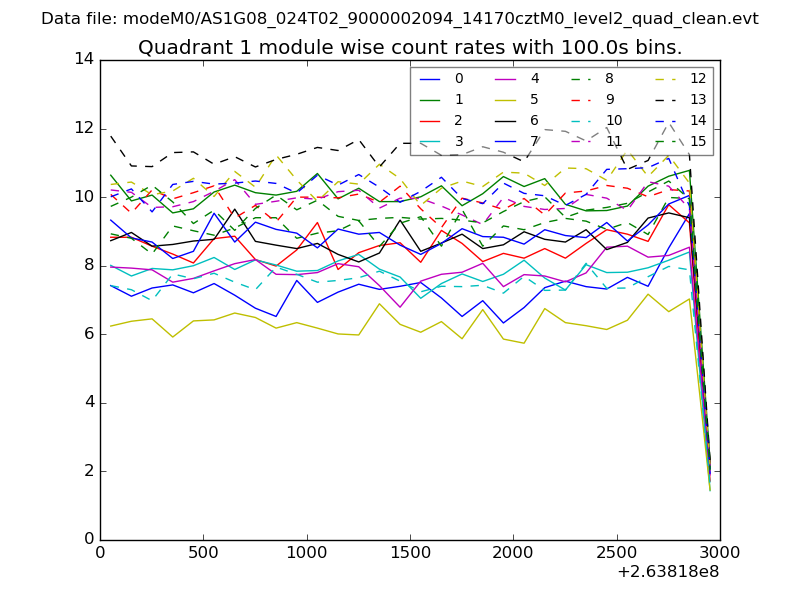
| Module-wise count rates for Quadrant A Data is divided into 100 sec bins |
 |
 |
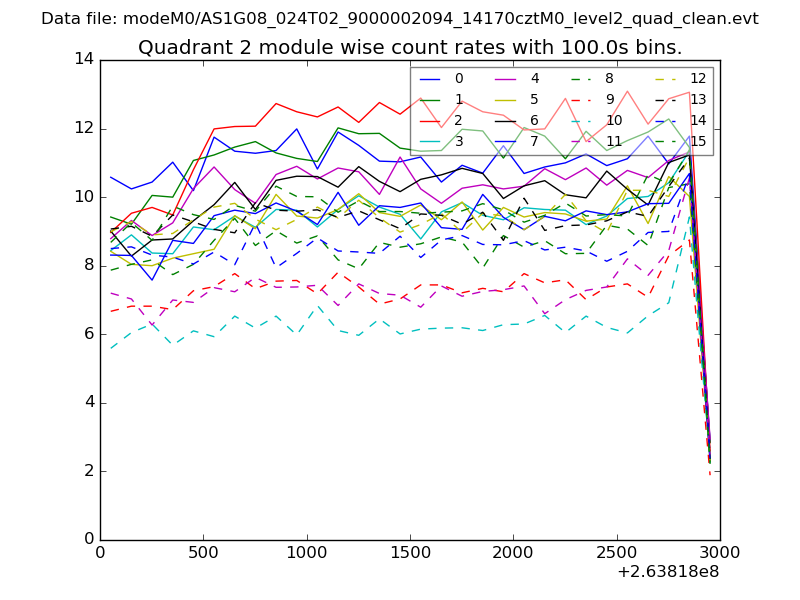
| Module-wise count rates for Quadrant B Data is divided into 100 sec bins |
 |
 |
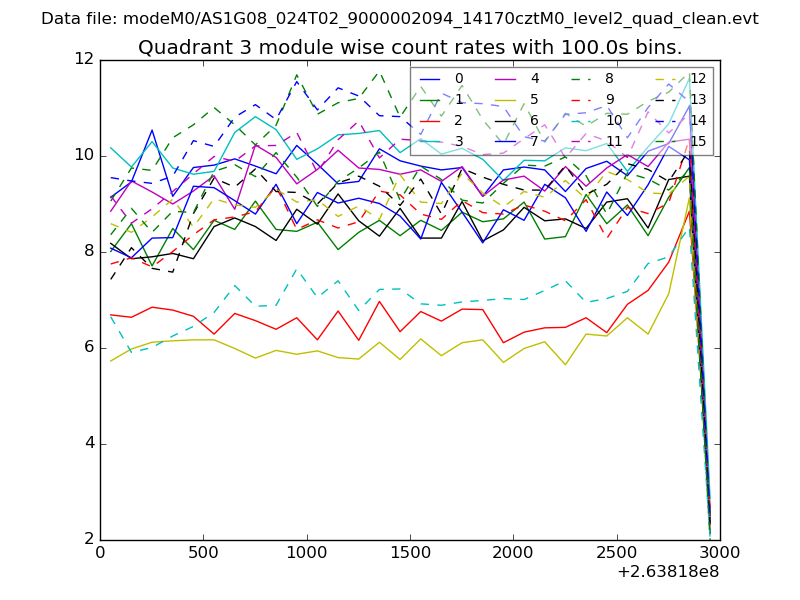
| Module-wise count rates for Quadrant C Data is divided into 100 sec bins |
 |
 |
| Module-wise count rates for Quadrant D Data is divided into 100 sec bins |
 |
 |
| Parameter | Plot |
|---|---|
| CZT HV Monitor | 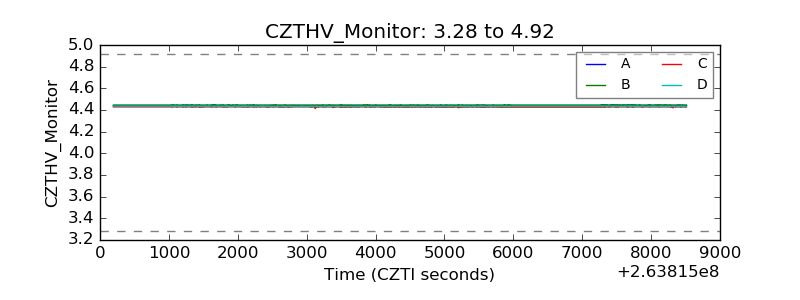 |
| D_VDD | 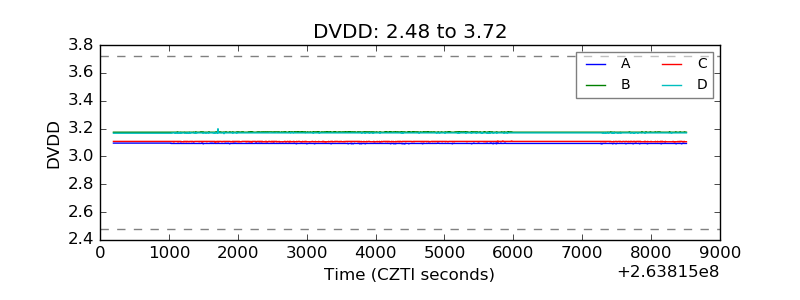 |
| Temperature 1 |  |
| Veto HV Monitor | 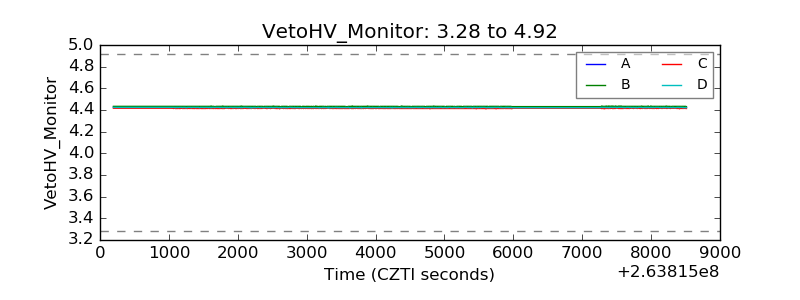 |
| Veto LLD | 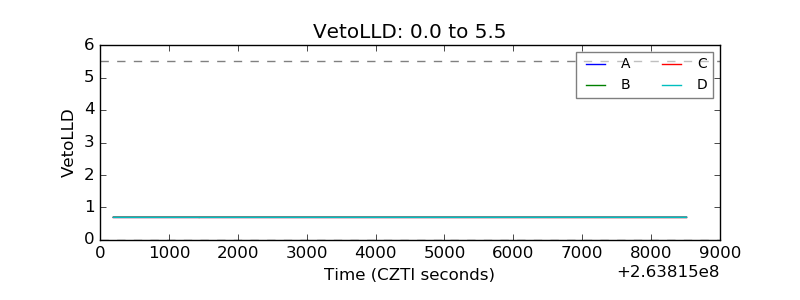 |
| Alpha Counter | 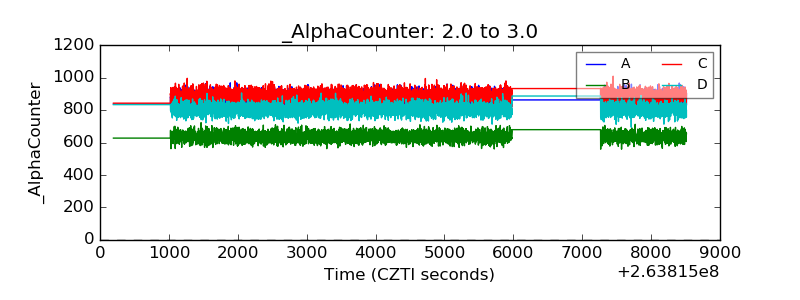 |
| _CPM_Rate | 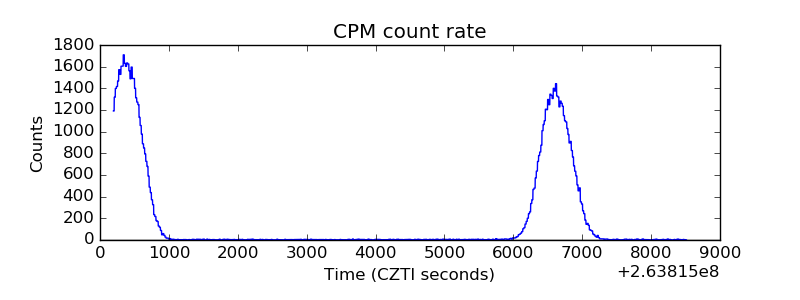 |
| CZT Counter | 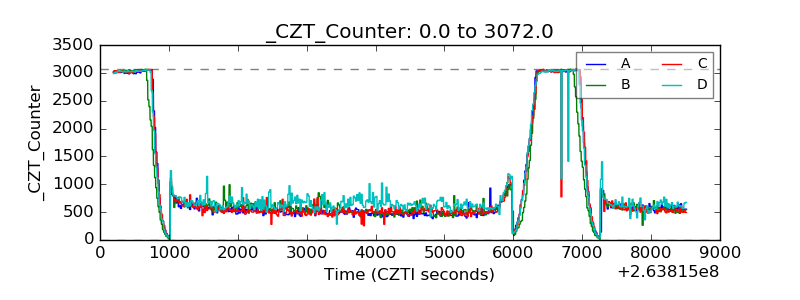 |
| +2.5 Volts monitor |  |
| +5 Volts monitor |  |
| _ROLL_ROT | 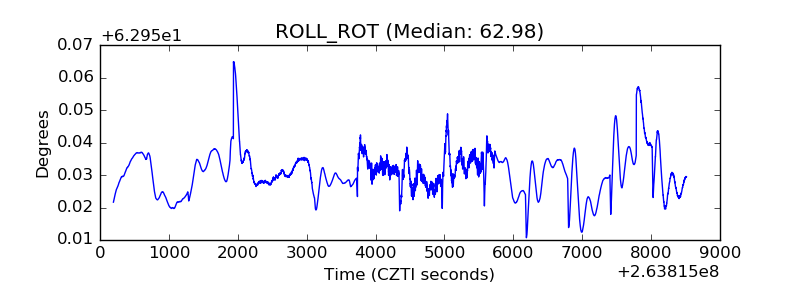 |
| _Roll_DEC |  |
| _Roll_RA | 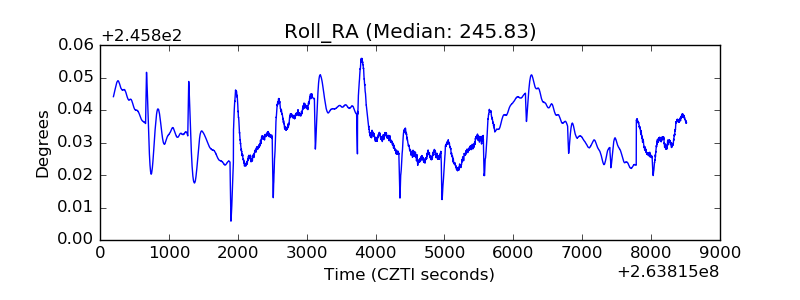 |
| Veto Counter | 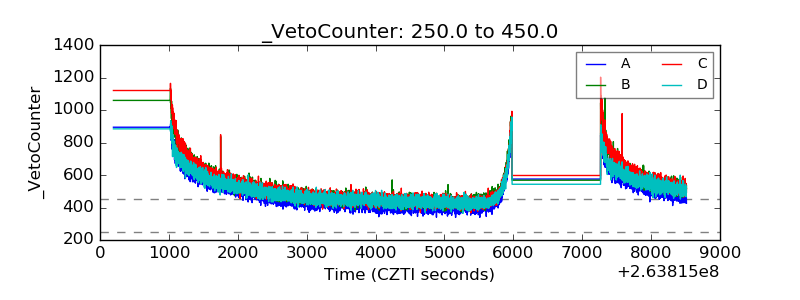 |