| Param | Original file | Final file |
|---|---|---|
| Filename | modeM0/AS1G08_024T02_9000002094_14171cztM0_level2.evt | modeM0/AS1G08_024T02_9000002094_14171cztM0_level2_quad_clean.evt |
| Size (bytes) | 480,211,200 | 80,899,200 |
| Size | 458.0 MB | 77.2 MB |
| Events in quadrant A | 3,354,272 | 492,693 |
| Events in quadrant B | 3,447,233 | 498,628 |
| Events in quadrant C | 3,448,754 | 520,149 |
| Events in quadrant D | 3,862,806 | 495,969 |
| Mode M0 | |||
|---|---|---|---|
| Quadrant | BADHDUFLAG | Total packets | Discarded packets |
| A | 0 | 13781 | 3 |
| B | 0 | 14074 | 2 |
| C | 0 | 13726 | 2 |
| D | 0 | 15767 | 2 |
| Mode SS | |||
|---|---|---|---|
| Quadrant | BADHDUFLAG | Total packets | Discarded packets |
| A | 0 | 128 | 0 |
| B | 0 | 128 | 0 |
| C | 0 | 128 | 0 |
| D | 0 | 128 | 0 |
| Mode M9 | |||
|---|---|---|---|
| Quadrant | BADHDUFLAG | Total packets | Discarded packets |
| A | 0 | 23 | 0 |
| B | 0 | 23 | 0 |
| C | 0 | 23 | 0 |
| D | 0 | 24 | 0 |
| Quadrant | Total seconds | Saturated seconds | Saturation percentage |
|---|---|---|---|
| A | 6341 | 114 | 1.797824% |
| B | 6341 | 152 | 2.397098% |
| C | 6341 | 94 | 1.482416% |
| D | 6341 | 107 | 1.687431% |
Noise dominated data is calculated using 1-second bins in cleaned event files. If a bin has >2000 counts, and if more than 50% of those come from <1% of pixels, then it is considered to be noise-dominated and hence unusable.
| Quadrant | # 1 sec bins | Bins with >0 counts | Bins with >2000 counts | High rate bins dominated by noise | Noise dominated (total time) | Noise dominated (detector-on time) | Marked lightcurve |
|---|---|---|---|---|---|---|---|
| A | 7602 | 6344 | 0 | 0 | 0.00% | 0.00% | 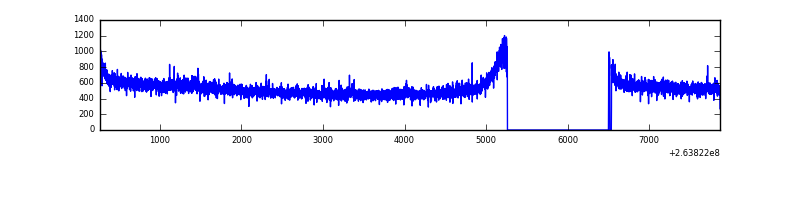 |
| B | 7602 | 6344 | 7 | 7 | 0.09% | 0.11% | 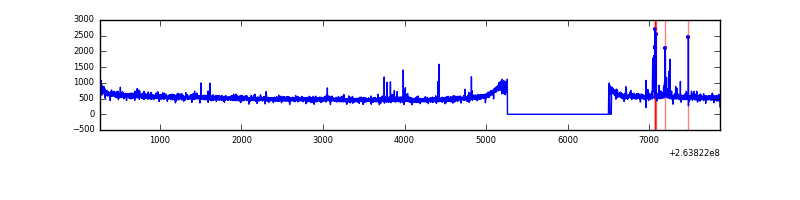 |
| C | 7602 | 6344 | 0 | 0 | 0.00% | 0.00% | 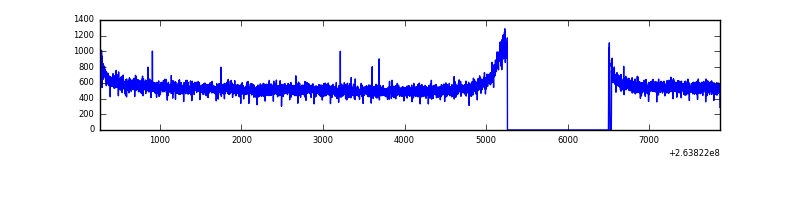 |
| D | 7602 | 6344 | 1 | 1 | 0.01% | 0.02% | 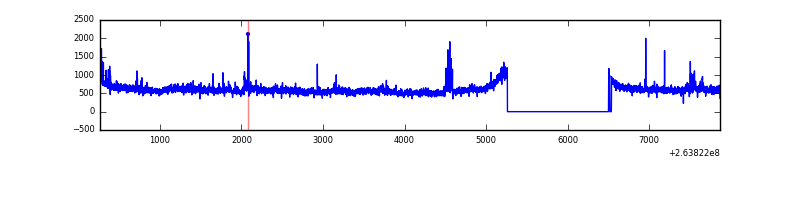 |
Top three noisy pixels from each quadrant. If the there are fewer than three noisy pixels in the level2.evt file, extra rows are filled as -1
| Pixel properties | Quadrant properties | ||||||
|---|---|---|---|---|---|---|---|
| Quadrant | DetID | PixID | Counts | Sigma | Mean | Median | Sigma |
| A | 8 | 15 | 17574 | 97.15 | 864 | 847 | 172.2 |
| A | 12 | 189 | 15919 | 87.54 | 864 | 847 | 172.2 |
| A | 0 | 226 | 7672 | 39.64 | 864 | 847 | 172.2 |
| B | 10 | 244 | 70004 | 427.49 | 855 | 836 | 161.8 |
| B | 12 | 111 | 19381 | 114.62 | 855 | 836 | 161.8 |
| B | 0 | 189 | 16587 | 97.35 | 855 | 836 | 161.8 |
| C | 3 | 233 | 147076 | 752.78 | 847 | 854 | 194.2 |
| C | 13 | 61 | 5953 | 26.25 | 847 | 854 | 194.2 |
| C | 14 | 234 | 1985 | 5.82 | 847 | 854 | 194.2 |
| D | 8 | 195 | 459269 | 2309.88 | 843 | 826 | 198.5 |
| D | 1 | 52 | 85849 | 428.39 | 843 | 826 | 198.5 |
| D | 10 | 157 | 58671 | 291.45 | 843 | 826 | 198.5 |
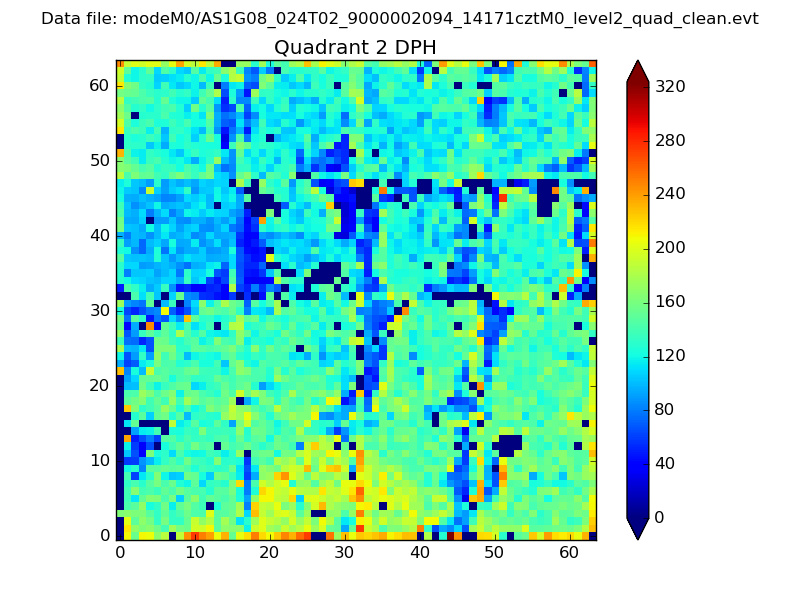
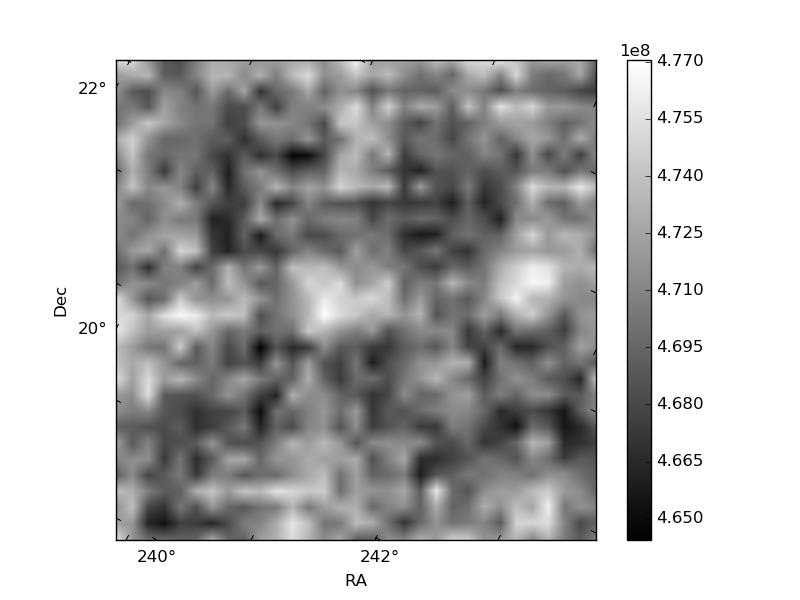
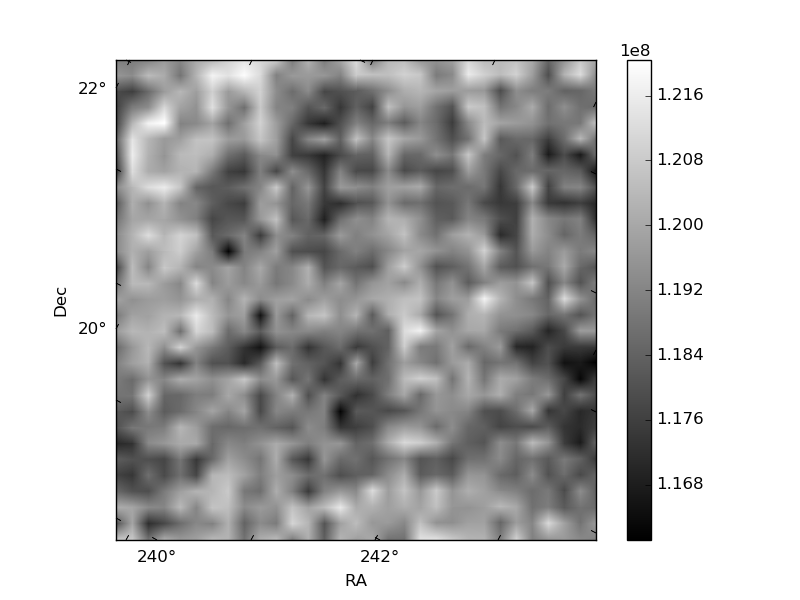
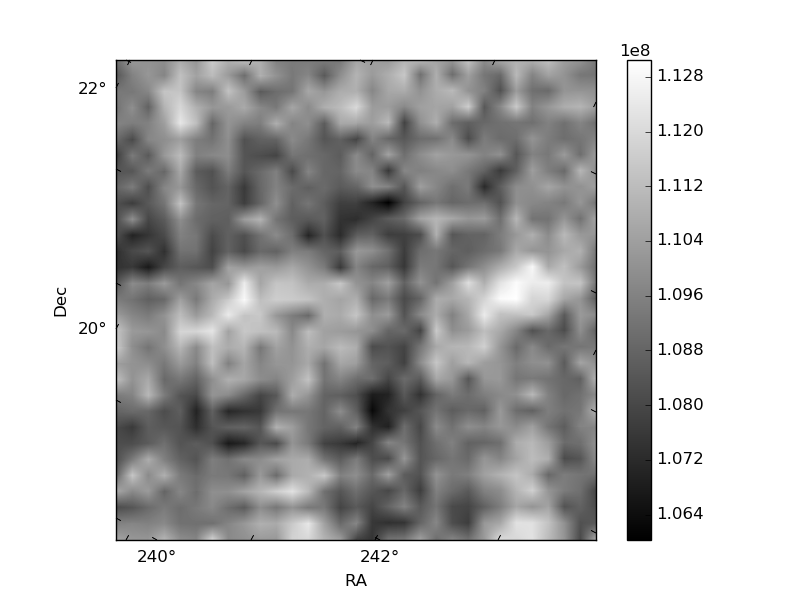
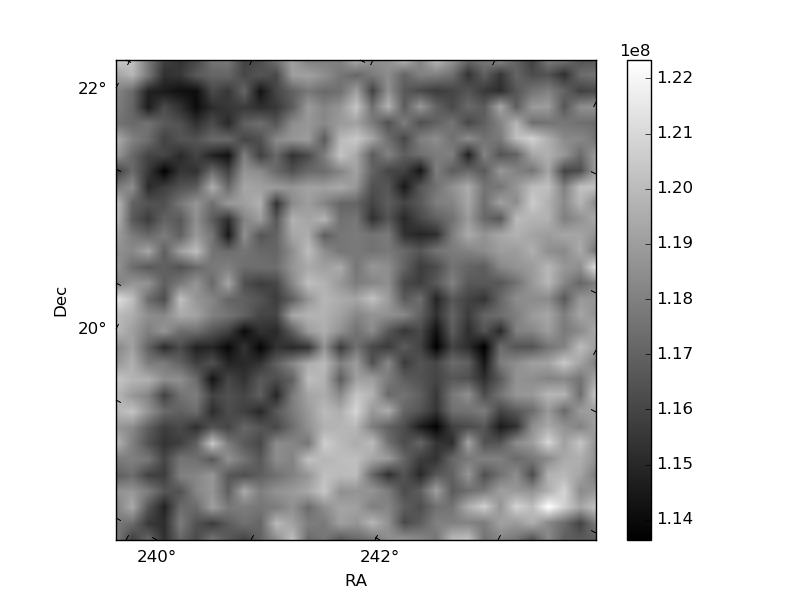
Histogram calculated using DETX and DETY for each event in the final _common_clean file
| Quadrant A | 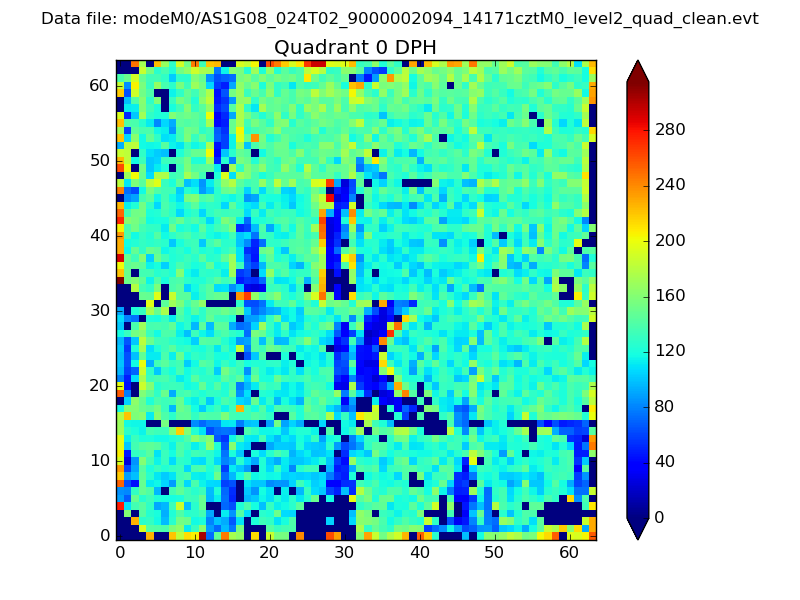 |
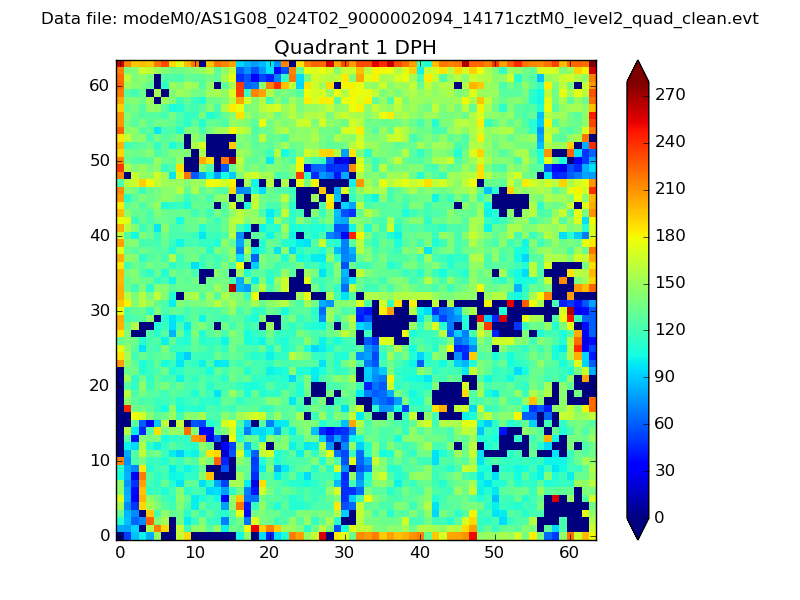 |
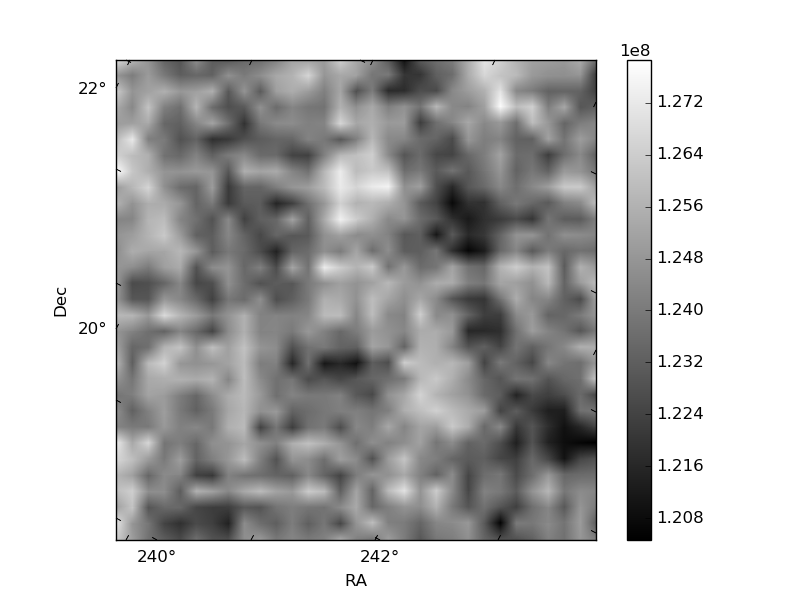
Quadrant B |
|---|---|---|---|
| Quadrant D | 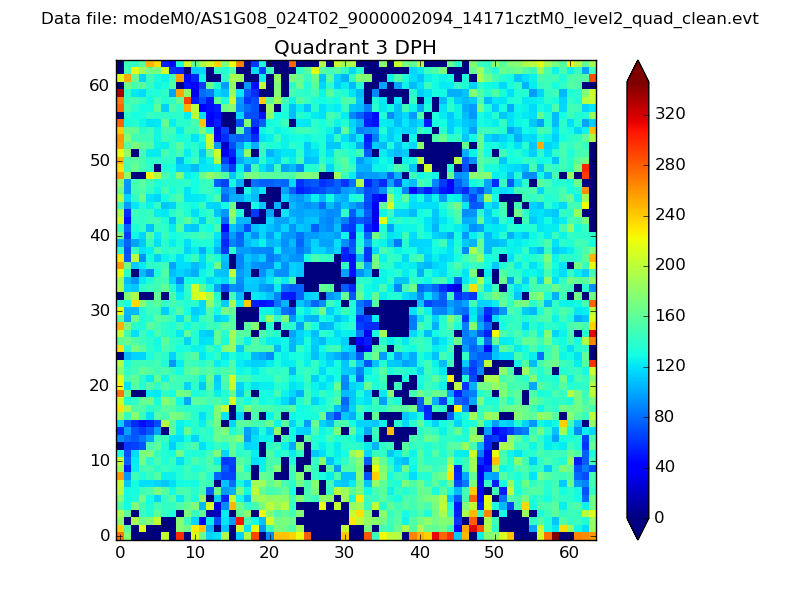 |
 |
Quadrant C |
| Plot type | Count rate plots | Images |
|---|---|---|
| Comparison with Poisson distribution Blue bars denote a histogram of data divided into 1 sec bins. Red curve is a Poisson curve with rate = median count rate of data. |
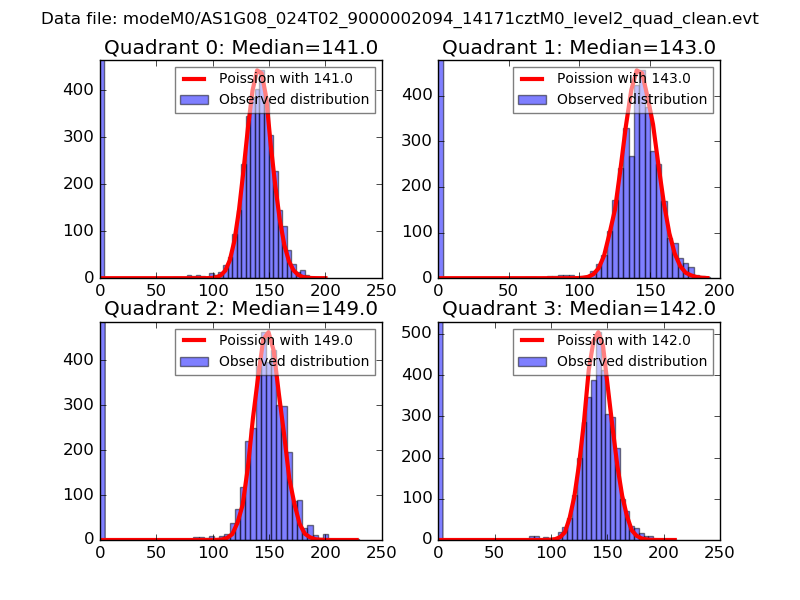 |
 |
| Quadrant-wise count rates Data is divided into 100 sec bins |
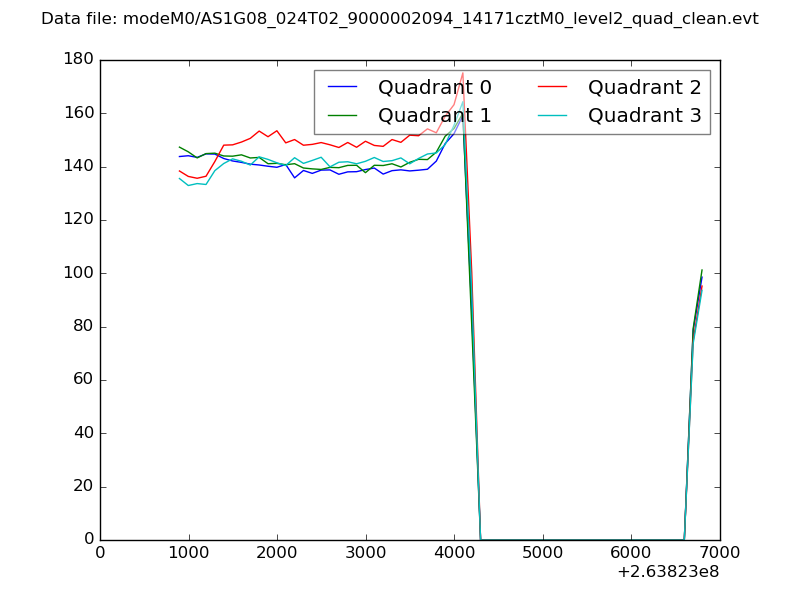 |
|
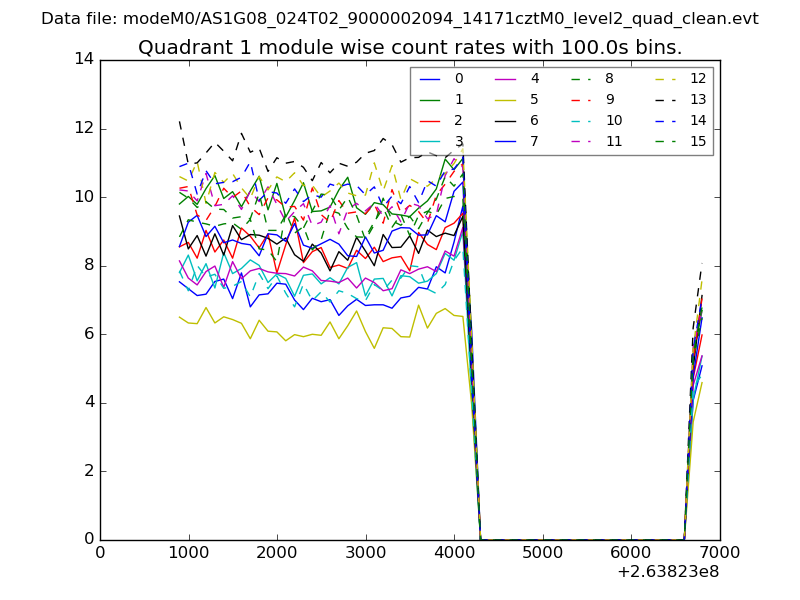
| Module-wise count rates for Quadrant A Data is divided into 100 sec bins |
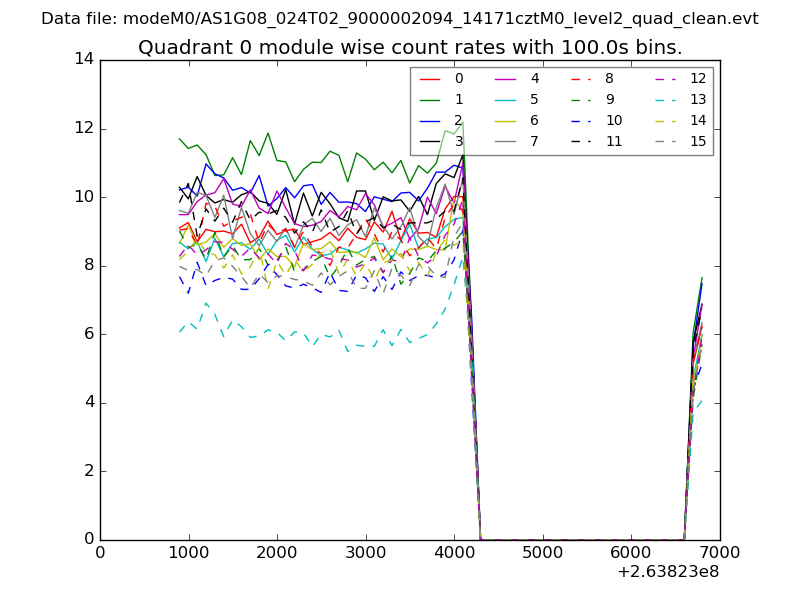 |
 |
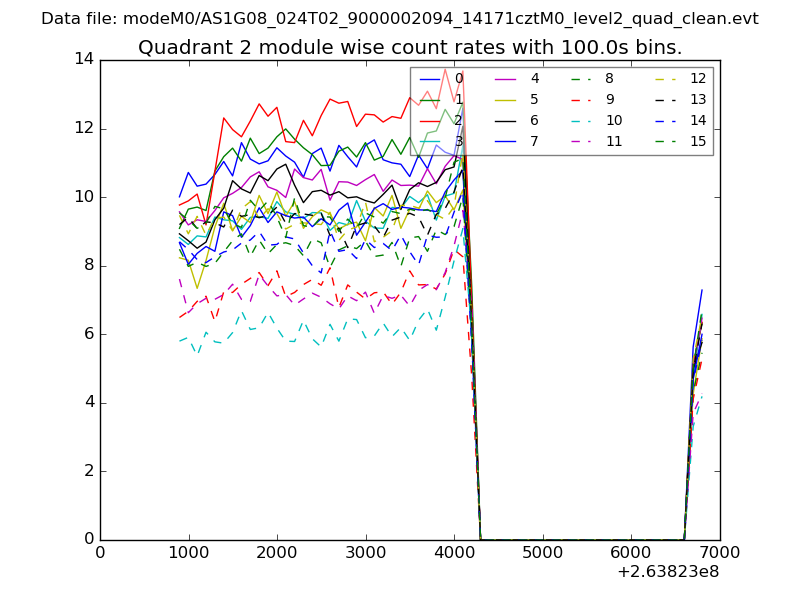
| Module-wise count rates for Quadrant B Data is divided into 100 sec bins |
 |
 |
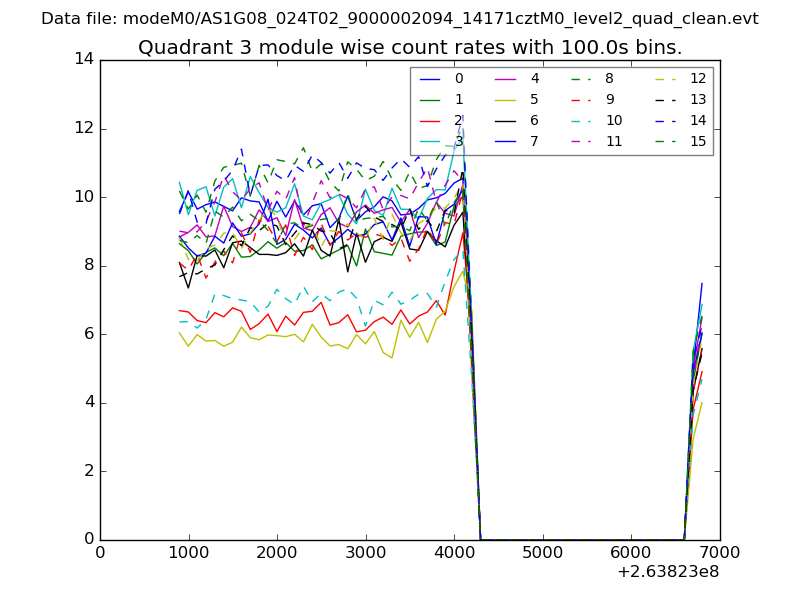
| Module-wise count rates for Quadrant C Data is divided into 100 sec bins |
 |
 |
| Module-wise count rates for Quadrant D Data is divided into 100 sec bins |
 |
 |
| Parameter | Plot |
|---|---|
| CZT HV Monitor | 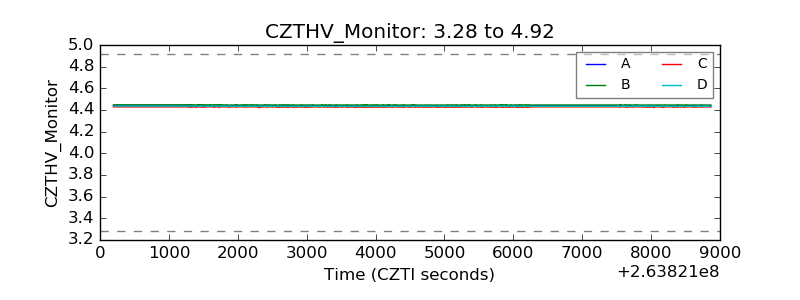 |
| D_VDD | 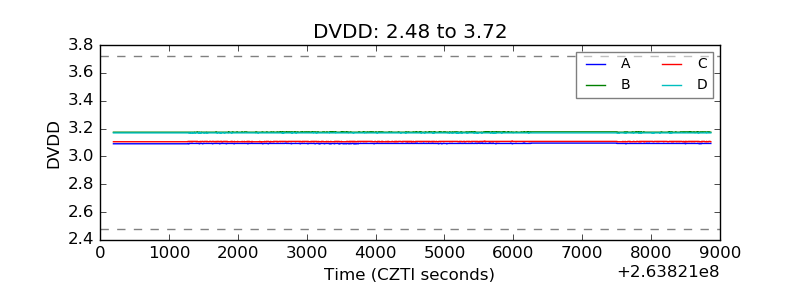 |
| Temperature 1 |  |
| Veto HV Monitor | 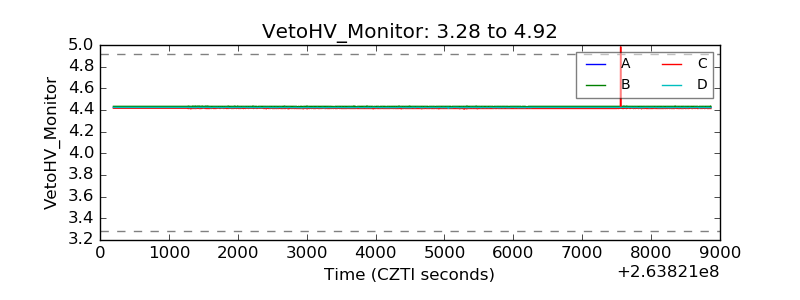 |
| Veto LLD | 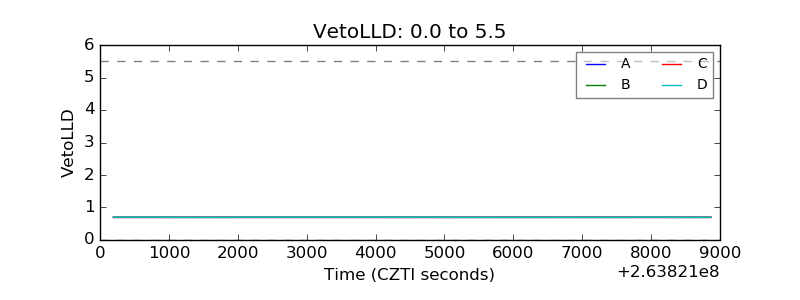 |
| Alpha Counter | 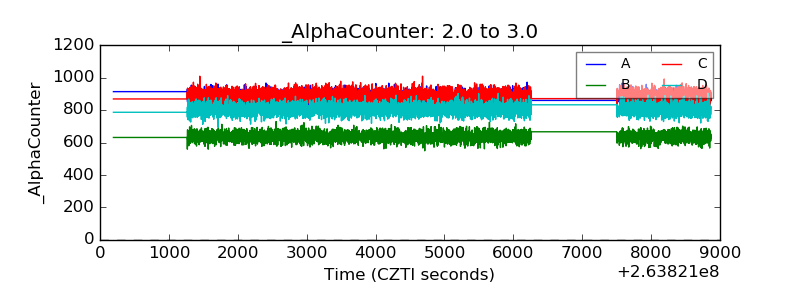 |
| _CPM_Rate | 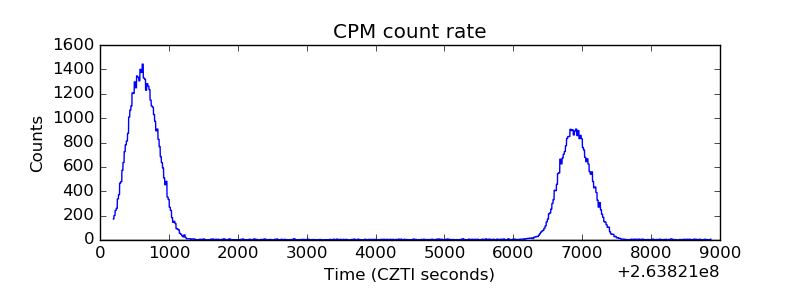 |
| CZT Counter |  |
| +2.5 Volts monitor |  |
| +5 Volts monitor |  |
| _ROLL_ROT | 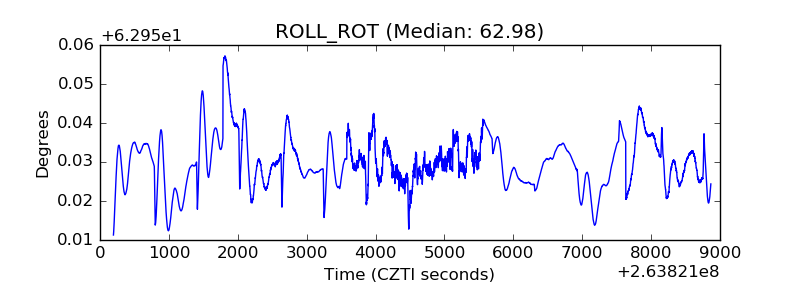 |
| _Roll_DEC | 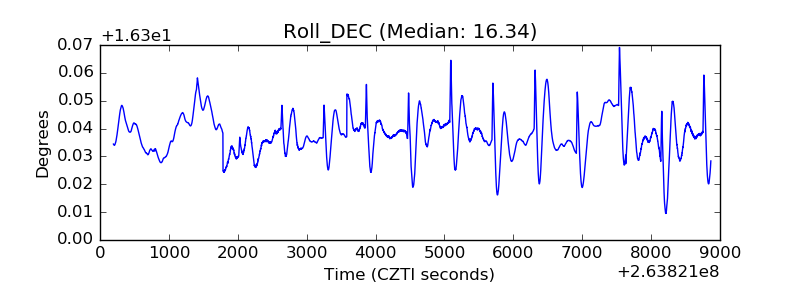 |
| _Roll_RA | 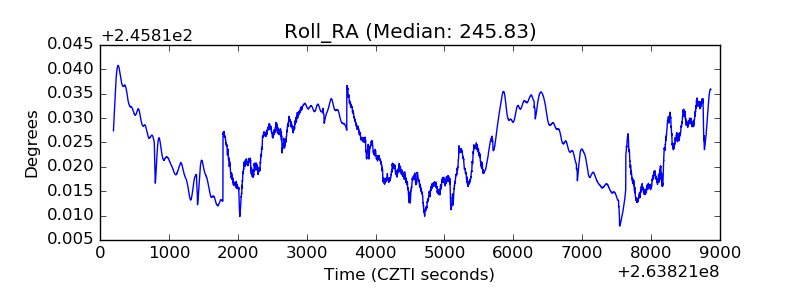 |
| Veto Counter | 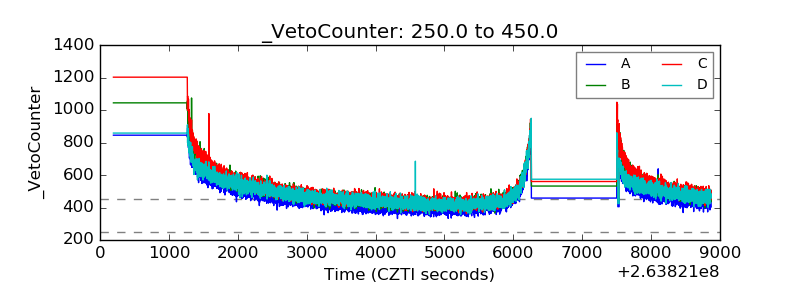 |