| Param | Original file | Final file |
|---|---|---|
| Filename | modeM0/AS1G08_024T02_9000002094_14172cztM0_level2.evt | modeM0/AS1G08_024T02_9000002094_14172cztM0_level2_quad_clean.evt |
| Size (bytes) | 487,658,880 | 91,609,920 |
| Size | 465.1 MB | 87.4 MB |
| Events in quadrant A | 3,371,954 | 565,771 |
| Events in quadrant B | 3,564,535 | 574,610 |
| Events in quadrant C | 3,516,068 | 598,708 |
| Events in quadrant D | 3,868,834 | 575,766 |
| Mode M0 | |||
|---|---|---|---|
| Quadrant | BADHDUFLAG | Total packets | Discarded packets |
| A | 0 | 13976 | 3 |
| B | 0 | 14542 | 2 |
| C | 0 | 14070 | 2 |
| D | 0 | 15605 | 2 |
| Mode SS | |||
|---|---|---|---|
| Quadrant | BADHDUFLAG | Total packets | Discarded packets |
| A | 0 | 134 | 0 |
| B | 0 | 134 | 0 |
| C | 0 | 134 | 0 |
| D | 0 | 134 | 0 |
| Mode M9 | |||
|---|---|---|---|
| Quadrant | BADHDUFLAG | Total packets | Discarded packets |
| A | 0 | 24 | 0 |
| B | 0 | 24 | 0 |
| C | 0 | 24 | 0 |
| D | 0 | 24 | 0 |
| Quadrant | Total seconds | Saturated seconds | Saturation percentage |
|---|---|---|---|
| A | 6594 | 131 | 1.986655% |
| B | 6594 | 211 | 3.199879% |
| C | 6594 | 123 | 1.865332% |
| D | 6594 | 127 | 1.925993% |
Noise dominated data is calculated using 1-second bins in cleaned event files. If a bin has >2000 counts, and if more than 50% of those come from <1% of pixels, then it is considered to be noise-dominated and hence unusable.
| Quadrant | # 1 sec bins | Bins with >0 counts | Bins with >2000 counts | High rate bins dominated by noise | Noise dominated (total time) | Noise dominated (detector-on time) | Marked lightcurve |
|---|---|---|---|---|---|---|---|
| A | 8945 | 6599 | 0 | 0 | 0.00% | 0.00% | 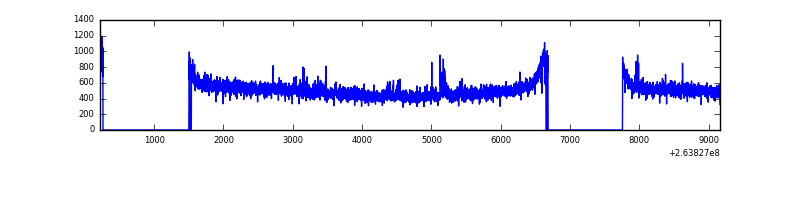 |
| B | 8945 | 6599 | 31 | 31 | 0.35% | 0.47% | 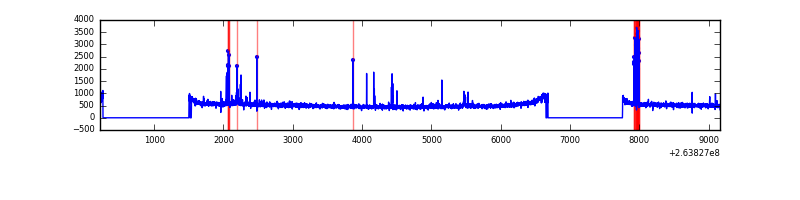 |
| C | 8945 | 6599 | 1 | 1 | 0.01% | 0.02% | 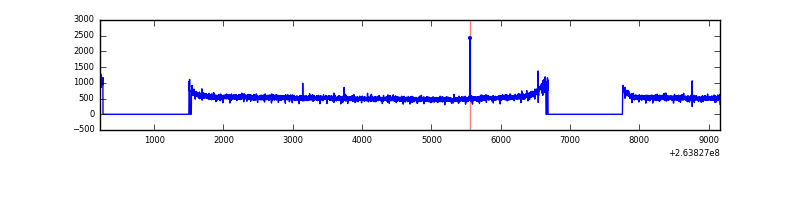 |
| D | 8945 | 6599 | 2 | 2 | 0.02% | 0.03% | 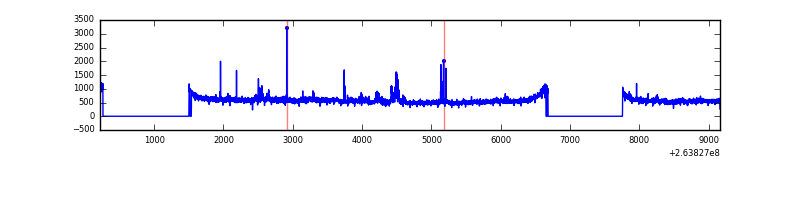 |
Top three noisy pixels from each quadrant. If the there are fewer than three noisy pixels in the level2.evt file, extra rows are filled as -1
| Pixel properties | Quadrant properties | ||||||
|---|---|---|---|---|---|---|---|
| Quadrant | DetID | PixID | Counts | Sigma | Mean | Median | Sigma |
| A | 8 | 15 | 42244 | 241.88 | 859 | 841 | 171.2 |
| A | 12 | 189 | 18409 | 102.63 | 859 | 841 | 171.2 |
| A | 0 | 226 | 7575 | 39.34 | 859 | 841 | 171.2 |
| B | 10 | 244 | 146726 | 896.51 | 854 | 834 | 162.7 |
| B | 0 | 219 | 27936 | 166.54 | 854 | 834 | 162.7 |
| B | 0 | 85 | 21033 | 124.12 | 854 | 834 | 162.7 |
| C | 3 | 233 | 184368 | 937.43 | 853 | 860 | 195.8 |
| C | 13 | 61 | 6213 | 27.34 | 853 | 860 | 195.8 |
| C | 14 | 234 | 4447 | 18.32 | 853 | 860 | 195.8 |
| D | 8 | 195 | 450434 | 2238.73 | 848 | 830 | 200.8 |
| D | 1 | 52 | 122398 | 605.33 | 848 | 830 | 200.8 |
| D | 7 | 254 | 39470 | 192.4 | 848 | 830 | 200.8 |
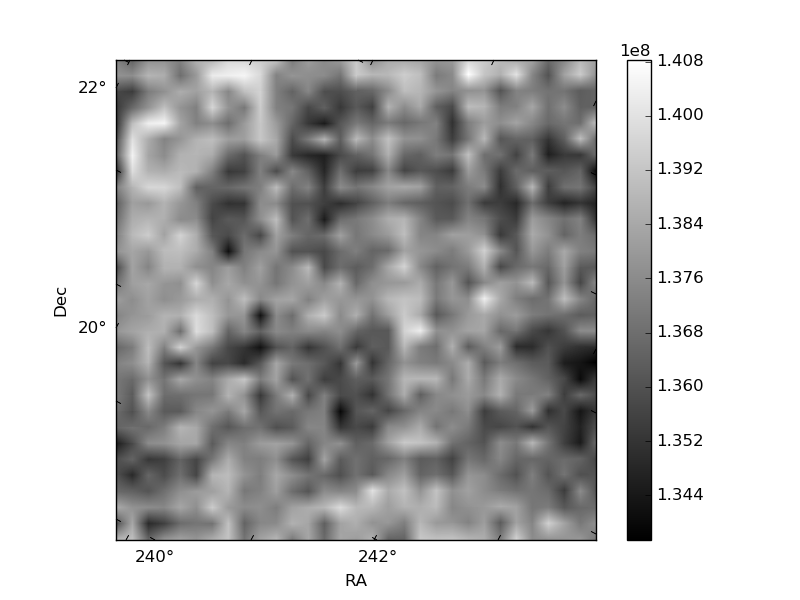
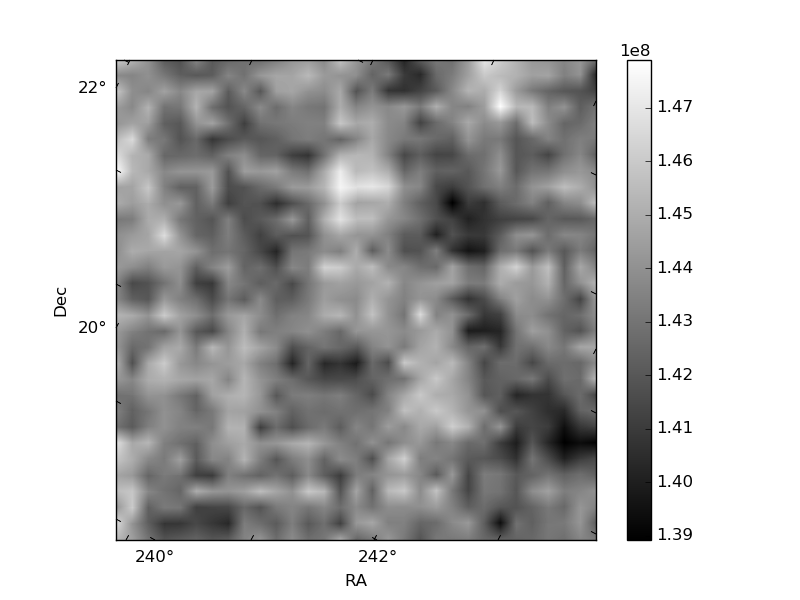
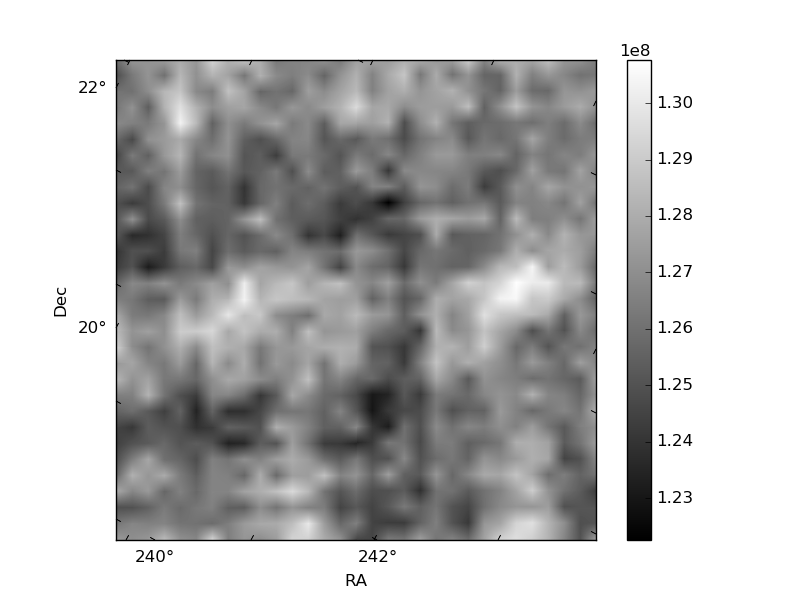
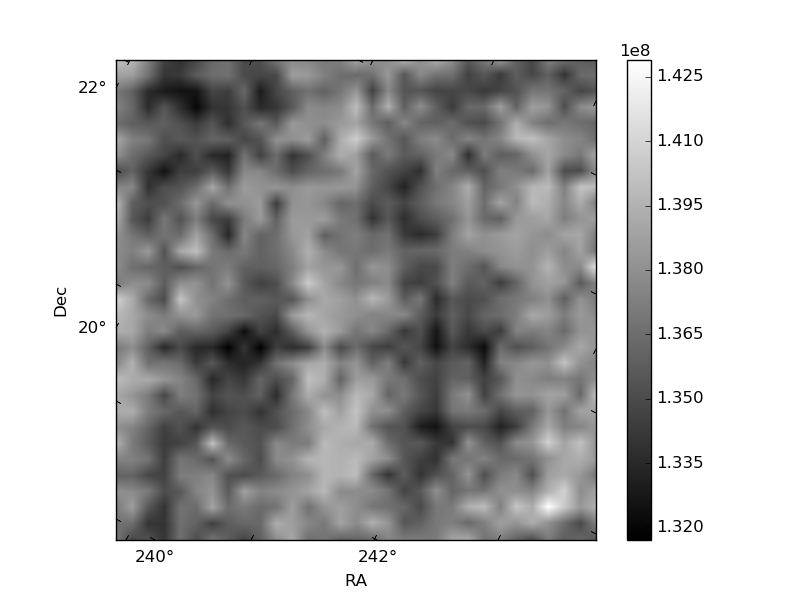
Histogram calculated using DETX and DETY for each event in the final _common_clean file
| Quadrant A |  |
 |
Quadrant B |
|---|---|---|---|
| Quadrant D |  |
 |
Quadrant C |
| Plot type | Count rate plots | Images |
|---|---|---|
| Comparison with Poisson distribution Blue bars denote a histogram of data divided into 1 sec bins. Red curve is a Poisson curve with rate = median count rate of data. |
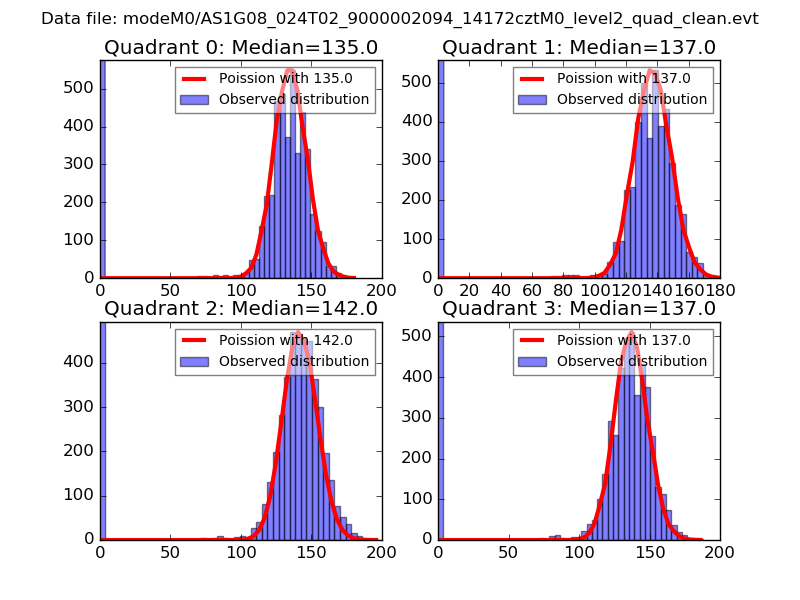 |
 |
| Quadrant-wise count rates Data is divided into 100 sec bins |
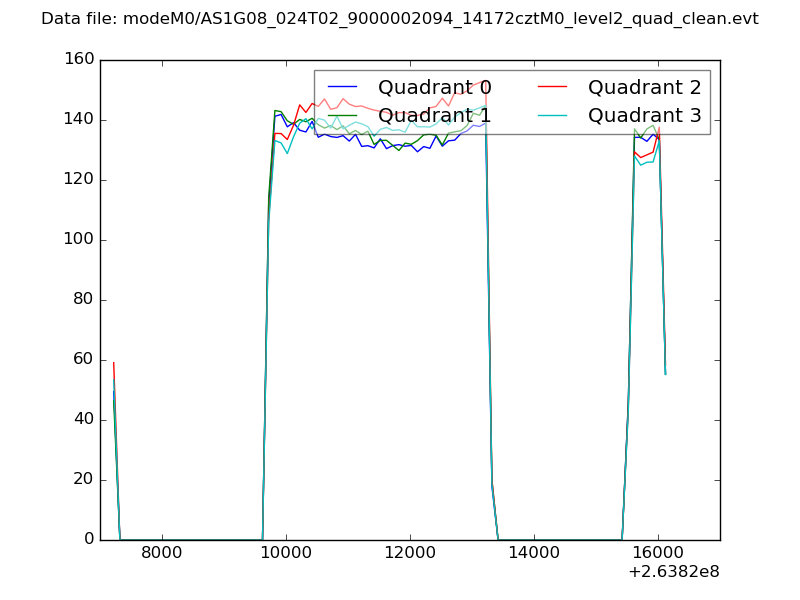 |
|
| Module-wise count rates for Quadrant A Data is divided into 100 sec bins |
 |
 |
| Module-wise count rates for Quadrant B Data is divided into 100 sec bins |
 |
 |
| Module-wise count rates for Quadrant C Data is divided into 100 sec bins |
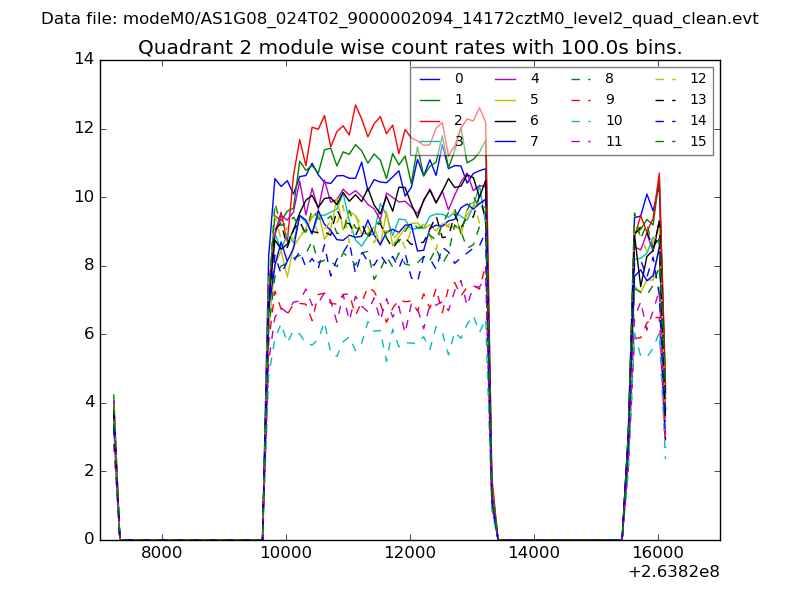 |
 |
| Module-wise count rates for Quadrant D Data is divided into 100 sec bins |
 |
 |
| Parameter | Plot |
|---|---|
| CZT HV Monitor |  |
| D_VDD |  |
| Temperature 1 |  |
| Veto HV Monitor |  |
| Veto LLD |  |
| Alpha Counter | 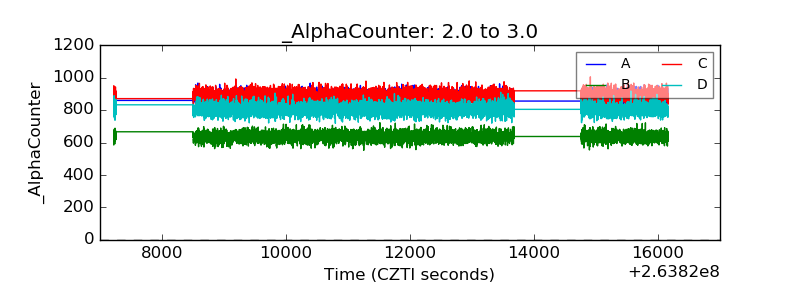 |
| _CPM_Rate | 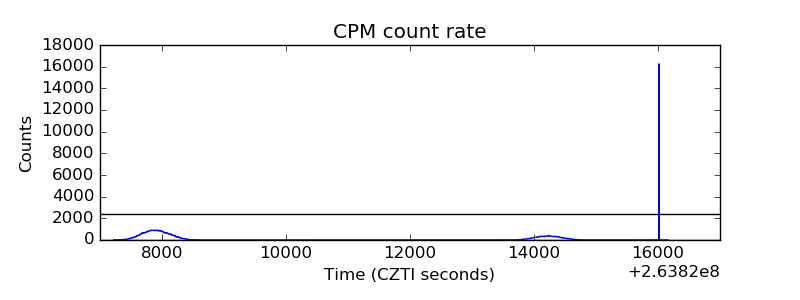 |
| CZT Counter |  |
| +2.5 Volts monitor |  |
| +5 Volts monitor |  |
| _ROLL_ROT |  |
| _Roll_DEC |  |
| _Roll_RA |  |
| Veto Counter |  |