| Param | Original file | Final file |
|---|---|---|
| Filename | modeM0/AS1C03_022T01_9000002098cztM0_level2.fits | modeM0/AS1C03_022T01_9000002098cztM0_level2_quad_clean.evt |
| Size (bytes) | 727,404,480 | 647,412,480 |
| Size | 693.7 MB | 617.4 MB |
| Events in quadrant A | 4,522,798 | 3,901,459 |
| Events in quadrant B | 4,234,770 | 3,805,918 |
| Events in quadrant C | 4,362,048 | 3,546,567 |
| Events in quadrant D | 3,678,410 | 3,124,882 |
| Mode M9 | |||
|---|---|---|---|
| Quadrant | BADHDUFLAG | Total packets | Discarded packets |
| A | 0 | 122 | 0 |
| B | 0 | 122 | 0 |
| C | 0 | 122 | 0 |
| D | 0 | 122 | 0 |
| Mode M0 | |||
|---|---|---|---|
| Quadrant | BADHDUFLAG | Total packets | Discarded packets |
| A | 0 | 163717 | 0 |
| B | 0 | 189145 | 0 |
| C | 0 | 161115 | 0 |
| D | 0 | 224810 | 0 |
| Mode SS | |||
|---|---|---|---|
| Quadrant | BADHDUFLAG | Total packets | Discarded packets |
| A | 0 | 1546 | 0 |
| B | 0 | 1546 | 0 |
| C | 0 | 1546 | 0 |
| D | 0 | 1546 | 0 |
| Quadrant | Total seconds | Saturated seconds | Saturation percentage |
|---|---|---|---|
| A | 76258 | 909 | 1.192006% |
| B | 76258 | 3973 | 5.209945% |
| C | 76258 | 645 | 0.845813% |
| D | 76258 | 6719 | 8.810879% |
Noise dominated data is calculated using 1-second bins in cleaned event files. If a bin has >2000 counts, and if more than 50% of those come from <1% of pixels, then it is considered to be noise-dominated and hence unusable.
| Quadrant | # 1 sec bins | Bins with >0 counts | Bins with >2000 counts | High rate bins dominated by noise | Noise dominated (total time) | Noise dominated (detector-on time) | Marked lightcurve |
|---|---|---|---|---|---|---|---|
| A | 88228 | 76255 | 0 | 0 | 0.00% | 0.00% |  |
| B | 88228 | 76230 | 0 | 0 | 0.00% | 0.00% |  |
| C | 88228 | 76259 | 0 | 0 | 0.00% | 0.00% |  |
| D | 88228 | 76185 | 0 | 0 | 0.00% | 0.00% |  |
Top three noisy pixels from each quadrant. If the there are fewer than three noisy pixels in the level2.evt file, extra rows are filled as -1
| Pixel properties | Quadrant properties | ||||||
|---|---|---|---|---|---|---|---|
| Quadrant | DetID | PixID | Counts | Sigma | Mean | Median | Sigma |
| A | 0 | 29 | 4374 | 11.16 | 1179 | 1100 | 293.3 |
| A | 7 | 110 | 3643 | 8.67 | 1179 | 1100 | 293.3 |
| A | 9 | 19 | 3439 | 7.97 | 1179 | 1100 | 293.3 |
| B | 2 | 9 | 3654 | 11.62 | 1117 | 1061 | 223.1 |
| B | 3 | 17 | 2857 | 8.05 | 1117 | 1061 | 223.1 |
| B | 3 | 80 | 2800 | 7.79 | 1117 | 1061 | 223.1 |
| C | 1 | 80 | 3232 | 7.28 | 1151 | 1068 | 297.1 |
| C | 1 | 81 | 3163 | 7.05 | 1151 | 1068 | 297.1 |
| C | 12 | 241 | 3043 | 6.65 | 1151 | 1068 | 297.1 |
| D | 6 | 231 | 2681 | 6.05 | 1051 | 953 | 285.7 |
| D | 3 | 14 | 2660 | 5.97 | 1051 | 953 | 285.7 |
| D | 3 | 31 | 2578 | 5.69 | 1051 | 953 | 285.7 |
Histogram calculated using DETX and DETY for each event in the final _common_clean file
| Quadrant A | 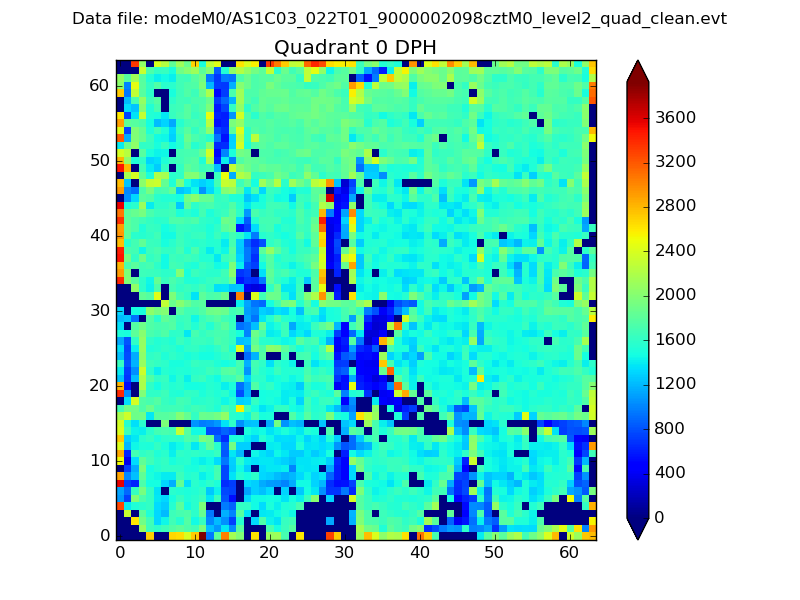 |
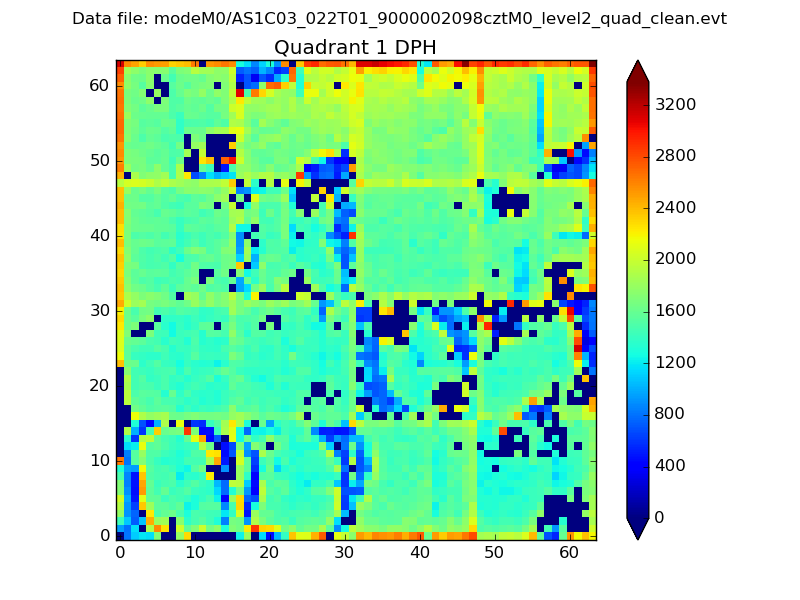 |
Quadrant B |
|---|---|---|---|
| Quadrant D |  |
 |
Quadrant C |
| Plot type | Count rate plots | Images |
|---|---|---|
| Comparison with Poisson distribution Blue bars denote a histogram of data divided into 1 sec bins. Red curve is a Poisson curve with rate = median count rate of data. |
 |
 |
| Quadrant-wise count rates Data is divided into 100 sec bins |
 |
|
| Module-wise count rates for Quadrant A Data is divided into 100 sec bins |
 |
 |
| Module-wise count rates for Quadrant B Data is divided into 100 sec bins |
 |
 |
| Module-wise count rates for Quadrant C Data is divided into 100 sec bins |
 |
 |
| Module-wise count rates for Quadrant D Data is divided into 100 sec bins |
 |
 |
| Parameter | Plot |
|---|---|
| CZT HV Monitor |  |
| D_VDD |  |
| Temperature 1 |  |
| Veto HV Monitor |  |
| Veto LLD | 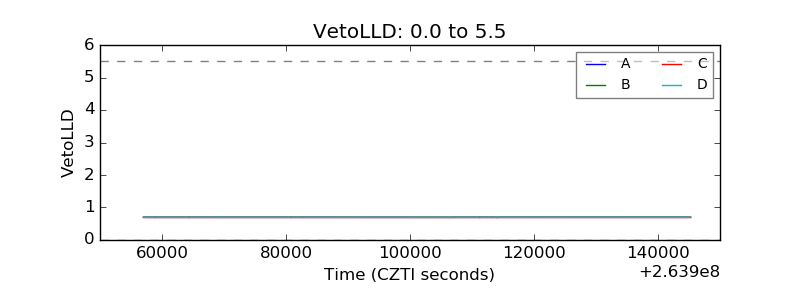 |
| Alpha Counter |  |
| _CPM_Rate |  |
| CZT Counter |  |
| +2.5 Volts monitor |  |
| +5 Volts monitor |  |
| _ROLL_ROT |  |
| _Roll_DEC |  |
| _Roll_RA |  |
| Veto Counter |  |