| Param | Original file | Final file |
|---|---|---|
| Filename | modeM0/AS1C03_022T01_9000002098_14194cztM0_level2.evt | modeM0/AS1C03_022T01_9000002098_14194cztM0_level2_quad_clean.evt |
| Size (bytes) | 495,751,680 | 92,977,920 |
| Size | 472.8 MB | 88.7 MB |
| Events in quadrant A | 3,268,691 | 603,425 |
| Events in quadrant B | 4,002,330 | 592,971 |
| Events in quadrant C | 3,644,969 | 580,261 |
| Events in quadrant D | 3,640,035 | 568,860 |
| Mode M9 | |||
|---|---|---|---|
| Quadrant | BADHDUFLAG | Total packets | Discarded packets |
| A | 0 | 16 | 0 |
| B | 0 | 16 | 0 |
| C | 0 | 16 | 0 |
| D | 0 | 17 | 0 |
| Mode M0 | |||
|---|---|---|---|
| Quadrant | BADHDUFLAG | Total packets | Discarded packets |
| A | 0 | 14281 | 3 |
| B | 0 | 16371 | 2 |
| C | 0 | 15127 | 2 |
| D | 0 | 15460 | 2 |
| Mode SS | |||
|---|---|---|---|
| Quadrant | BADHDUFLAG | Total packets | Discarded packets |
| A | 0 | 136 | 0 |
| B | 0 | 136 | 0 |
| C | 0 | 136 | 0 |
| D | 0 | 136 | 0 |
| Quadrant | Total seconds | Saturated seconds | Saturation percentage |
|---|---|---|---|
| A | 6749 | 22 | 0.325974% |
| B | 6749 | 149 | 2.207734% |
| C | 6749 | 19 | 0.281523% |
| D | 6749 | 55 | 0.814936% |
Noise dominated data is calculated using 1-second bins in cleaned event files. If a bin has >2000 counts, and if more than 50% of those come from <1% of pixels, then it is considered to be noise-dominated and hence unusable.
| Quadrant | # 1 sec bins | Bins with >0 counts | Bins with >2000 counts | High rate bins dominated by noise | Noise dominated (total time) | Noise dominated (detector-on time) | Marked lightcurve |
|---|---|---|---|---|---|---|---|
| A | 7720 | 6751 | 1 | 1 | 0.01% | 0.01% |  |
| B | 7720 | 6751 | 70 | 70 | 0.91% | 1.04% |  |
| C | 7720 | 6751 | 5 | 5 | 0.06% | 0.07% |  |
| D | 7720 | 6751 | 27 | 27 | 0.35% | 0.40% |  |
Top three noisy pixels from each quadrant. If the there are fewer than three noisy pixels in the level2.evt file, extra rows are filled as -1
| Pixel properties | Quadrant properties | ||||||
|---|---|---|---|---|---|---|---|
| Quadrant | DetID | PixID | Counts | Sigma | Mean | Median | Sigma |
| A | 9 | 143 | 61442 | 363.66 | 815 | 798 | 166.8 |
| A | 12 | 189 | 36243 | 212.55 | 815 | 798 | 166.8 |
| A | 8 | 15 | 18706 | 107.39 | 815 | 798 | 166.8 |
| B | 10 | 245 | 578615 | 3708.86 | 807 | 786 | 155.8 |
| B | 0 | 219 | 69206 | 439.16 | 807 | 786 | 155.8 |
| B | 0 | 189 | 53318 | 337.18 | 807 | 786 | 155.8 |
| C | 3 | 233 | 593099 | 3255.24 | 781 | 788 | 182.0 |
| C | 13 | 61 | 5800 | 27.55 | 781 | 788 | 182.0 |
| C | 14 | 234 | 5108 | 23.74 | 781 | 788 | 182.0 |
| D | 1 | 52 | 184309 | 915.25 | 777 | 760 | 200.5 |
| D | 10 | 199 | 110885 | 549.13 | 777 | 760 | 200.5 |
| D | 10 | 172 | 74859 | 369.49 | 777 | 760 | 200.5 |
Histogram calculated using DETX and DETY for each event in the final _common_clean file
| Quadrant A |  |
 |
Quadrant B |
|---|---|---|---|
| Quadrant D |  |
 |
Quadrant C |
| Plot type | Count rate plots | Images |
|---|---|---|
| Comparison with Poisson distribution Blue bars denote a histogram of data divided into 1 sec bins. Red curve is a Poisson curve with rate = median count rate of data. |
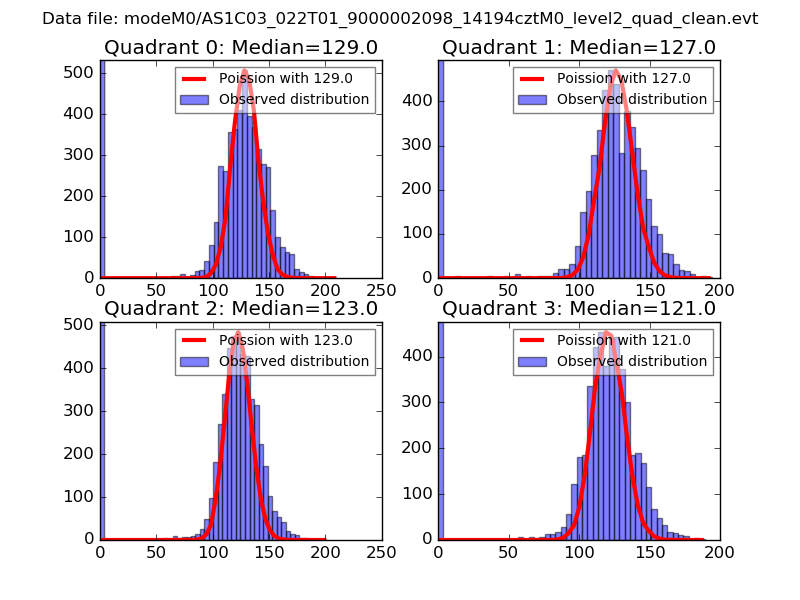 |
 |
| Quadrant-wise count rates Data is divided into 100 sec bins |
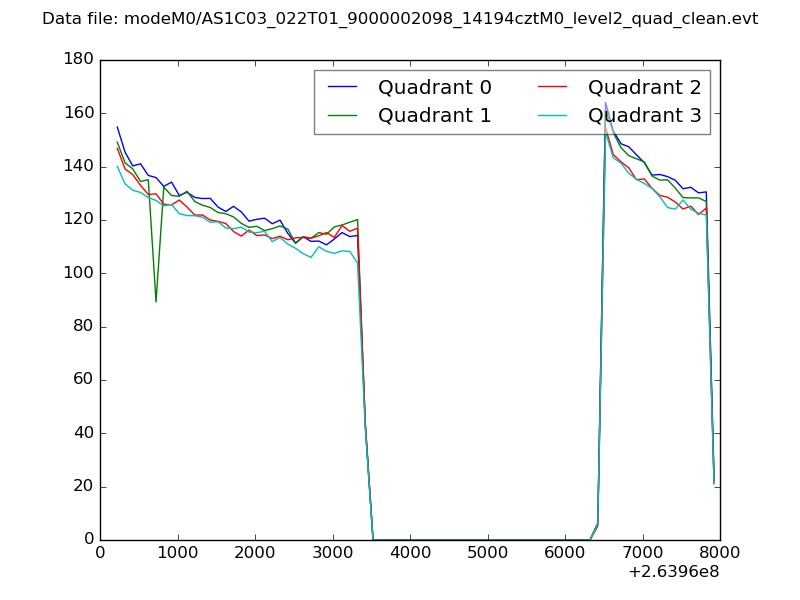 |
|
| Module-wise count rates for Quadrant A Data is divided into 100 sec bins |
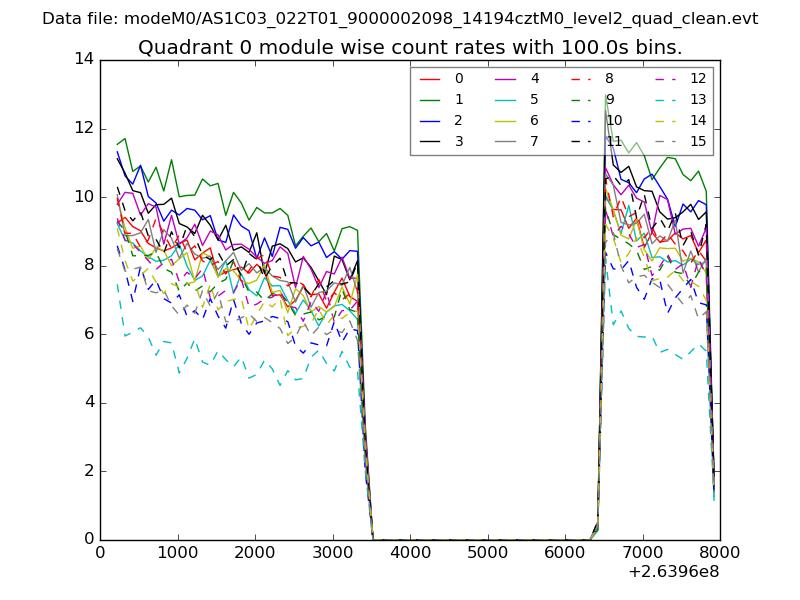 |
 |
| Module-wise count rates for Quadrant B Data is divided into 100 sec bins |
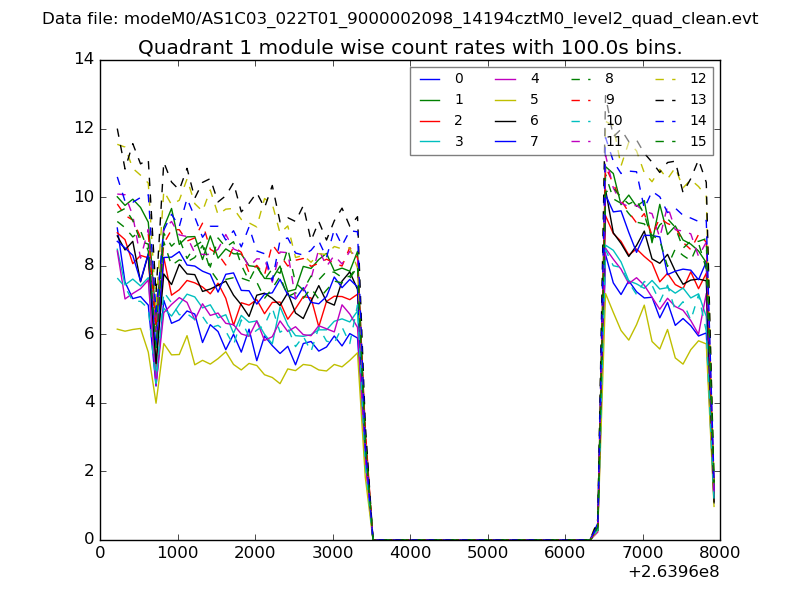 |
 |
| Module-wise count rates for Quadrant C Data is divided into 100 sec bins |
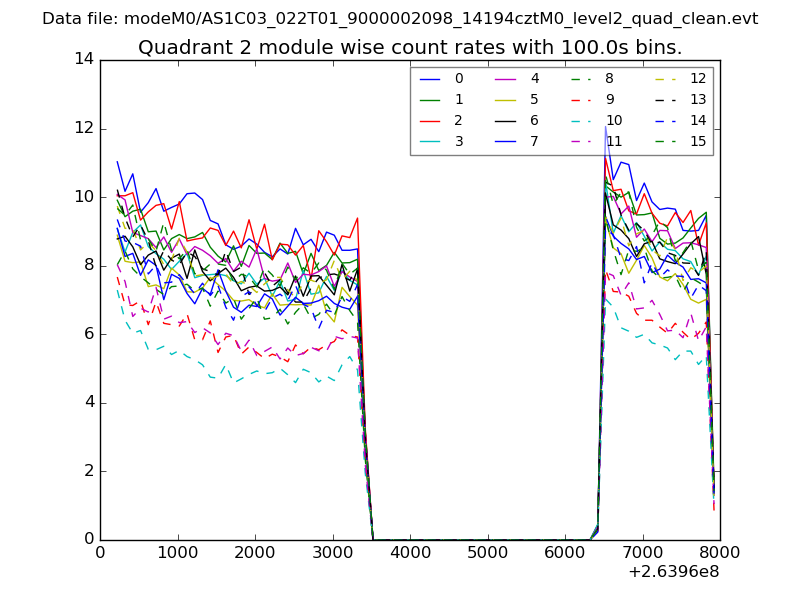 |
 |
| Module-wise count rates for Quadrant D Data is divided into 100 sec bins |
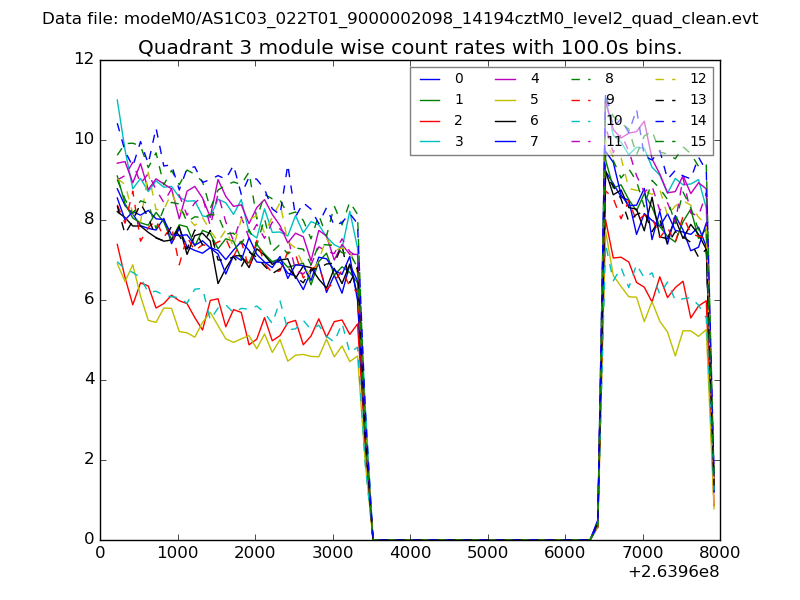 |
 |
| Parameter | Plot |
|---|---|
| CZT HV Monitor | 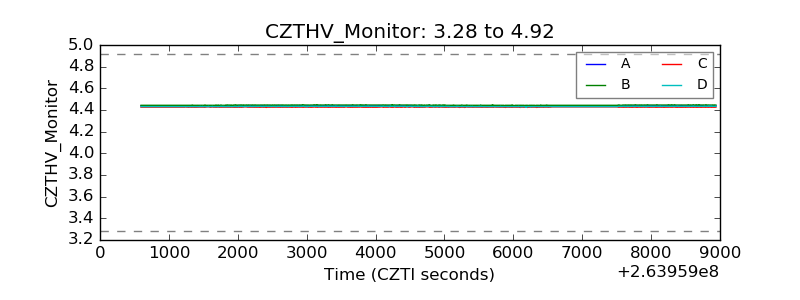 |
| D_VDD |  |
| Temperature 1 |  |
| Veto HV Monitor |  |
| Veto LLD |  |
| Alpha Counter | 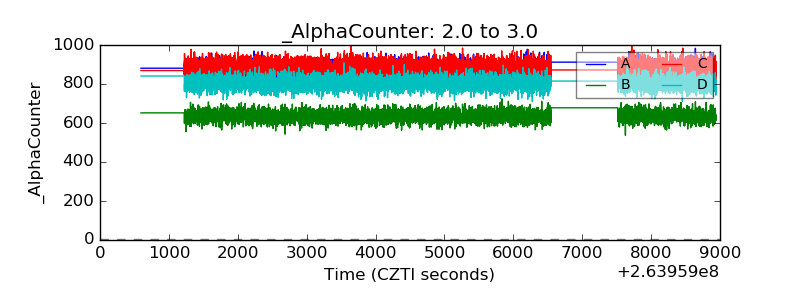 |
| _CPM_Rate | 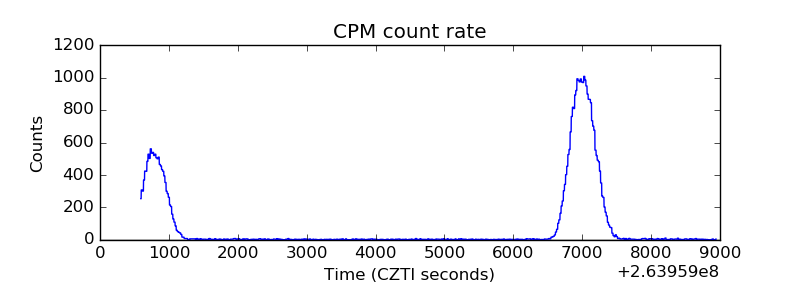 |
| CZT Counter |  |
| +2.5 Volts monitor |  |
| +5 Volts monitor |  |
| _ROLL_ROT | 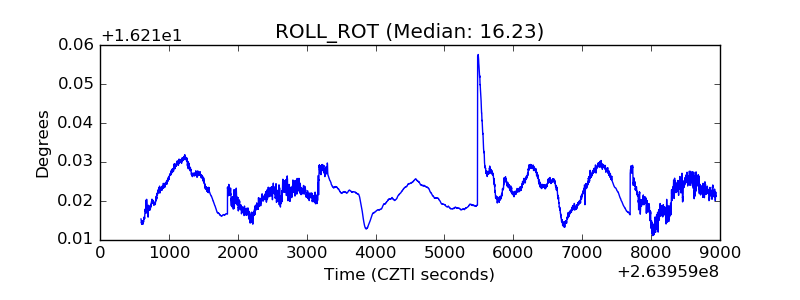 |
| _Roll_DEC | 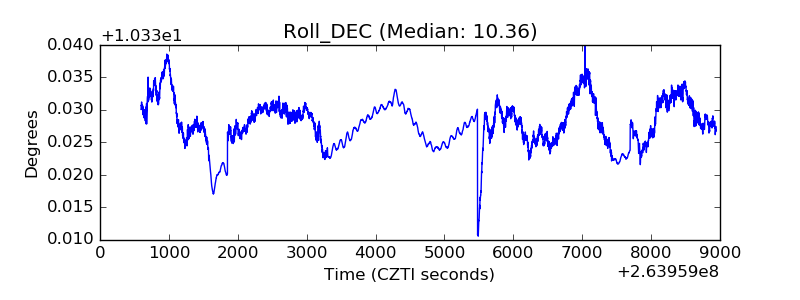 |
| _Roll_RA |  |
| Veto Counter | 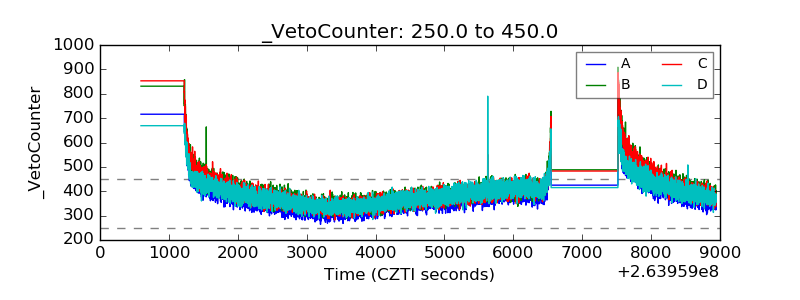 |