| Param | Original file | Final file |
|---|---|---|
| Filename | modeM0/AS1C03_022T01_9000002098_14195cztM0_level2.evt | modeM0/AS1C03_022T01_9000002098_14195cztM0_level2_quad_clean.evt |
| Size (bytes) | 412,508,160 | 76,245,120 |
| Size | 393.4 MB | 72.7 MB |
| Events in quadrant A | 2,820,407 | 488,122 |
| Events in quadrant B | 3,074,210 | 484,996 |
| Events in quadrant C | 2,917,158 | 465,677 |
| Events in quadrant D | 3,281,779 | 459,650 |
| Mode M9 | |||
|---|---|---|---|
| Quadrant | BADHDUFLAG | Total packets | Discarded packets |
| A | 0 | 11 | 0 |
| B | 0 | 11 | 0 |
| C | 0 | 11 | 0 |
| D | 0 | 11 | 0 |
| Mode M0 | |||
|---|---|---|---|
| Quadrant | BADHDUFLAG | Total packets | Discarded packets |
| A | 0 | 12220 | 2 |
| B | 0 | 13097 | 1 |
| C | 0 | 12222 | 1 |
| D | 0 | 13739 | 1 |
| Mode SS | |||
|---|---|---|---|
| Quadrant | BADHDUFLAG | Total packets | Discarded packets |
| A | 0 | 120 | 0 |
| B | 0 | 120 | 0 |
| C | 0 | 120 | 0 |
| D | 0 | 120 | 0 |
| Quadrant | Total seconds | Saturated seconds | Saturation percentage |
|---|---|---|---|
| A | 5869 | 46 | 0.783779% |
| B | 5869 | 50 | 0.851934% |
| C | 5869 | 21 | 0.357812% |
| D | 5869 | 98 | 1.669790% |
Noise dominated data is calculated using 1-second bins in cleaned event files. If a bin has >2000 counts, and if more than 50% of those come from <1% of pixels, then it is considered to be noise-dominated and hence unusable.
| Quadrant | # 1 sec bins | Bins with >0 counts | Bins with >2000 counts | High rate bins dominated by noise | Noise dominated (total time) | Noise dominated (detector-on time) | Marked lightcurve |
|---|---|---|---|---|---|---|---|
| A | 6945 | 5871 | 9 | 9 | 0.13% | 0.15% |  |
| B | 6945 | 5871 | 4 | 4 | 0.06% | 0.07% |  |
| C | 6945 | 5871 | 0 | 0 | 0.00% | 0.00% |  |
| D | 6945 | 5871 | 57 | 57 | 0.82% | 0.97% |  |
Top three noisy pixels from each quadrant. If the there are fewer than three noisy pixels in the level2.evt file, extra rows are filled as -1
| Pixel properties | Quadrant properties | ||||||
|---|---|---|---|---|---|---|---|
| Quadrant | DetID | PixID | Counts | Sigma | Mean | Median | Sigma |
| A | 9 | 143 | 47909 | 323.19 | 713 | 696 | 146.1 |
| A | 12 | 96 | 13628 | 88.52 | 713 | 696 | 146.1 |
| A | 0 | 226 | 6315 | 38.46 | 713 | 696 | 146.1 |
| B | 0 | 219 | 77900 | 565.87 | 710 | 693 | 136.4 |
| B | 0 | 197 | 63192 | 458.07 | 710 | 693 | 136.4 |
| B | 4 | 142 | 36838 | 264.92 | 710 | 693 | 136.4 |
| C | 3 | 233 | 245292 | 1548.12 | 680 | 684 | 158.0 |
| C | 0 | 207 | 15133 | 91.45 | 680 | 684 | 158.0 |
| C | 14 | 234 | 5490 | 30.42 | 680 | 684 | 158.0 |
| D | 10 | 199 | 165140 | 910.99 | 677 | 665 | 180.5 |
| D | 10 | 157 | 138193 | 761.73 | 677 | 665 | 180.5 |
| D | 1 | 52 | 107899 | 593.94 | 677 | 665 | 180.5 |
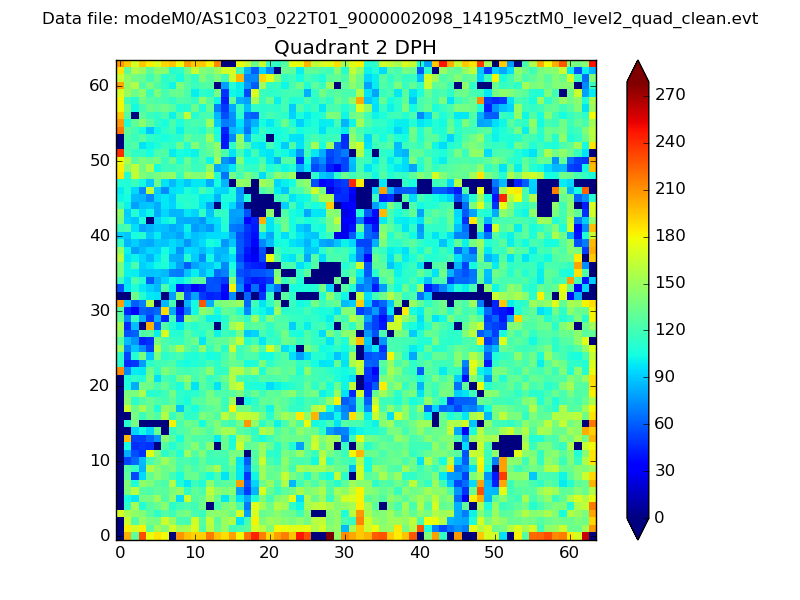
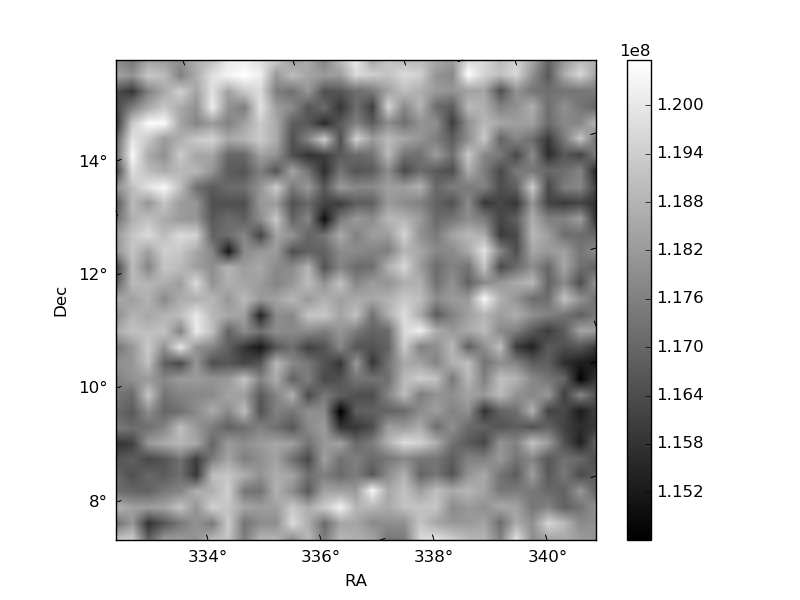
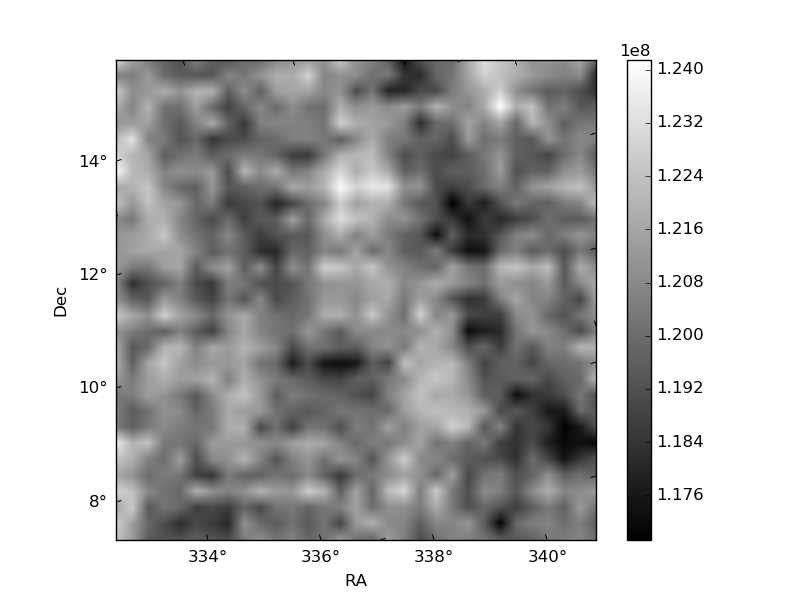
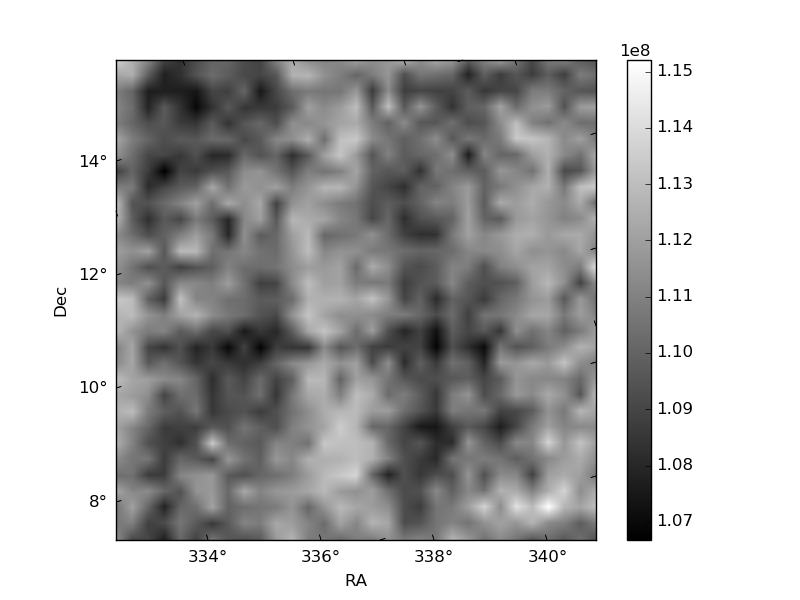
Histogram calculated using DETX and DETY for each event in the final _common_clean file
| Quadrant A | 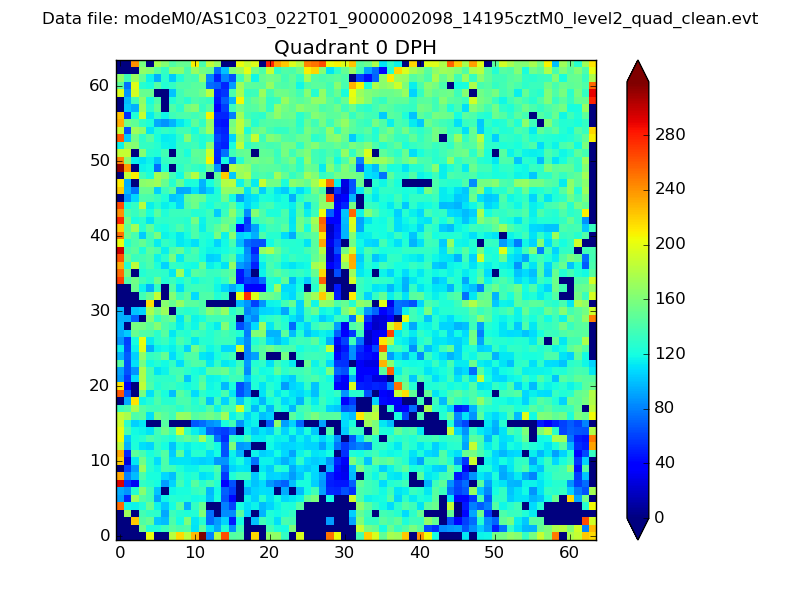 |
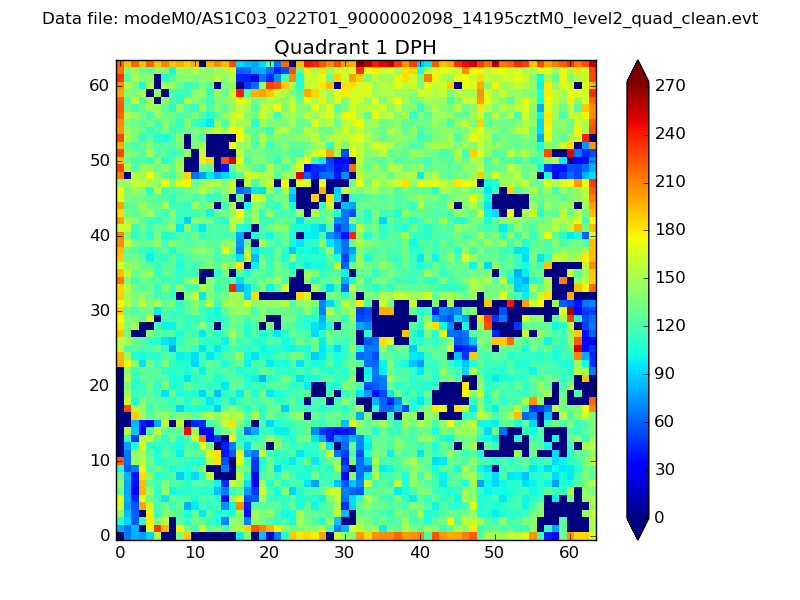 |
Quadrant B |
|---|---|---|---|
| Quadrant D | 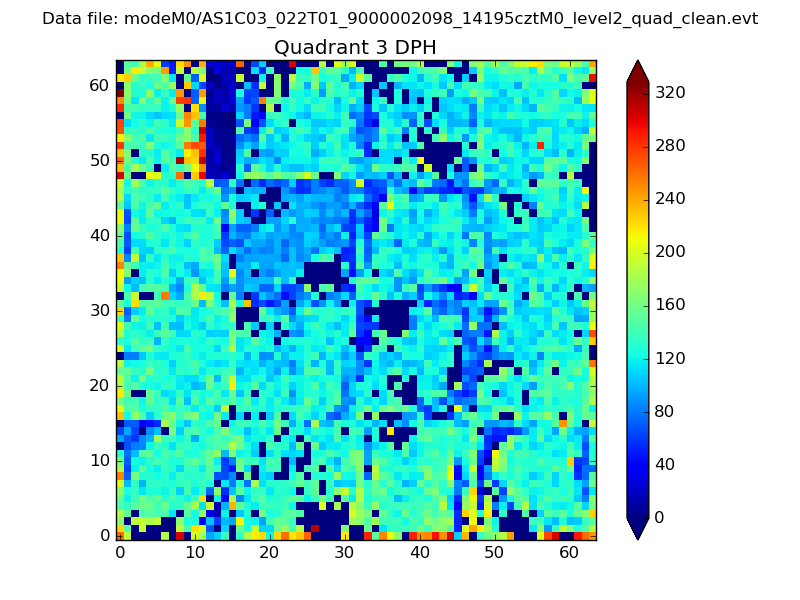 |
 |
Quadrant C |
| Plot type | Count rate plots | Images |
|---|---|---|
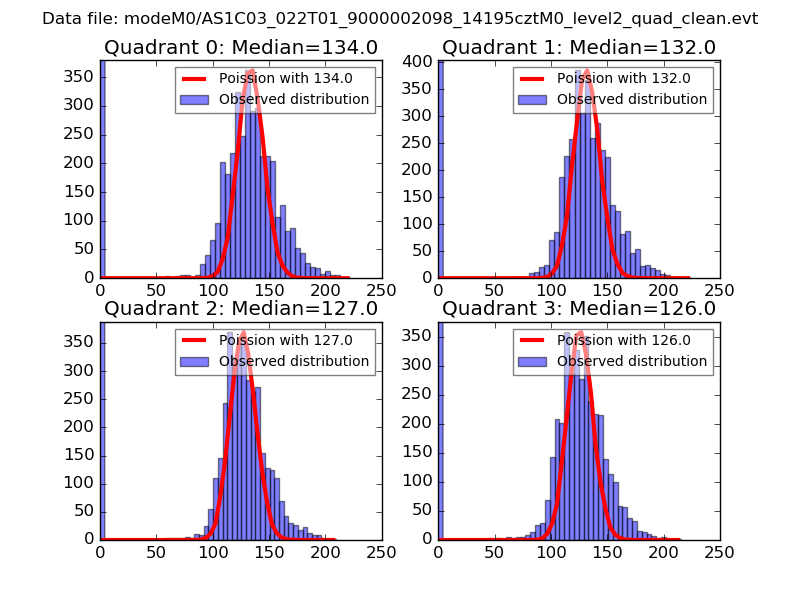
| Comparison with Poisson distribution Blue bars denote a histogram of data divided into 1 sec bins. Red curve is a Poisson curve with rate = median count rate of data. |
 |
 |
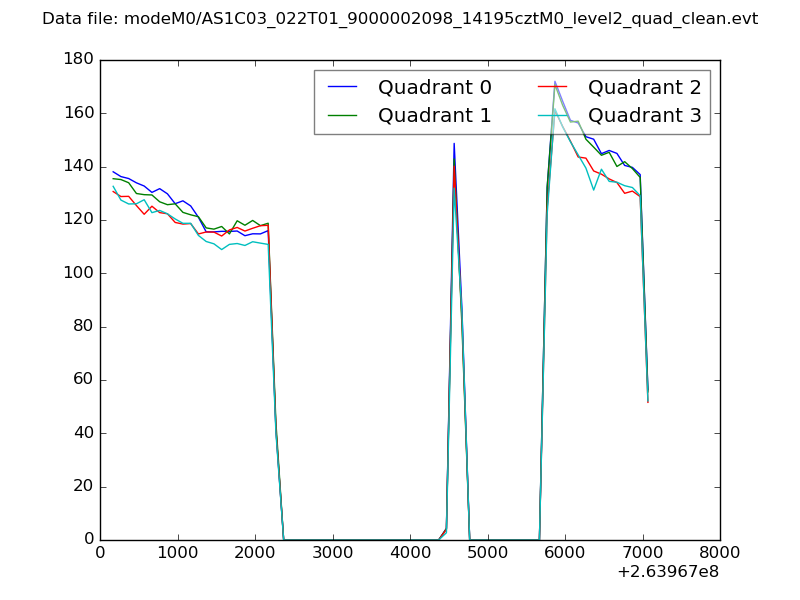
| Quadrant-wise count rates Data is divided into 100 sec bins |
 |
|
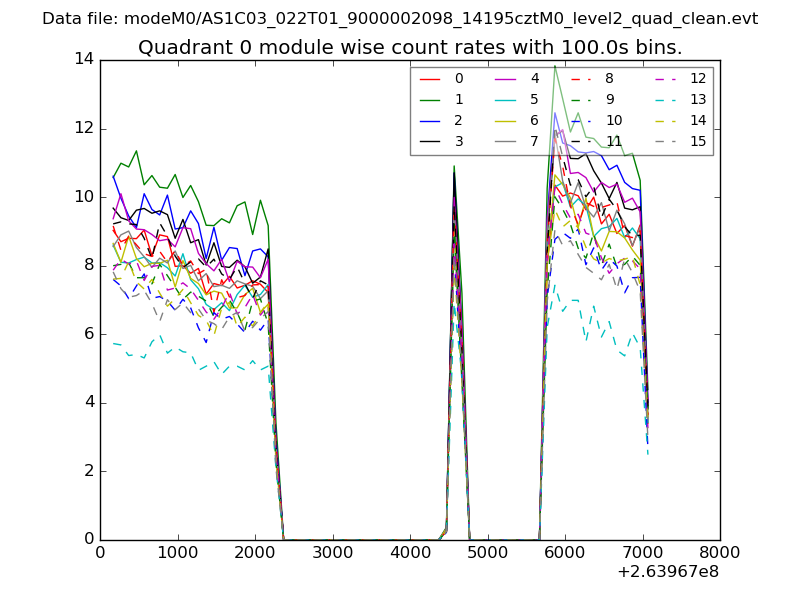
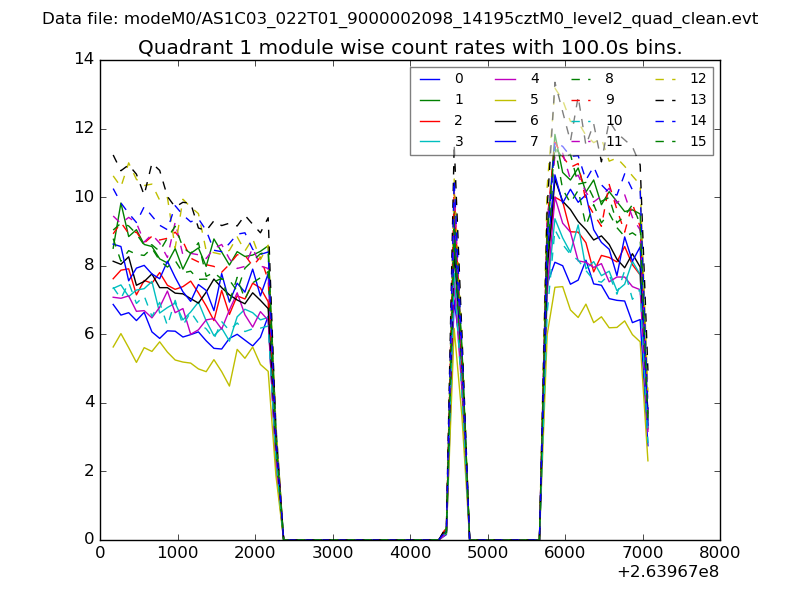
| Module-wise count rates for Quadrant A Data is divided into 100 sec bins |
 |
 |
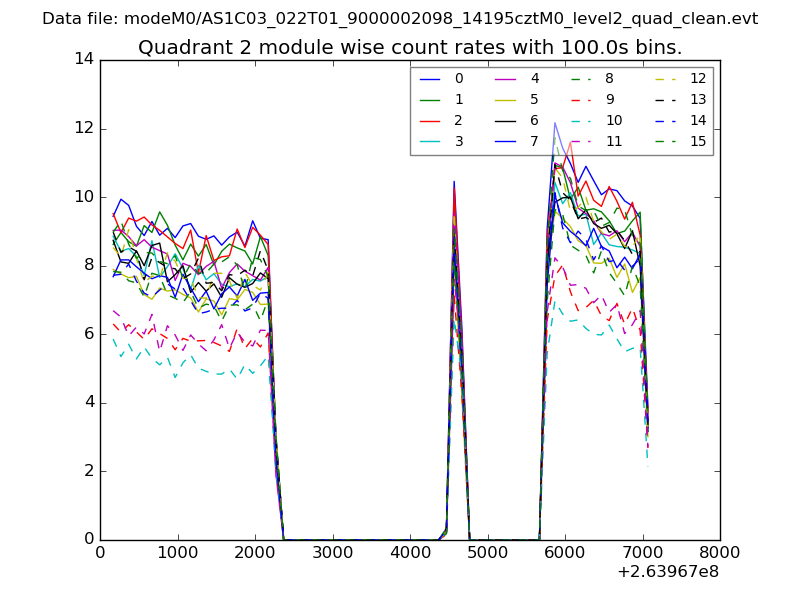
| Module-wise count rates for Quadrant B Data is divided into 100 sec bins |
 |
 |
| Module-wise count rates for Quadrant C Data is divided into 100 sec bins |
 |
 |
| Module-wise count rates for Quadrant D Data is divided into 100 sec bins |
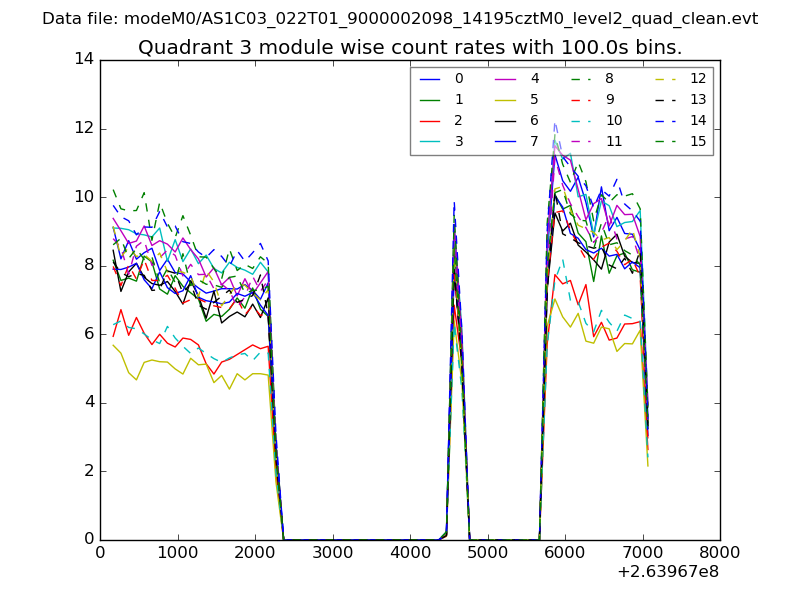 |
 |
| Parameter | Plot |
|---|---|
| CZT HV Monitor | 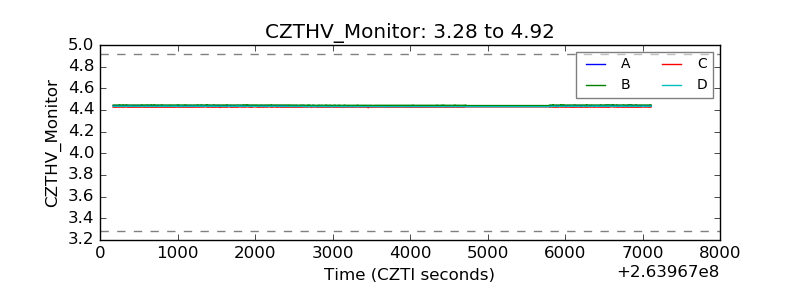 |
| D_VDD | 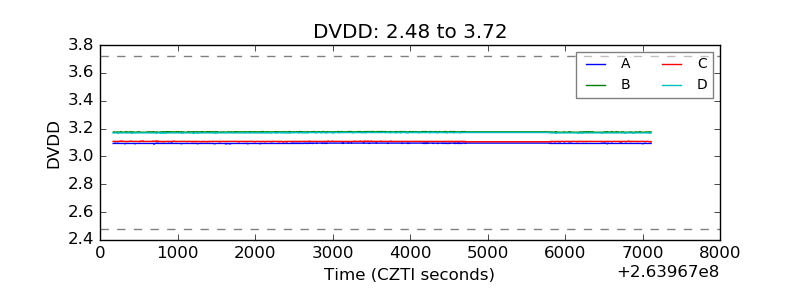 |
| Temperature 1 | 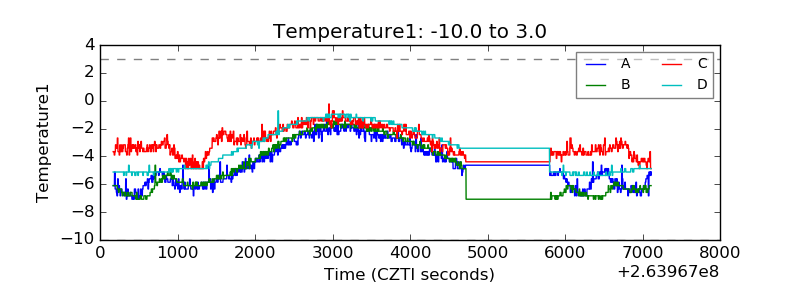 |
| Veto HV Monitor | 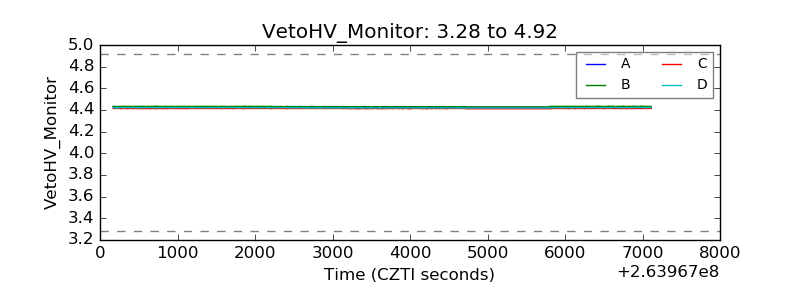 |
| Veto LLD | 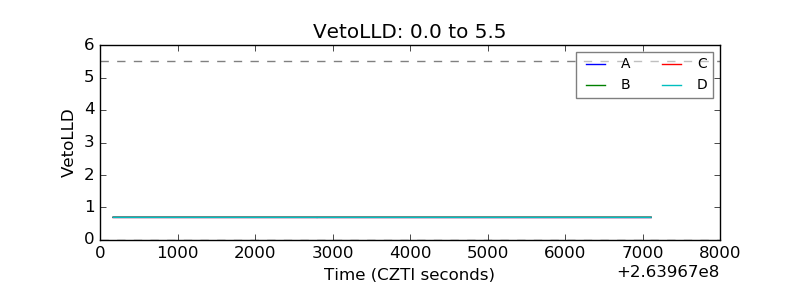 |
| Alpha Counter | 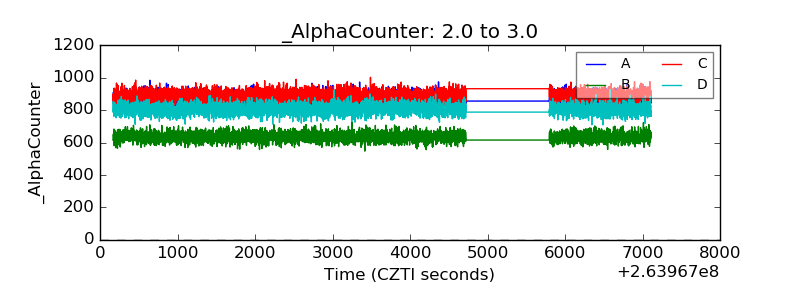 |
| _CPM_Rate | 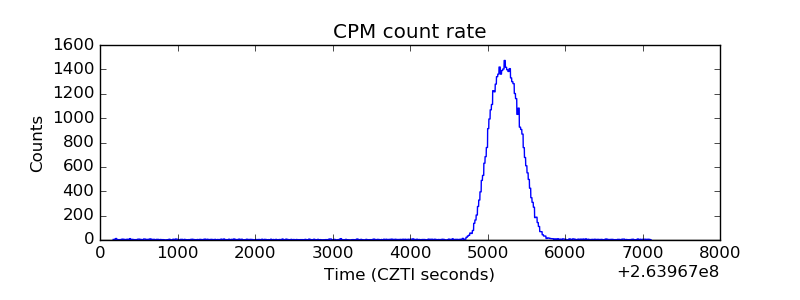 |
| CZT Counter | 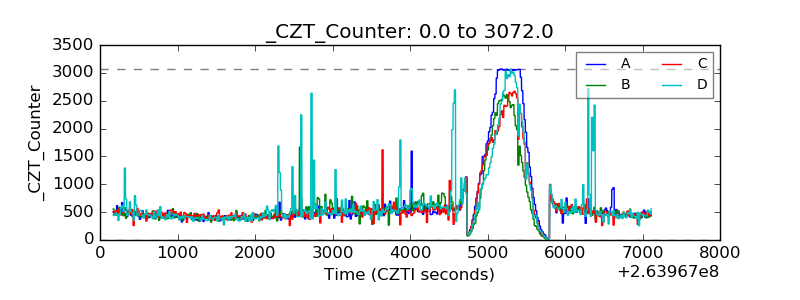 |
| +2.5 Volts monitor | 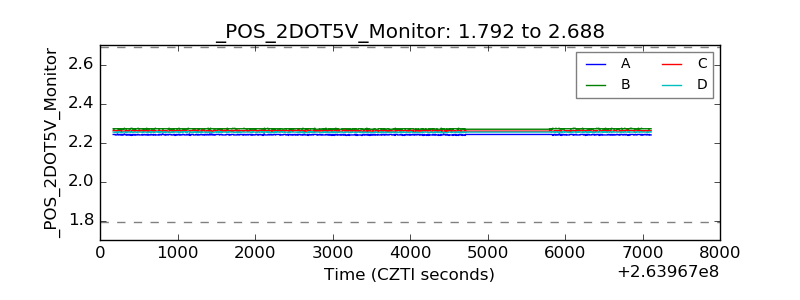 |
| +5 Volts monitor |  |
| _ROLL_ROT | 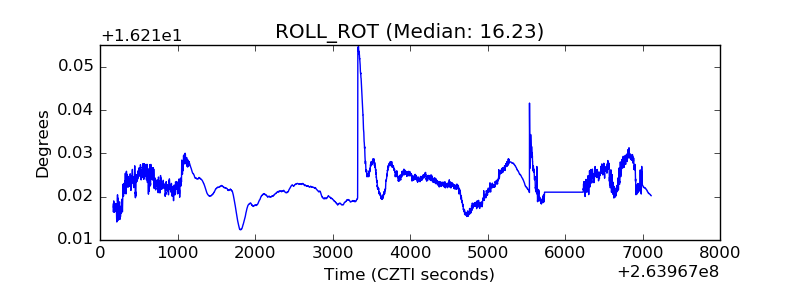 |
| _Roll_DEC | 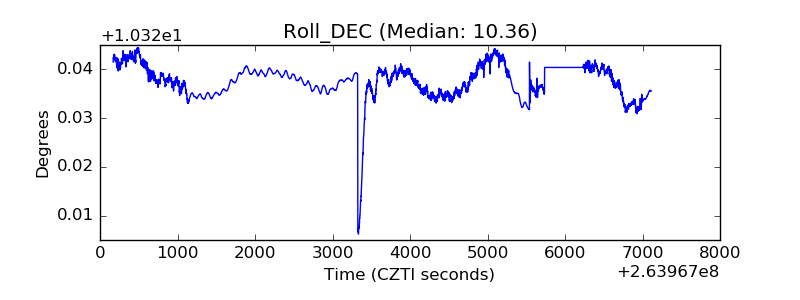 |
| _Roll_RA | 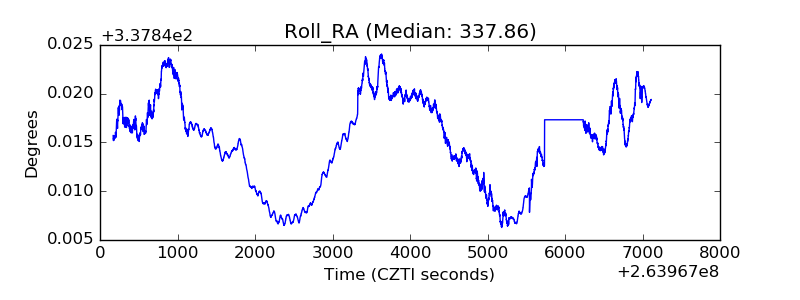 |
| Veto Counter | 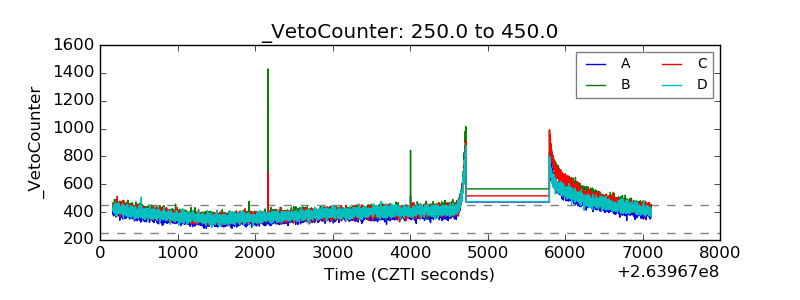 |