| Param | Original file | Final file |
|---|---|---|
| Filename | modeM0/AS1C03_022T01_9000002098_14197cztM0_level2.evt | modeM0/AS1C03_022T01_9000002098_14197cztM0_level2_quad_clean.evt |
| Size (bytes) | 467,619,840 | 88,139,520 |
| Size | 446.0 MB | 84.1 MB |
| Events in quadrant A | 3,163,391 | 571,717 |
| Events in quadrant B | 3,287,979 | 575,835 |
| Events in quadrant C | 3,125,801 | 547,070 |
| Events in quadrant D | 4,159,199 | 537,031 |
| Mode M9 | |||
|---|---|---|---|
| Quadrant | BADHDUFLAG | Total packets | Discarded packets |
| A | 0 | 12 | 0 |
| B | 0 | 12 | 0 |
| C | 0 | 12 | 0 |
| D | 0 | 12 | 0 |
| Mode M0 | |||
|---|---|---|---|
| Quadrant | BADHDUFLAG | Total packets | Discarded packets |
| A | 0 | 13212 | 2 |
| B | 0 | 13648 | 1 |
| C | 0 | 13041 | 1 |
| D | 0 | 16631 | 1 |
| Mode SS | |||
|---|---|---|---|
| Quadrant | BADHDUFLAG | Total packets | Discarded packets |
| A | 0 | 126 | 0 |
| B | 0 | 126 | 0 |
| C | 0 | 126 | 0 |
| D | 0 | 126 | 0 |
| Quadrant | Total seconds | Saturated seconds | Saturation percentage |
|---|---|---|---|
| A | 6274 | 68 | 1.083838% |
| B | 6274 | 58 | 0.924450% |
| C | 6274 | 22 | 0.350653% |
| D | 6274 | 106 | 1.689512% |
Noise dominated data is calculated using 1-second bins in cleaned event files. If a bin has >2000 counts, and if more than 50% of those come from <1% of pixels, then it is considered to be noise-dominated and hence unusable.
| Quadrant | # 1 sec bins | Bins with >0 counts | Bins with >2000 counts | High rate bins dominated by noise | Noise dominated (total time) | Noise dominated (detector-on time) | Marked lightcurve |
|---|---|---|---|---|---|---|---|
| A | 7450 | 6276 | 20 | 20 | 0.27% | 0.32% | 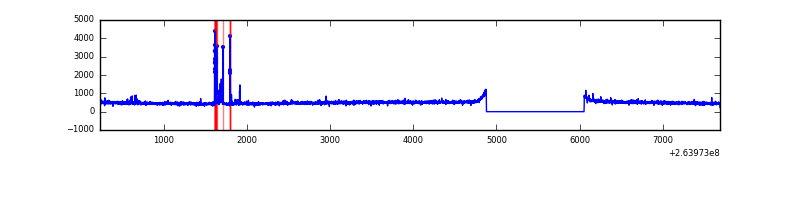 |
| B | 7450 | 6276 | 8 | 8 | 0.11% | 0.13% | 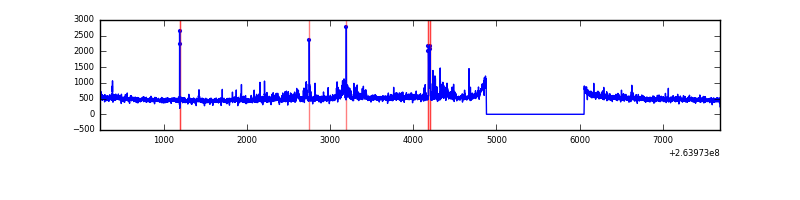 |
| C | 7450 | 6276 | 0 | 0 | 0.00% | 0.00% | 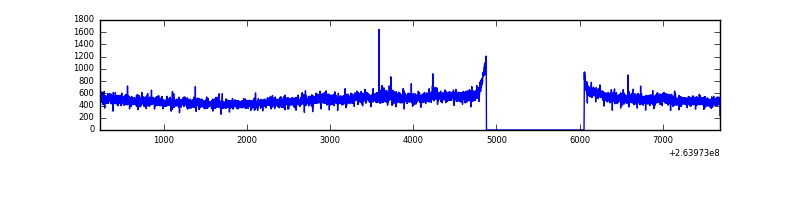 |
| D | 7450 | 6276 | 83 | 83 | 1.11% | 1.32% | 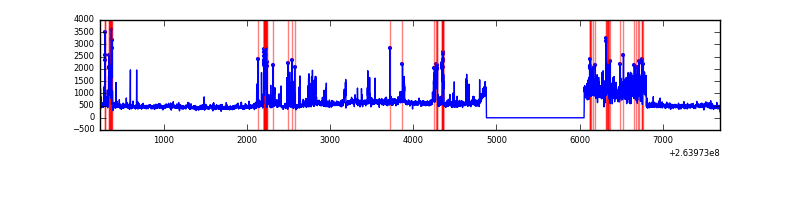 |
Top three noisy pixels from each quadrant. If the there are fewer than three noisy pixels in the level2.evt file, extra rows are filled as -1
| Pixel properties | Quadrant properties | ||||||
|---|---|---|---|---|---|---|---|
| Quadrant | DetID | PixID | Counts | Sigma | Mean | Median | Sigma |
| A | 12 | 96 | 112116 | 703.68 | 784 | 769 | 158.2 |
| A | 9 | 143 | 13913 | 83.07 | 784 | 769 | 158.2 |
| A | 14 | 111 | 11269 | 66.36 | 784 | 769 | 158.2 |
| B | 4 | 142 | 60204 | 402.06 | 778 | 761 | 147.8 |
| B | 0 | 219 | 49684 | 330.91 | 778 | 761 | 147.8 |
| B | 0 | 189 | 47783 | 318.05 | 778 | 761 | 147.8 |
| C | 3 | 233 | 222627 | 1296.95 | 743 | 749 | 171.1 |
| C | 13 | 61 | 5416 | 27.28 | 743 | 749 | 171.1 |
| C | 0 | 207 | 4519 | 22.04 | 743 | 749 | 171.1 |
| D | 5 | 222 | 637828 | 3503.15 | 747 | 729 | 181.9 |
| D | 8 | 195 | 238202 | 1305.77 | 747 | 729 | 181.9 |
| D | 10 | 199 | 124417 | 680.11 | 747 | 729 | 181.9 |
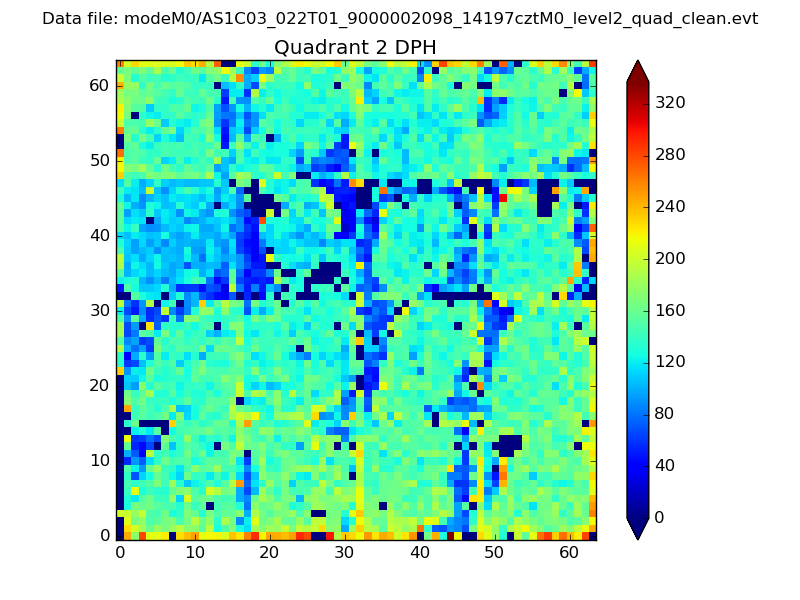
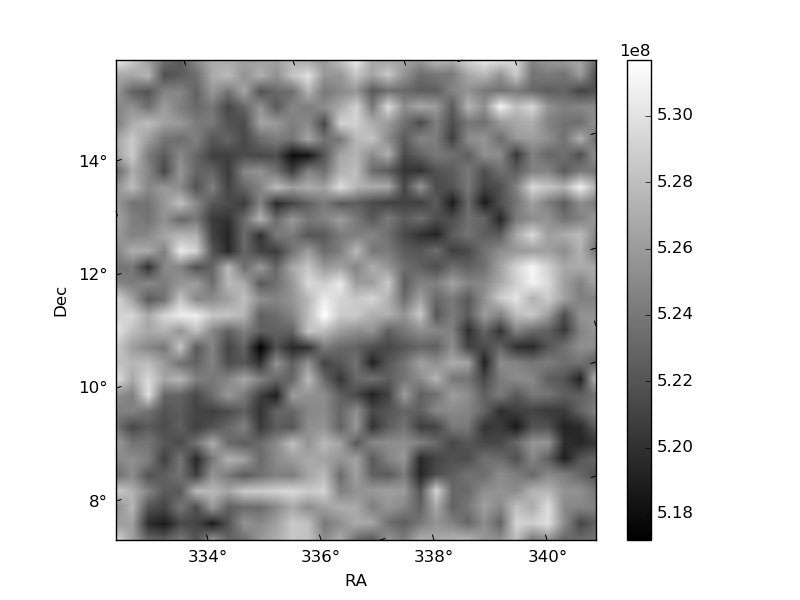
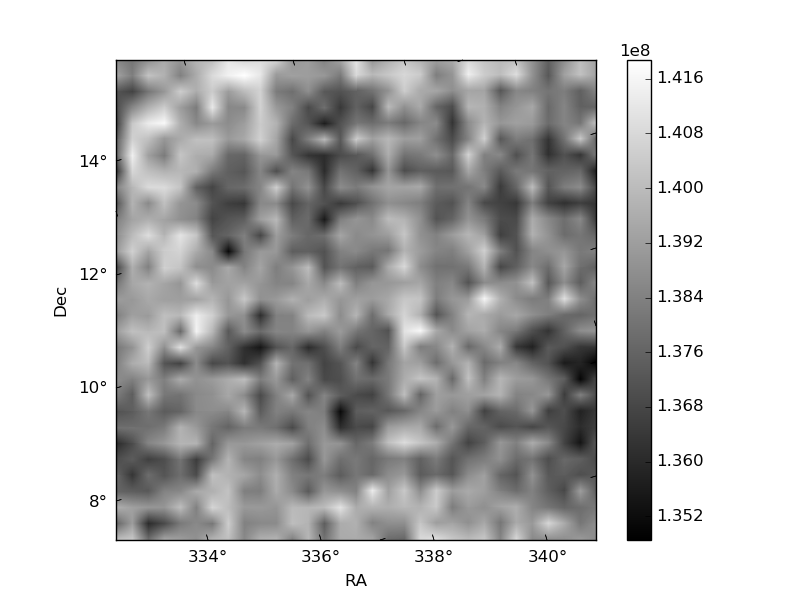
Histogram calculated using DETX and DETY for each event in the final _common_clean file
| Quadrant A | 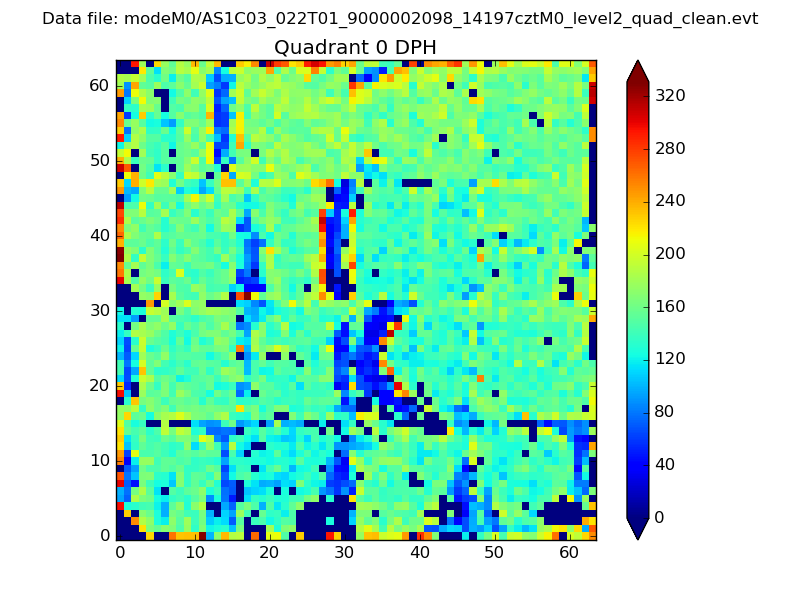 |
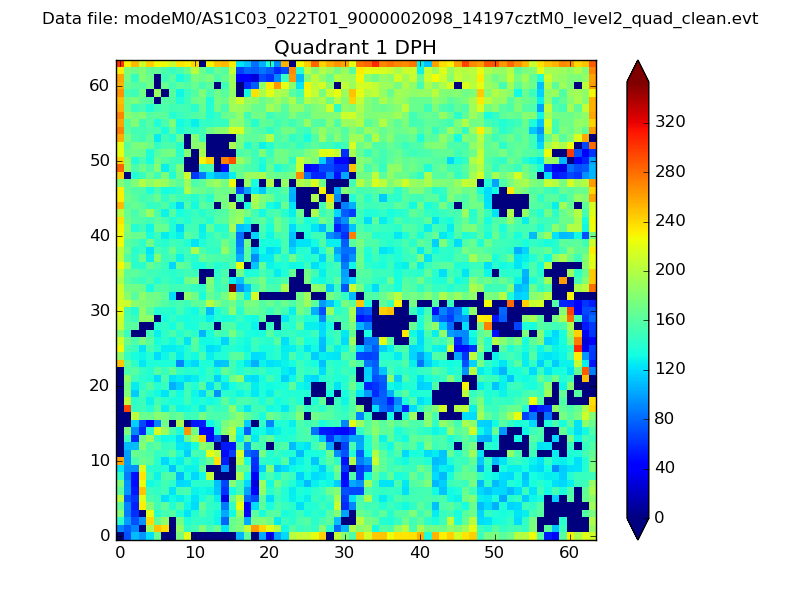 |
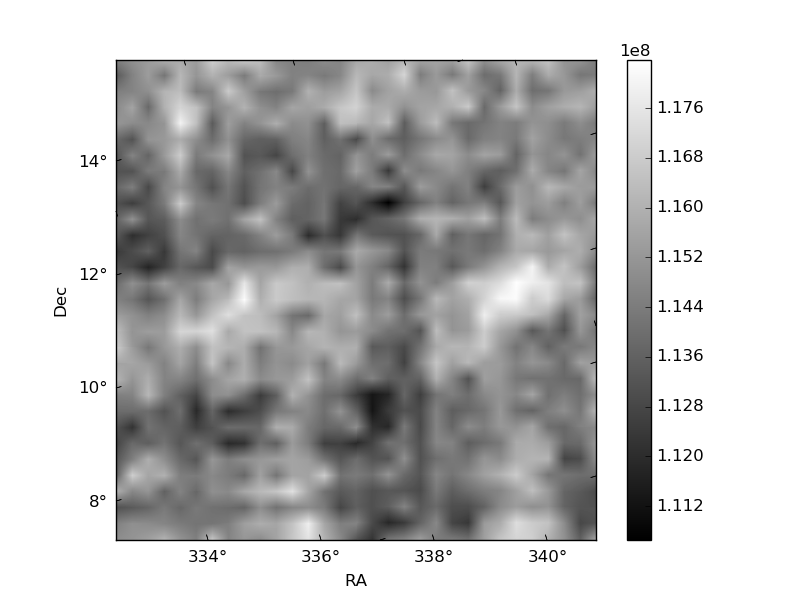
Quadrant B |
|---|---|---|---|
| Quadrant D | 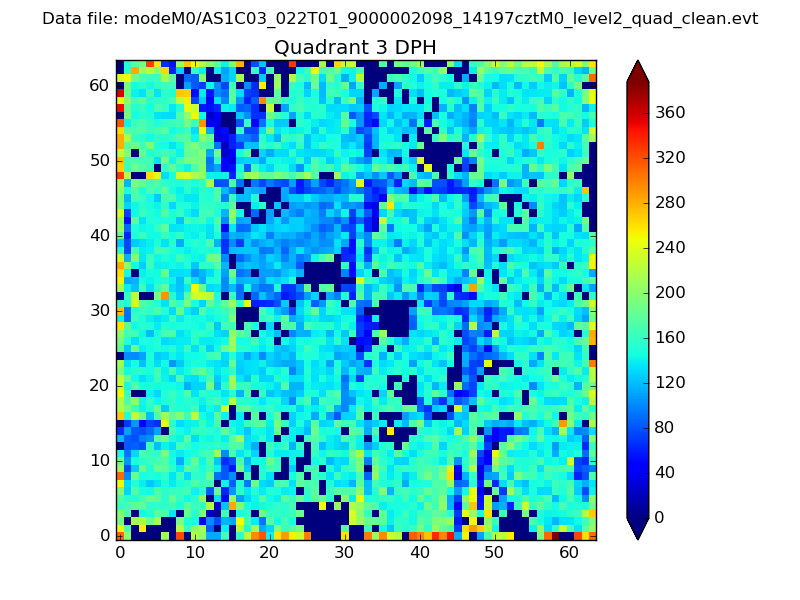 |
 |
Quadrant C |
| Plot type | Count rate plots | Images |
|---|---|---|
| Comparison with Poisson distribution Blue bars denote a histogram of data divided into 1 sec bins. Red curve is a Poisson curve with rate = median count rate of data. |
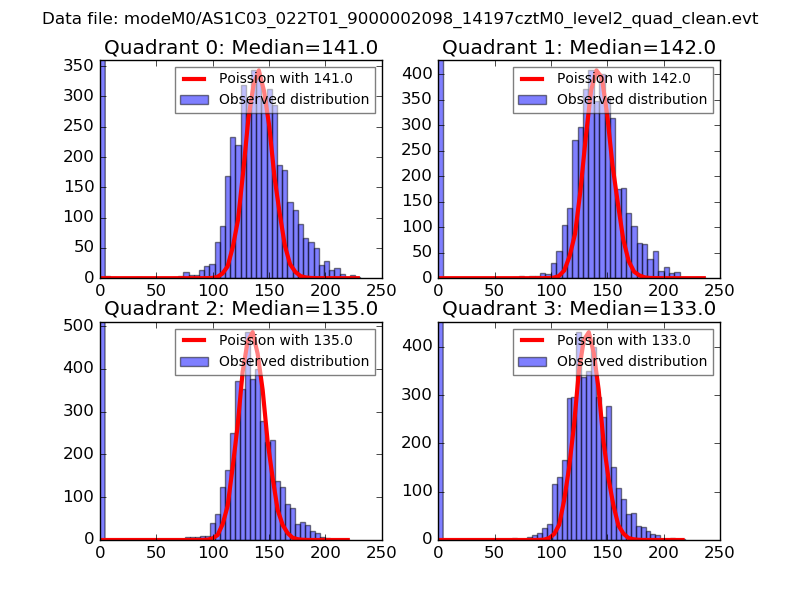 |
 |
| Quadrant-wise count rates Data is divided into 100 sec bins |
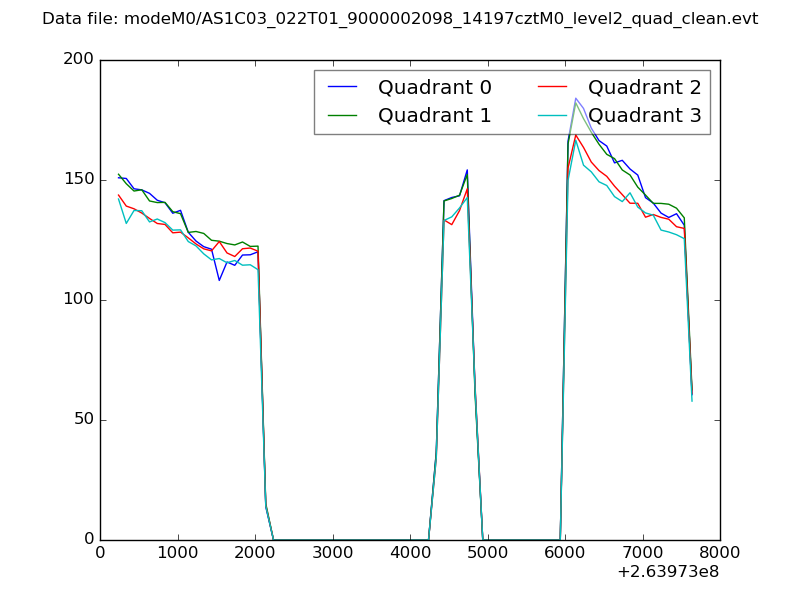 |
|
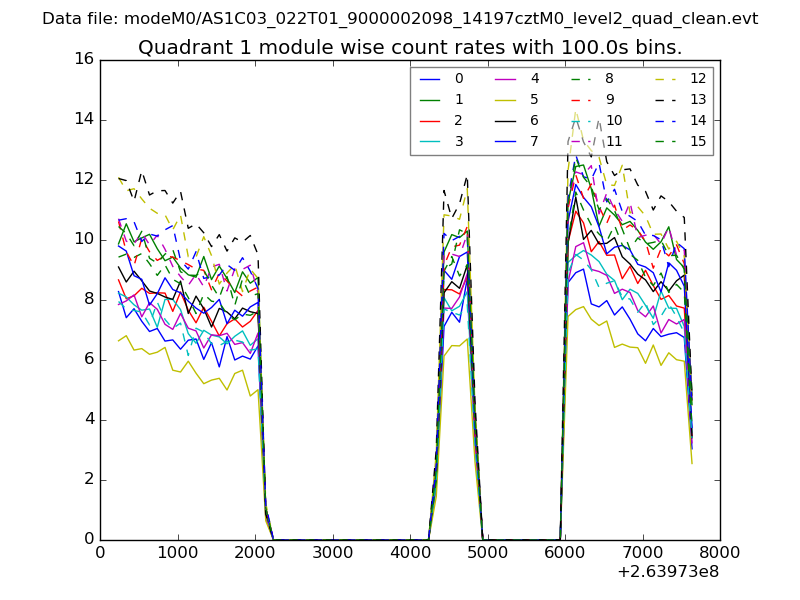
| Module-wise count rates for Quadrant A Data is divided into 100 sec bins |
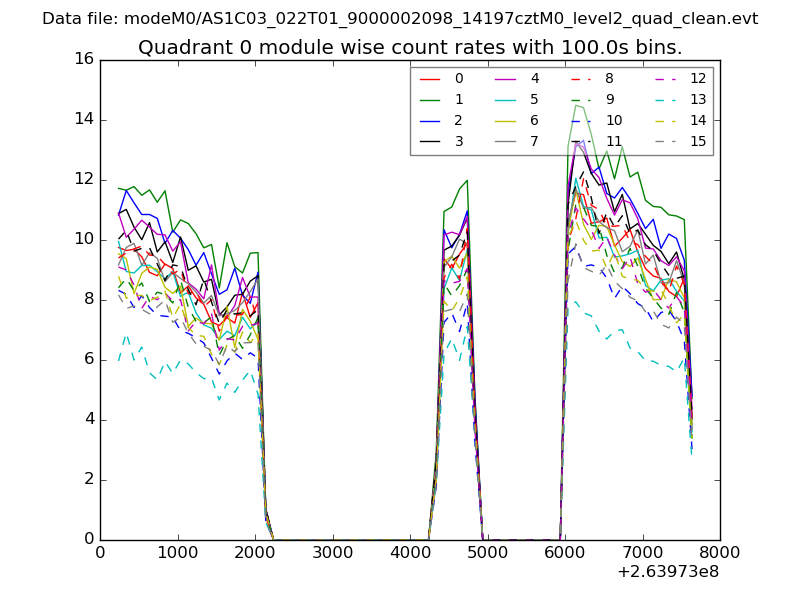 |
 |
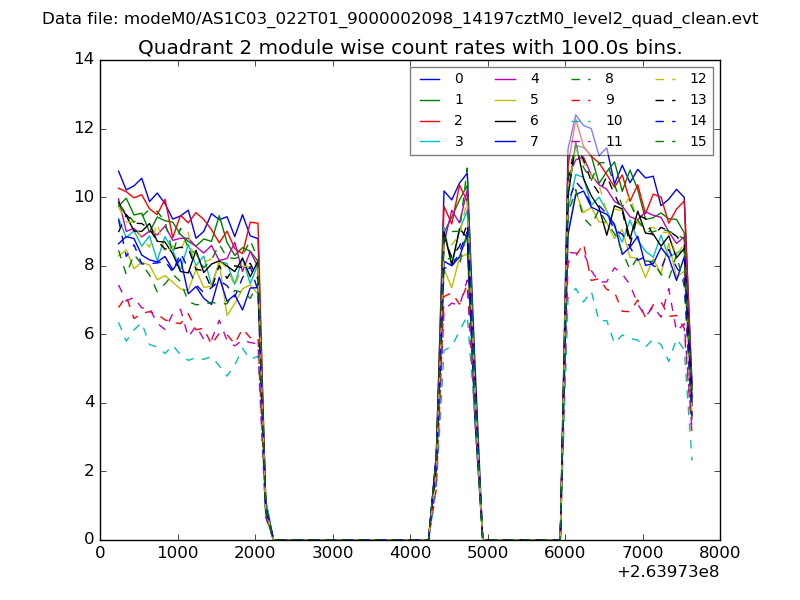
| Module-wise count rates for Quadrant B Data is divided into 100 sec bins |
 |
 |
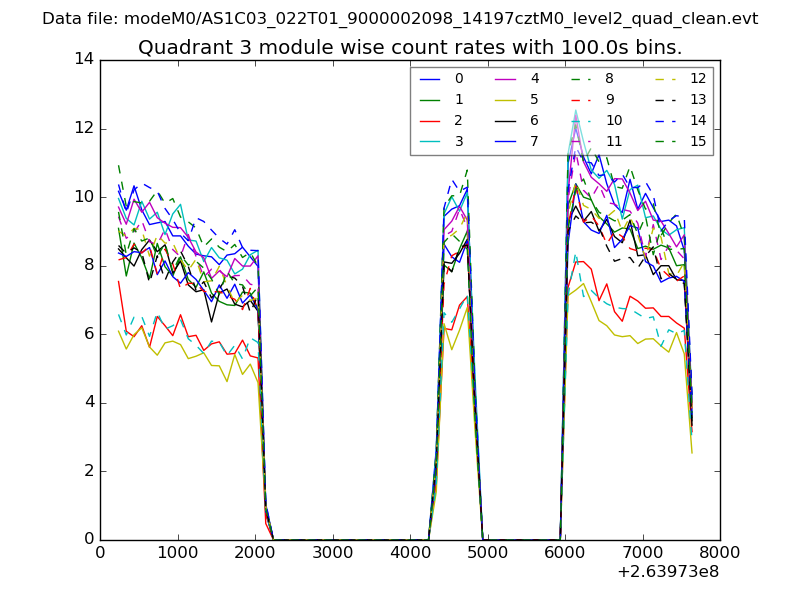
| Module-wise count rates for Quadrant C Data is divided into 100 sec bins |
 |
 |
| Module-wise count rates for Quadrant D Data is divided into 100 sec bins |
 |
 |
| Parameter | Plot |
|---|---|
| CZT HV Monitor | 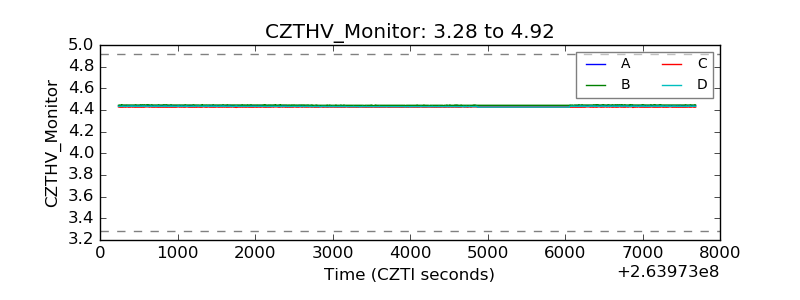 |
| D_VDD | 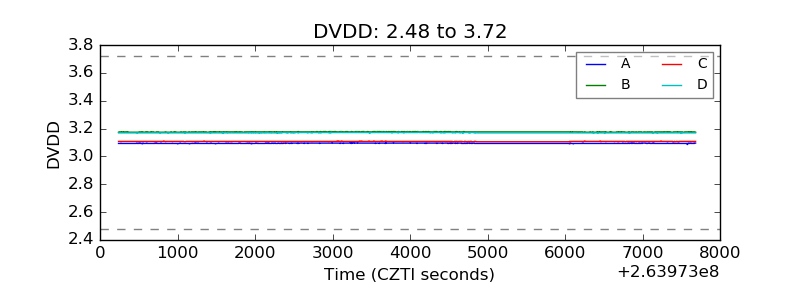 |
| Temperature 1 | 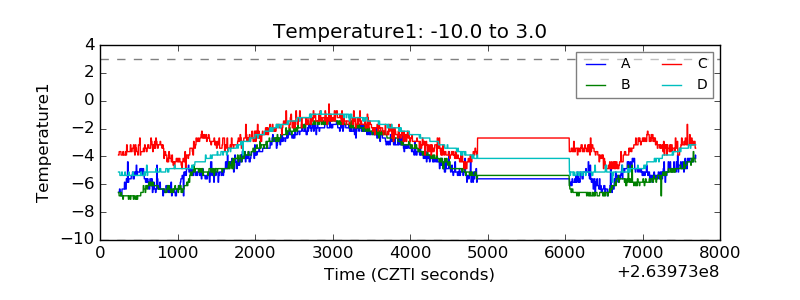 |
| Veto HV Monitor | 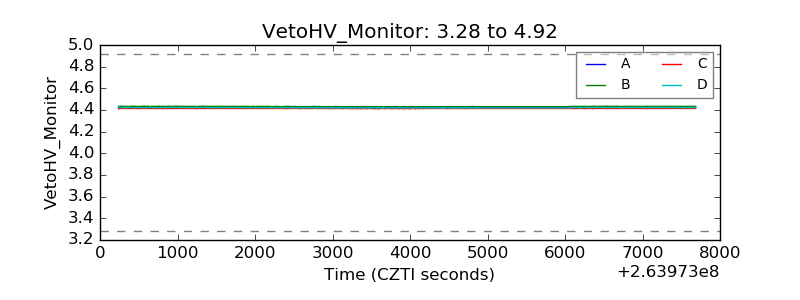 |
| Veto LLD | 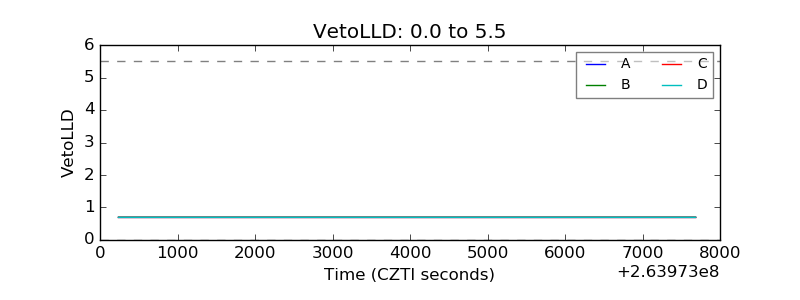 |
| Alpha Counter | 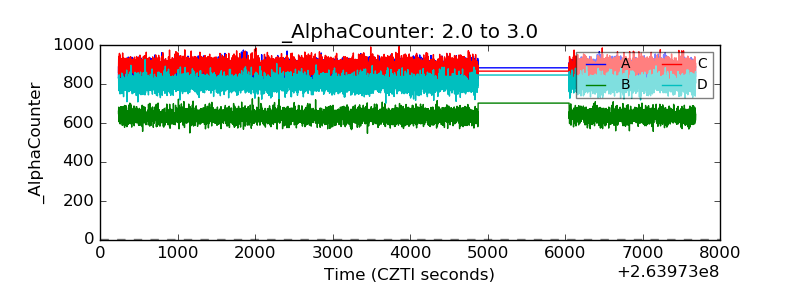 |
| _CPM_Rate | 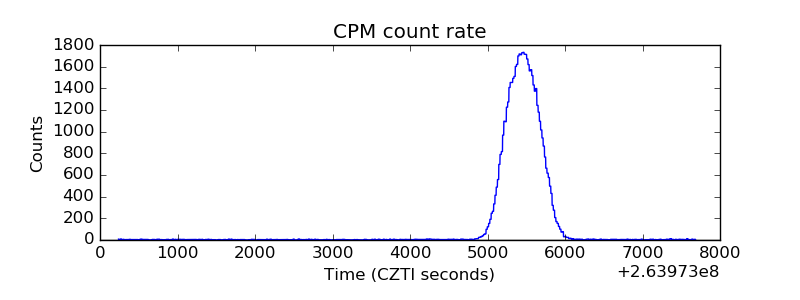 |
| CZT Counter |  |
| +2.5 Volts monitor |  |
| +5 Volts monitor |  |
| _ROLL_ROT | 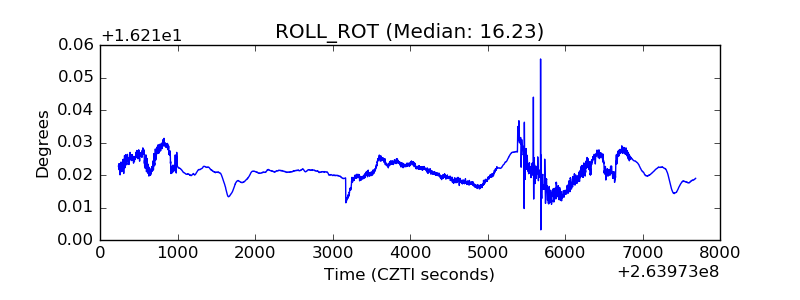 |
| _Roll_DEC | 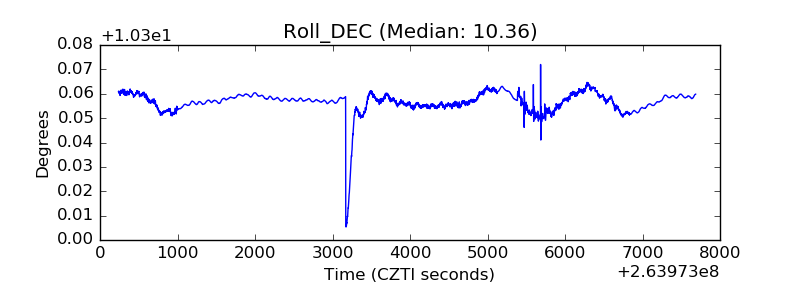 |
| _Roll_RA | 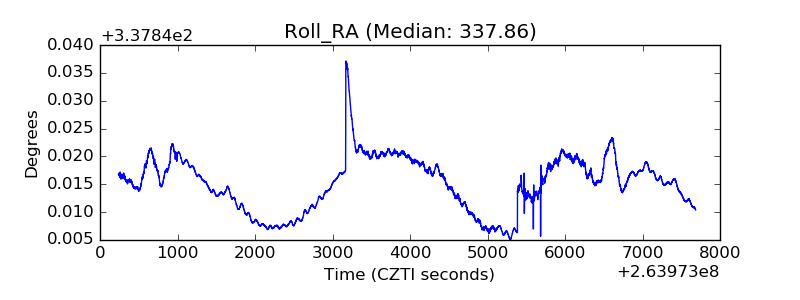 |
| Veto Counter | 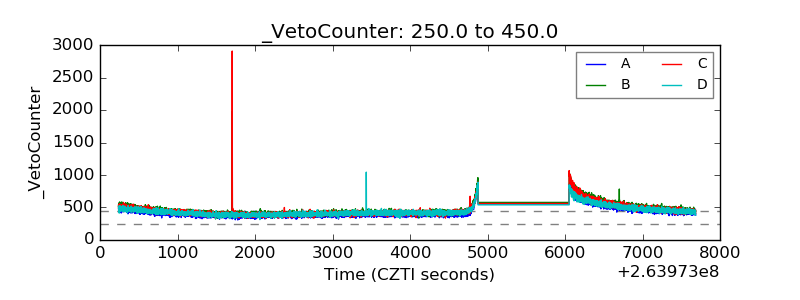 |