| Param | Original file | Final file |
|---|---|---|
| Filename | modeM0/AS1C03_022T01_9000002098_14199cztM0_level2.evt | modeM0/AS1C03_022T01_9000002098_14199cztM0_level2_quad_clean.evt |
| Size (bytes) | 450,348,480 | 79,888,320 |
| Size | 429.5 MB | 76.2 MB |
| Events in quadrant A | 3,081,784 | 517,597 |
| Events in quadrant B | 3,975,671 | 515,678 |
| Events in quadrant C | 3,067,715 | 495,781 |
| Events in quadrant D | 3,126,055 | 491,104 |
| Mode M9 | |||
|---|---|---|---|
| Quadrant | BADHDUFLAG | Total packets | Discarded packets |
| A | 0 | 13 | 0 |
| B | 0 | 13 | 0 |
| C | 0 | 13 | 0 |
| D | 0 | 13 | 0 |
| Mode M0 | |||
|---|---|---|---|
| Quadrant | BADHDUFLAG | Total packets | Discarded packets |
| A | 0 | 12366 | 2 |
| B | 0 | 15213 | 1 |
| C | 0 | 12208 | 1 |
| D | 0 | 12617 | 1 |
| Mode SS | |||
|---|---|---|---|
| Quadrant | BADHDUFLAG | Total packets | Discarded packets |
| A | 0 | 116 | 0 |
| B | 0 | 116 | 0 |
| C | 0 | 116 | 0 |
| D | 0 | 116 | 0 |
| Quadrant | Total seconds | Saturated seconds | Saturation percentage |
|---|---|---|---|
| A | 5708 | 52 | 0.911002% |
| B | 5708 | 367 | 6.429573% |
| C | 5708 | 65 | 1.138753% |
| D | 5708 | 39 | 0.683252% |
Noise dominated data is calculated using 1-second bins in cleaned event files. If a bin has >2000 counts, and if more than 50% of those come from <1% of pixels, then it is considered to be noise-dominated and hence unusable.
| Quadrant | # 1 sec bins | Bins with >0 counts | Bins with >2000 counts | High rate bins dominated by noise | Noise dominated (total time) | Noise dominated (detector-on time) | Marked lightcurve |
|---|---|---|---|---|---|---|---|
| A | 7019 | 5711 | 0 | 0 | 0.00% | 0.00% | 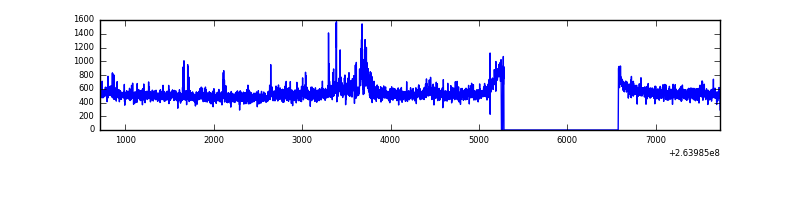 |
| B | 7019 | 5711 | 203 | 203 | 2.89% | 3.55% | 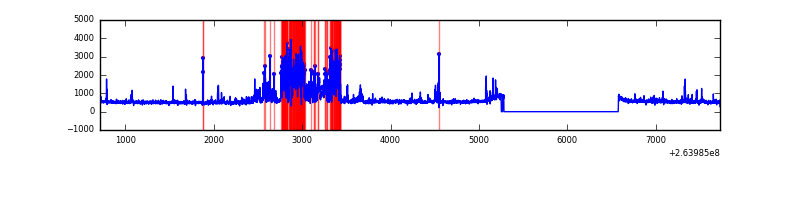 |
| C | 7019 | 5711 | 24 | 24 | 0.34% | 0.42% | 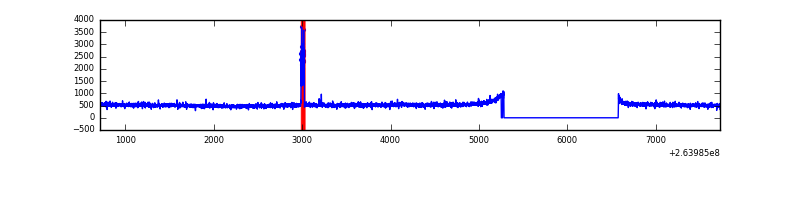 |
| D | 7019 | 5711 | 4 | 4 | 0.06% | 0.07% | 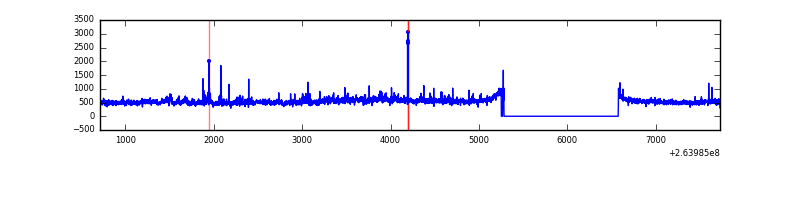 |
Top three noisy pixels from each quadrant. If the there are fewer than three noisy pixels in the level2.evt file, extra rows are filled as -1
| Pixel properties | Quadrant properties | ||||||
|---|---|---|---|---|---|---|---|
| Quadrant | DetID | PixID | Counts | Sigma | Mean | Median | Sigma |
| A | 8 | 15 | 114851 | 744.89 | 757 | 744 | 153.2 |
| A | 12 | 189 | 37798 | 241.89 | 757 | 744 | 153.2 |
| A | 12 | 96 | 13837 | 85.47 | 757 | 744 | 153.2 |
| B | 0 | 182 | 864235 | 6235.16 | 729 | 714 | 138.5 |
| B | 4 | 97 | 78432 | 561.17 | 729 | 714 | 138.5 |
| B | 0 | 189 | 40771 | 289.24 | 729 | 714 | 138.5 |
| C | 3 | 233 | 217034 | 1319.79 | 711 | 717 | 163.9 |
| C | 0 | 207 | 79369 | 479.87 | 711 | 717 | 163.9 |
| C | 13 | 61 | 5103 | 26.76 | 711 | 717 | 163.9 |
| D | 8 | 195 | 233140 | 1325.41 | 725 | 708 | 175.4 |
| D | 5 | 222 | 43517 | 244.11 | 725 | 708 | 175.4 |
| D | 2 | 152 | 36684 | 205.15 | 725 | 708 | 175.4 |
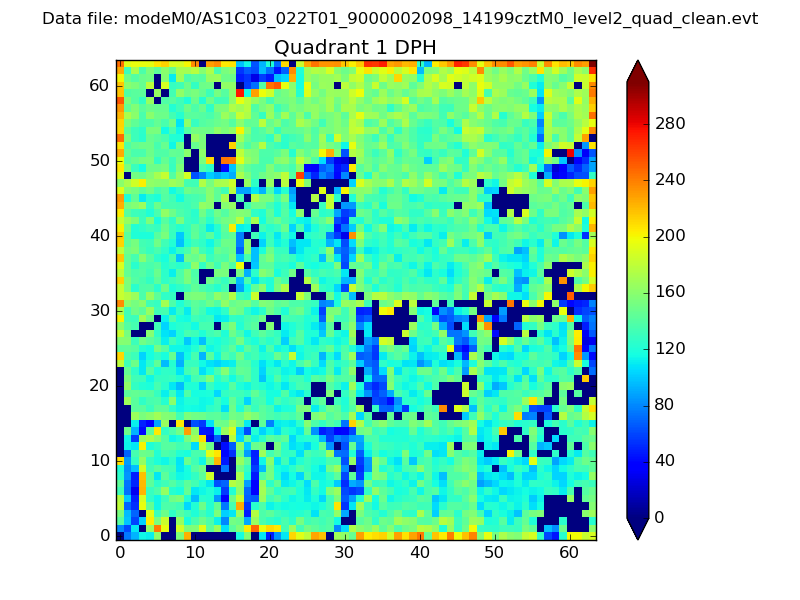
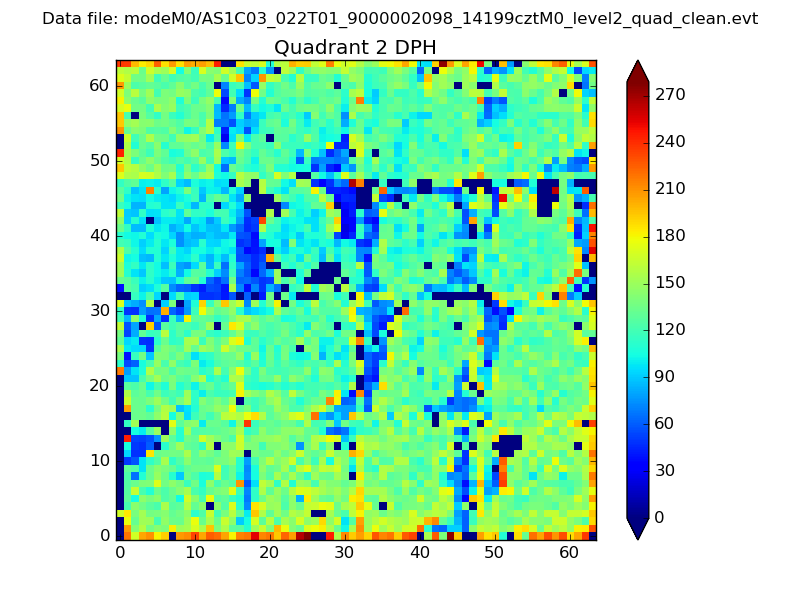
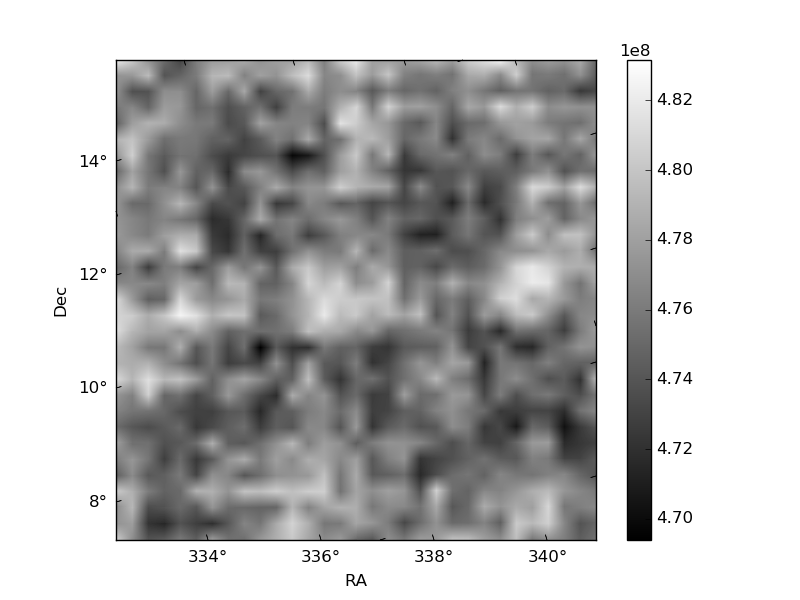
Histogram calculated using DETX and DETY for each event in the final _common_clean file
| Quadrant A |  |
 |
Quadrant B |
|---|---|---|---|
| Quadrant D | 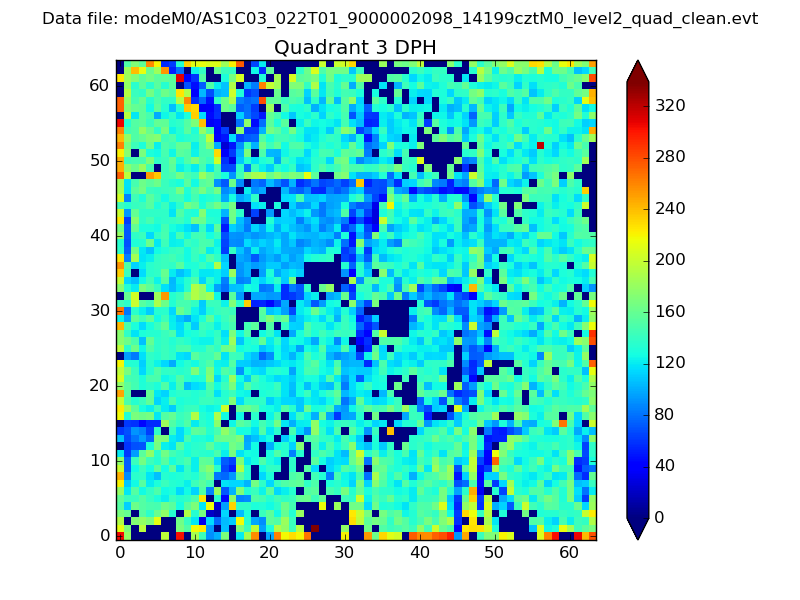 |
 |
Quadrant C |
| Plot type | Count rate plots | Images |
|---|---|---|
| Comparison with Poisson distribution Blue bars denote a histogram of data divided into 1 sec bins. Red curve is a Poisson curve with rate = median count rate of data. |
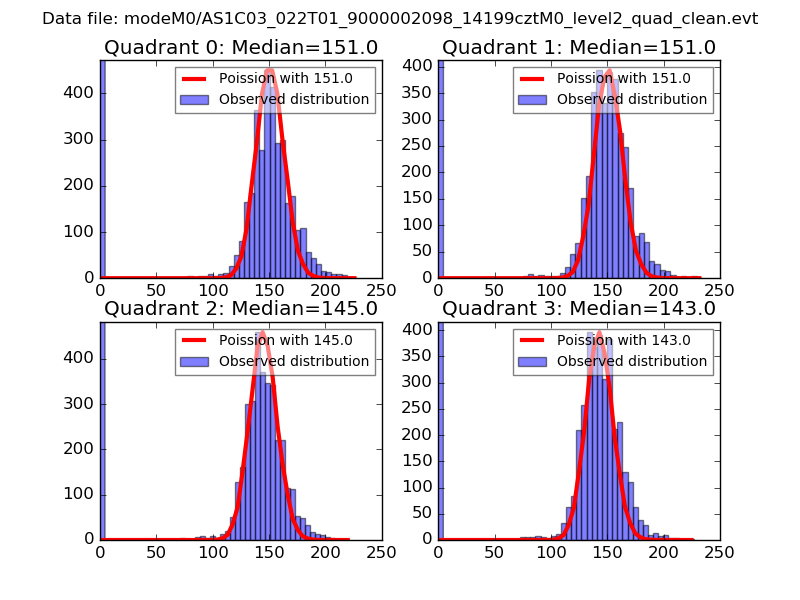 |
 |
| Quadrant-wise count rates Data is divided into 100 sec bins |
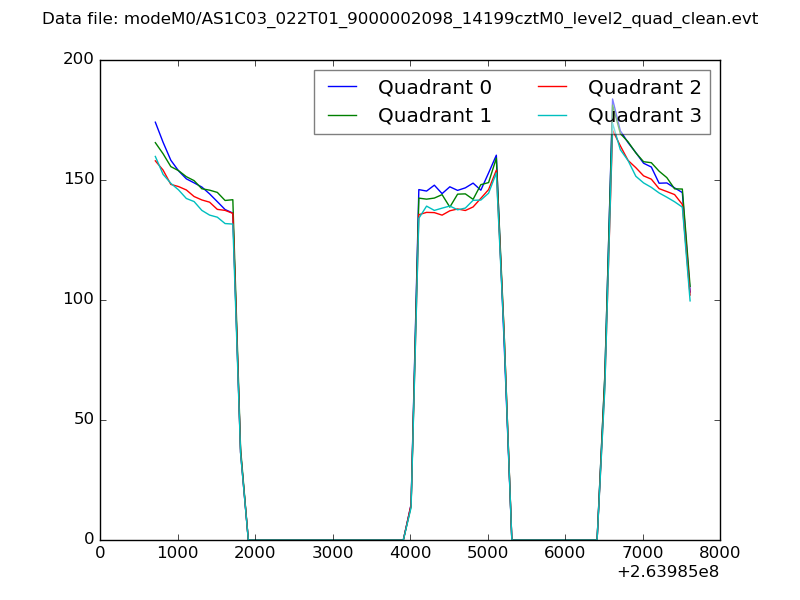 |
|
| Module-wise count rates for Quadrant A Data is divided into 100 sec bins |
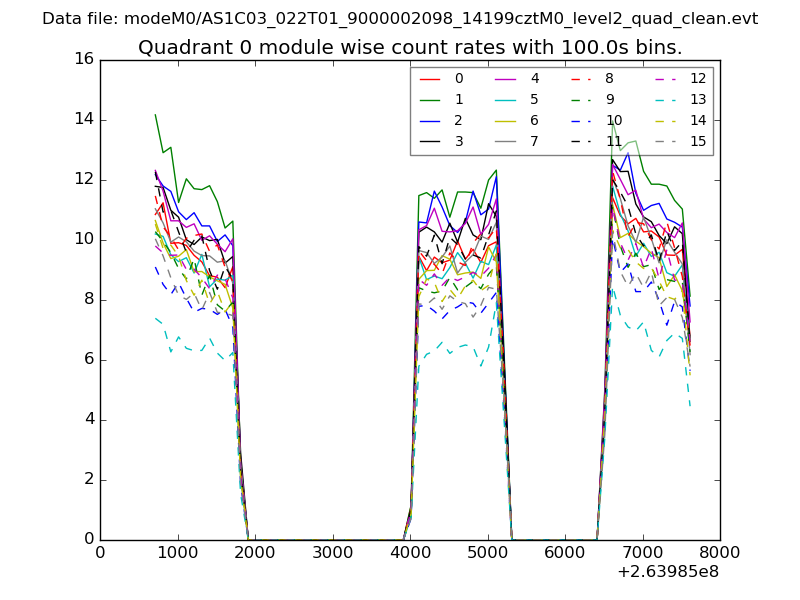 |
 |
| Module-wise count rates for Quadrant B Data is divided into 100 sec bins |
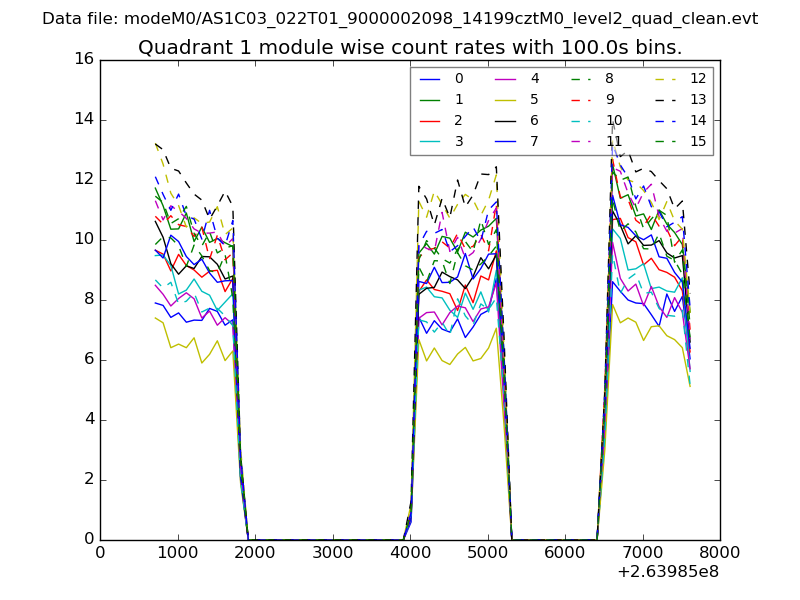 |
 |
| Module-wise count rates for Quadrant C Data is divided into 100 sec bins |
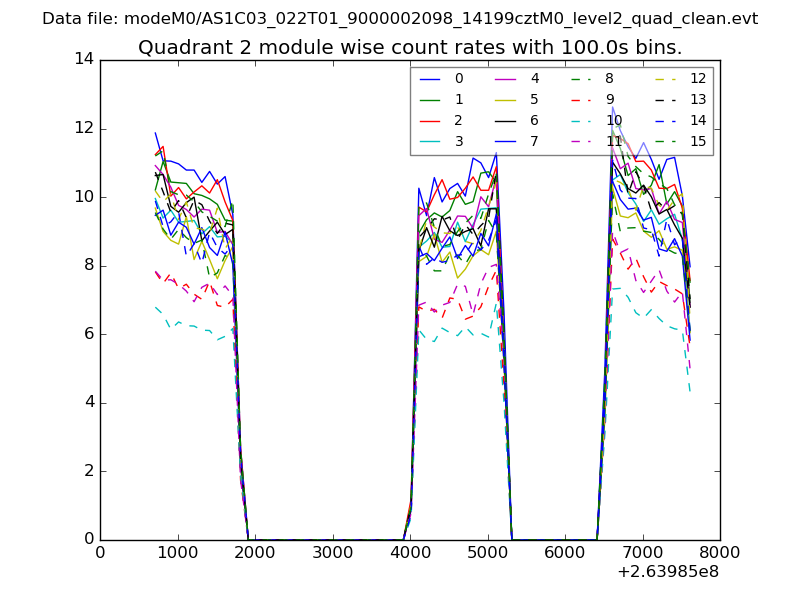 |
 |
| Module-wise count rates for Quadrant D Data is divided into 100 sec bins |
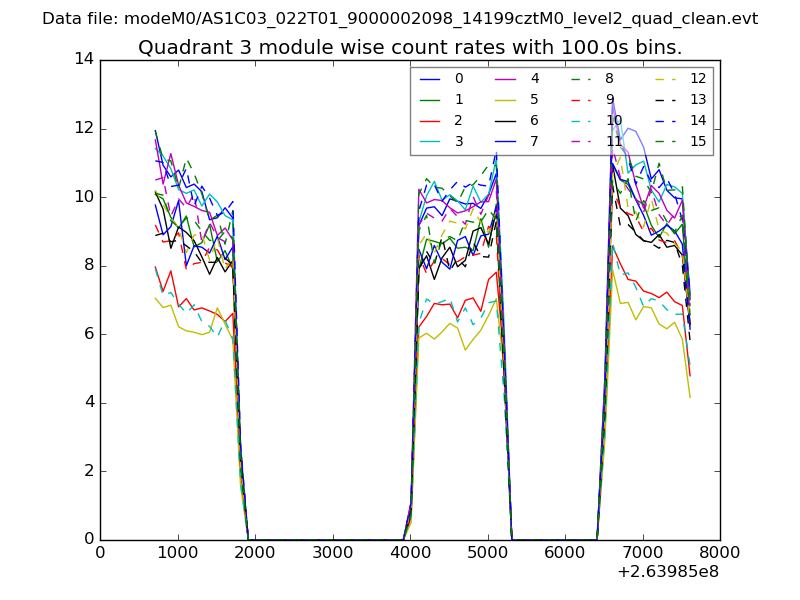 |
 |
| Parameter | Plot |
|---|---|
| CZT HV Monitor | 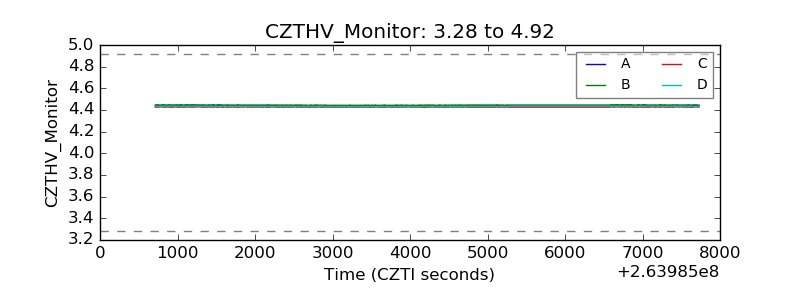 |
| D_VDD | 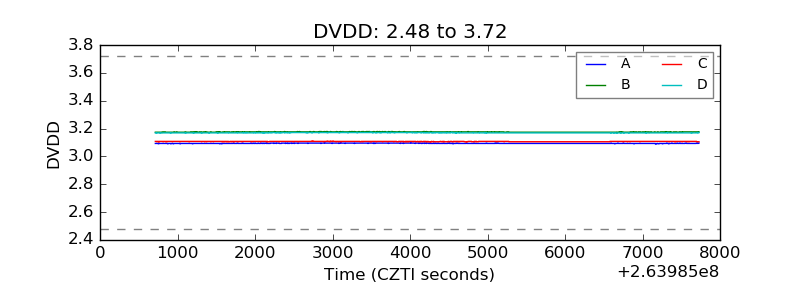 |
| Temperature 1 | 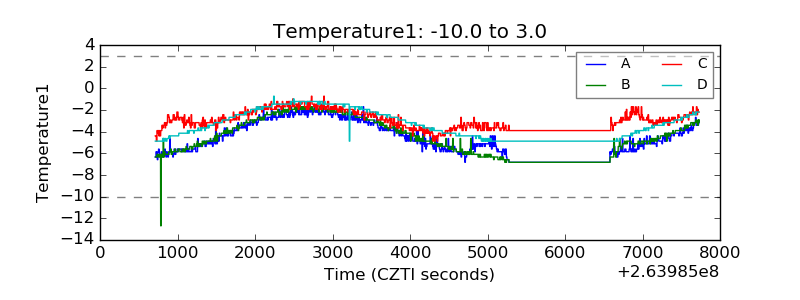 |
| Veto HV Monitor | 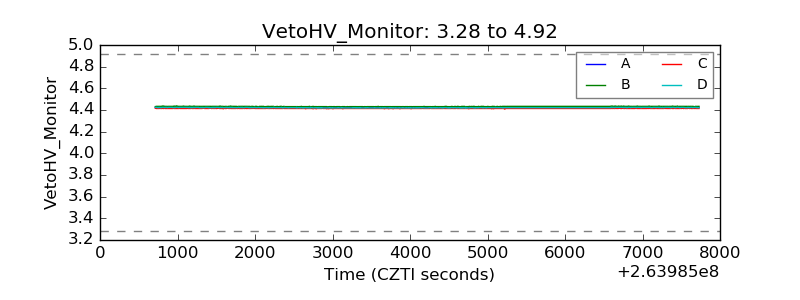 |
| Veto LLD | 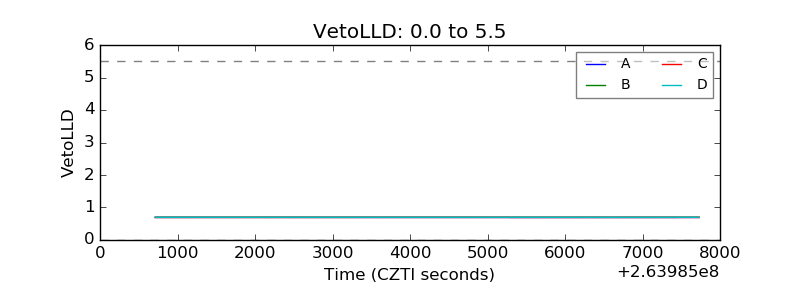 |
| Alpha Counter | 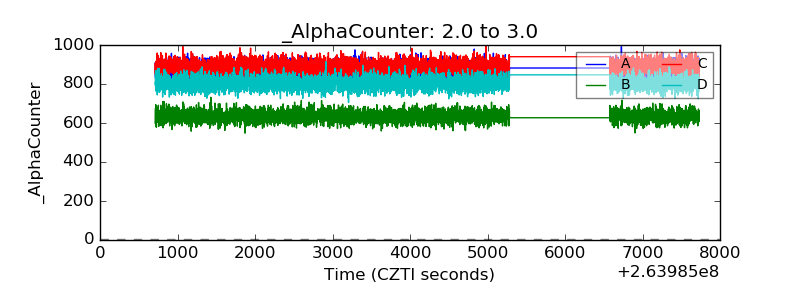 |
| _CPM_Rate | 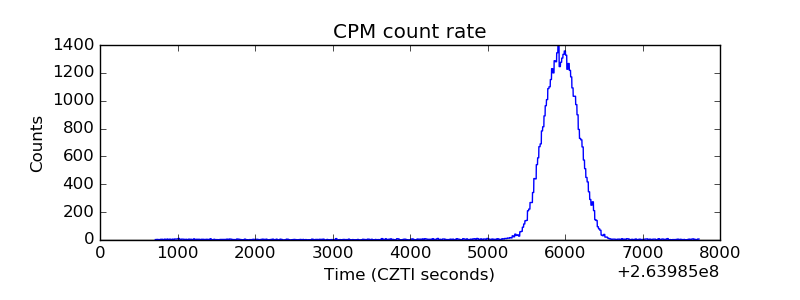 |
| CZT Counter | 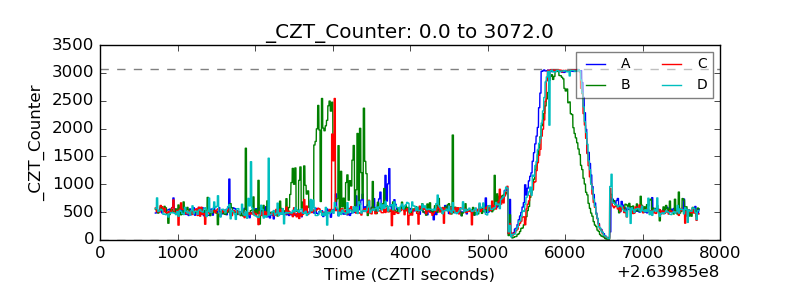 |
| +2.5 Volts monitor |  |
| +5 Volts monitor |  |
| _ROLL_ROT | 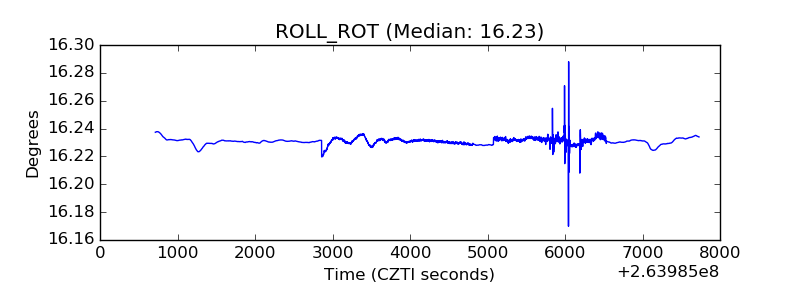 |
| _Roll_DEC | 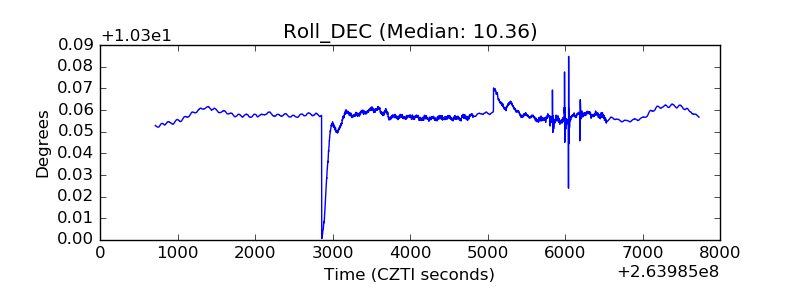 |
| _Roll_RA | 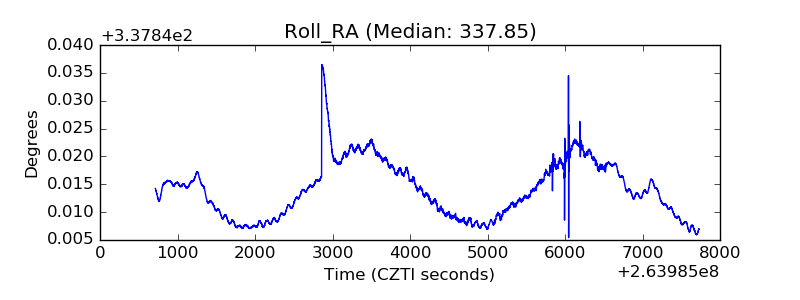 |
| Veto Counter | 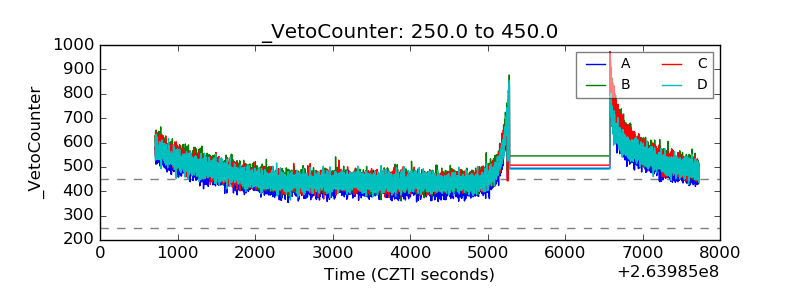 |