| Param | Original file | Final file |
|---|---|---|
| Filename | modeM0/AS1C03_022T01_9000002098_14202cztM0_level2.evt | modeM0/AS1C03_022T01_9000002098_14202cztM0_level2_quad_clean.evt |
| Size (bytes) | 530,928,000 | 72,722,880 |
| Size | 506.3 MB | 69.4 MB |
| Events in quadrant A | 3,823,954 | 439,067 |
| Events in quadrant B | 4,440,284 | 433,588 |
| Events in quadrant C | 3,557,622 | 419,372 |
| Events in quadrant D | 3,782,113 | 422,276 |
| Mode M9 | |||
|---|---|---|---|
| Quadrant | BADHDUFLAG | Total packets | Discarded packets |
| A | 0 | 7 | 0 |
| B | 0 | 7 | 0 |
| C | 0 | 7 | 0 |
| D | 0 | 7 | 0 |
| Mode M0 | |||
|---|---|---|---|
| Quadrant | BADHDUFLAG | Total packets | Discarded packets |
| A | 0 | 15527 | 4 |
| B | 0 | 17482 | 3 |
| C | 0 | 14706 | 3 |
| D | 0 | 15779 | 3 |
| Mode SS | |||
|---|---|---|---|
| Quadrant | BADHDUFLAG | Total packets | Discarded packets |
| A | 0 | 142 | 0 |
| B | 0 | 142 | 0 |
| C | 0 | 142 | 0 |
| D | 0 | 142 | 0 |
| Quadrant | Total seconds | Saturated seconds | Saturation percentage |
|---|---|---|---|
| A | 7001 | 158 | 2.256820% |
| B | 7001 | 416 | 5.942008% |
| C | 7001 | 109 | 1.556920% |
| D | 7002 | 120 | 1.713796% |
Noise dominated data is calculated using 1-second bins in cleaned event files. If a bin has >2000 counts, and if more than 50% of those come from <1% of pixels, then it is considered to be noise-dominated and hence unusable.
| Quadrant | # 1 sec bins | Bins with >0 counts | Bins with >2000 counts | High rate bins dominated by noise | Noise dominated (total time) | Noise dominated (detector-on time) | Marked lightcurve |
|---|---|---|---|---|---|---|---|
| A | 7687 | 7004 | 10 | 10 | 0.13% | 0.14% | 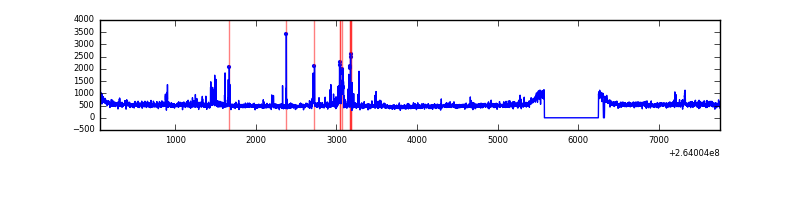 |
| B | 7687 | 7004 | 164 | 164 | 2.13% | 2.34% | 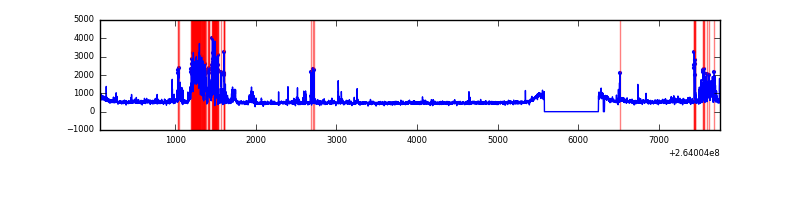 |
| C | 7687 | 7004 | 1 | 1 | 0.01% | 0.01% | 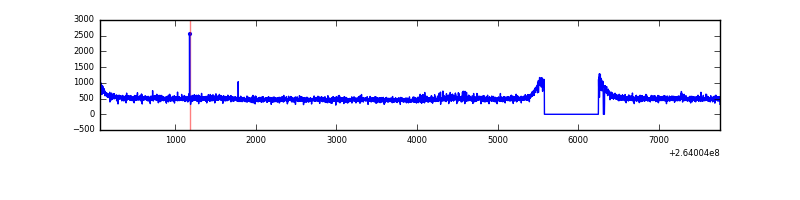 |
| D | 7688 | 7005 | 1 | 1 | 0.01% | 0.01% | 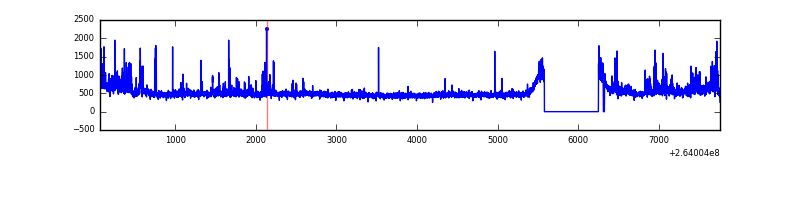 |
Top three noisy pixels from each quadrant. If the there are fewer than three noisy pixels in the level2.evt file, extra rows are filled as -1
| Pixel properties | Quadrant properties | ||||||
|---|---|---|---|---|---|---|---|
| Quadrant | DetID | PixID | Counts | Sigma | Mean | Median | Sigma |
| A | 8 | 15 | 201866 | 1099.26 | 892 | 873 | 182.8 |
| A | 9 | 143 | 153409 | 834.24 | 892 | 873 | 182.8 |
| A | 12 | 189 | 21516 | 112.9 | 892 | 873 | 182.8 |
| B | 0 | 182 | 706051 | 4201.59 | 868 | 847 | 167.8 |
| B | 4 | 97 | 96649 | 570.79 | 868 | 847 | 167.8 |
| B | 0 | 229 | 49074 | 287.34 | 868 | 847 | 167.8 |
| C | 3 | 233 | 223789 | 1118.32 | 850 | 855 | 199.3 |
| C | 7 | 235 | 11268 | 52.24 | 850 | 855 | 199.3 |
| C | 13 | 61 | 6207 | 26.85 | 850 | 855 | 199.3 |
| D | 5 | 222 | 270674 | 1278.69 | 860 | 841 | 211.0 |
| D | 8 | 195 | 87494 | 410.63 | 860 | 841 | 211.0 |
| D | 10 | 199 | 73530 | 344.46 | 860 | 841 | 211.0 |
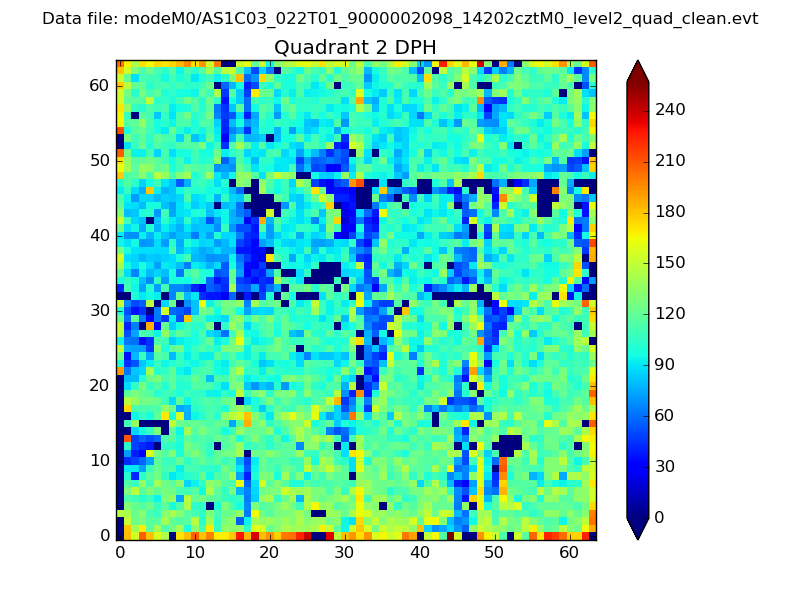
Histogram calculated using DETX and DETY for each event in the final _common_clean file
| Quadrant A | 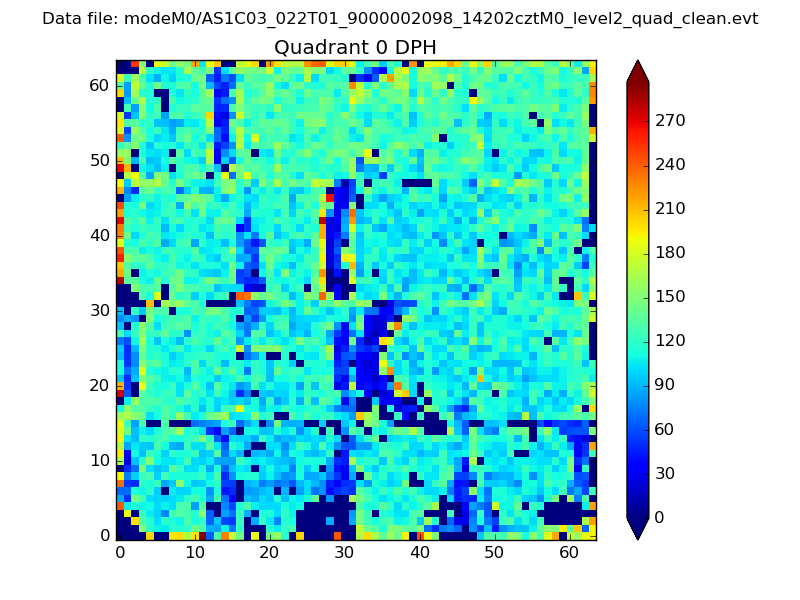 |
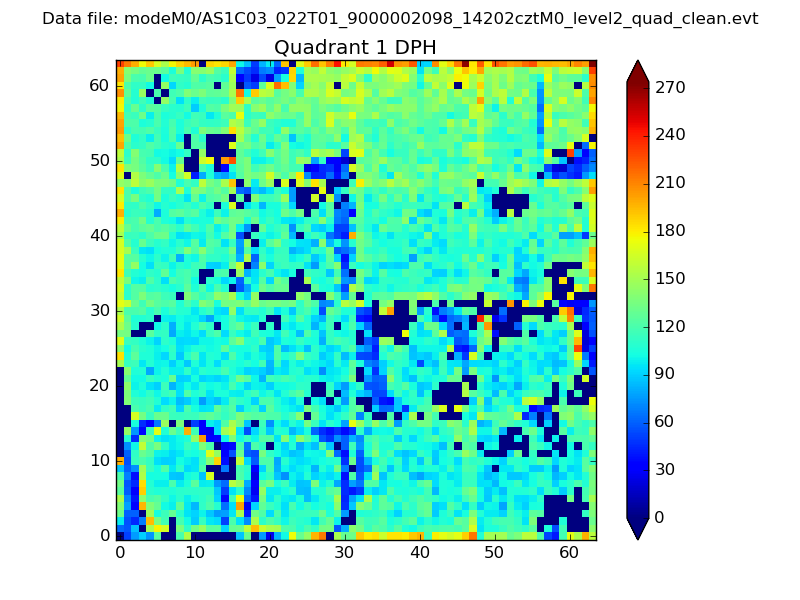 |
Quadrant B |
|---|---|---|---|
| Quadrant D | 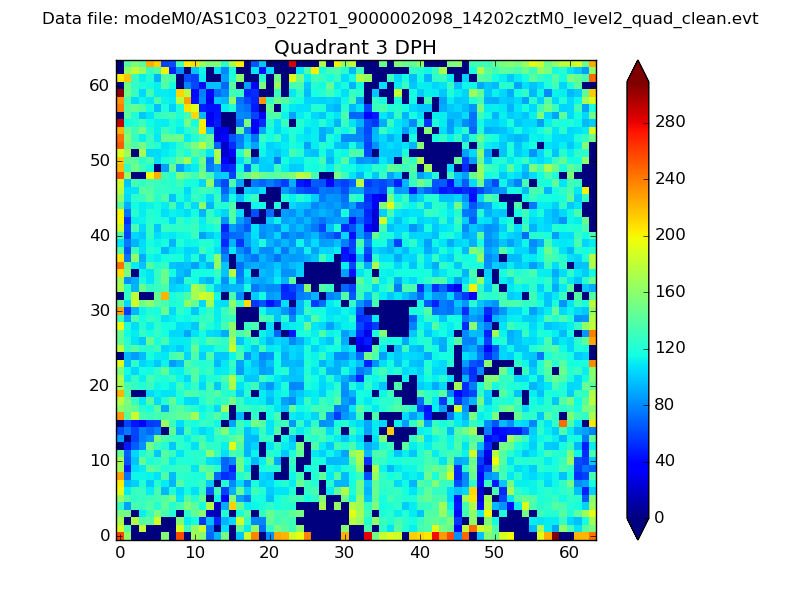 |
 |
Quadrant C |
| Plot type | Count rate plots | Images |
|---|---|---|
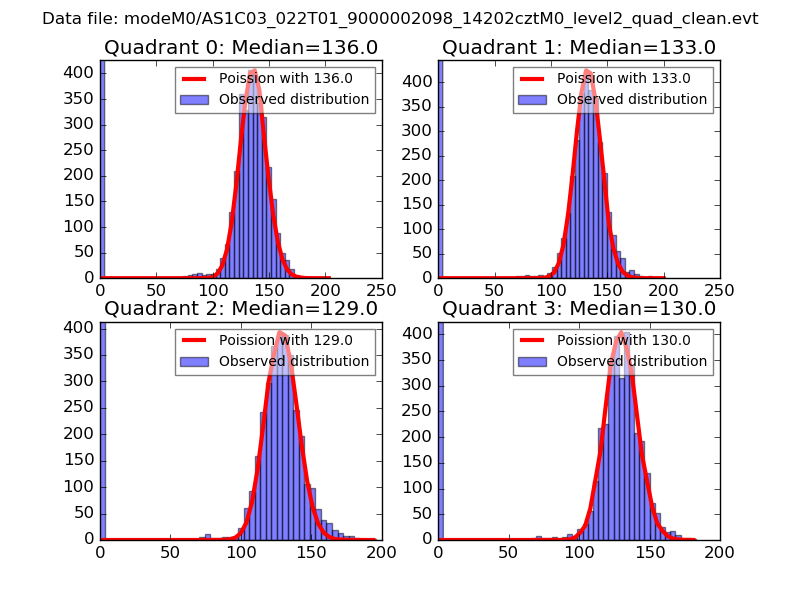
| Comparison with Poisson distribution Blue bars denote a histogram of data divided into 1 sec bins. Red curve is a Poisson curve with rate = median count rate of data. |
 |
 |
| Quadrant-wise count rates Data is divided into 100 sec bins |
 |
|
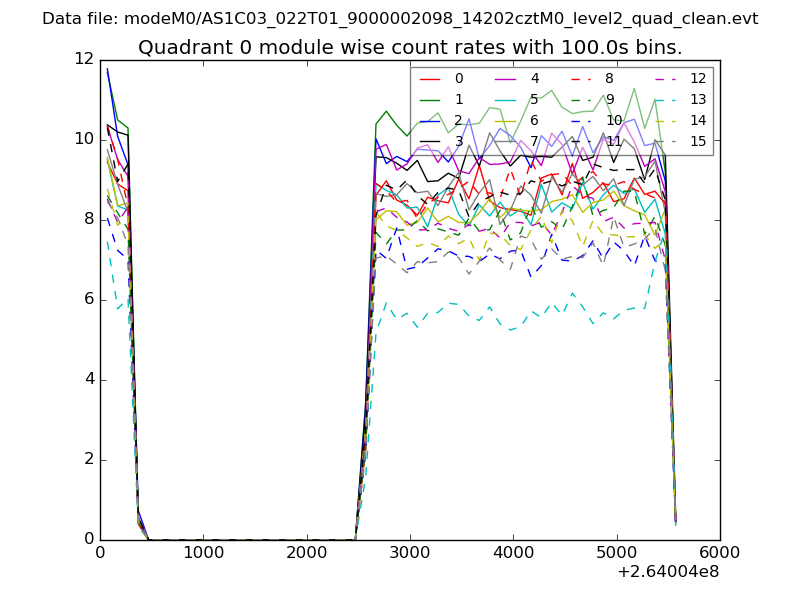
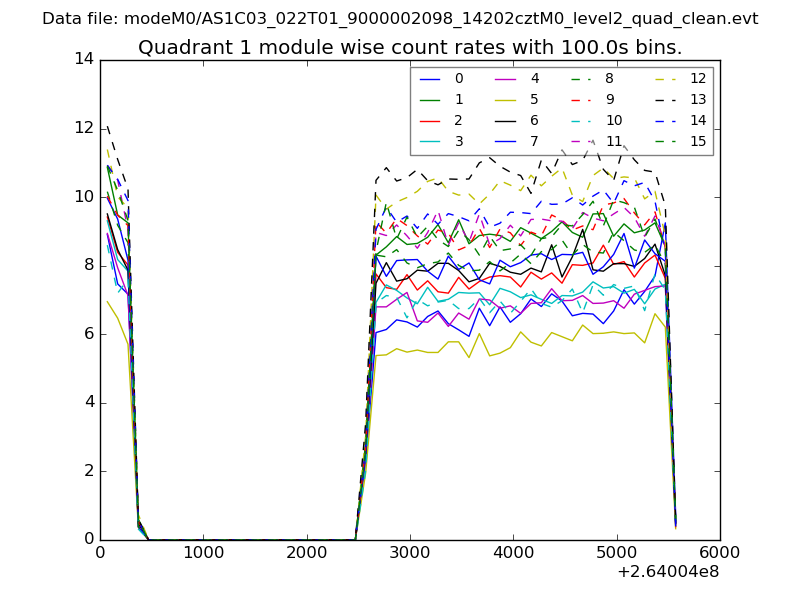
| Module-wise count rates for Quadrant A Data is divided into 100 sec bins |
 |
 |
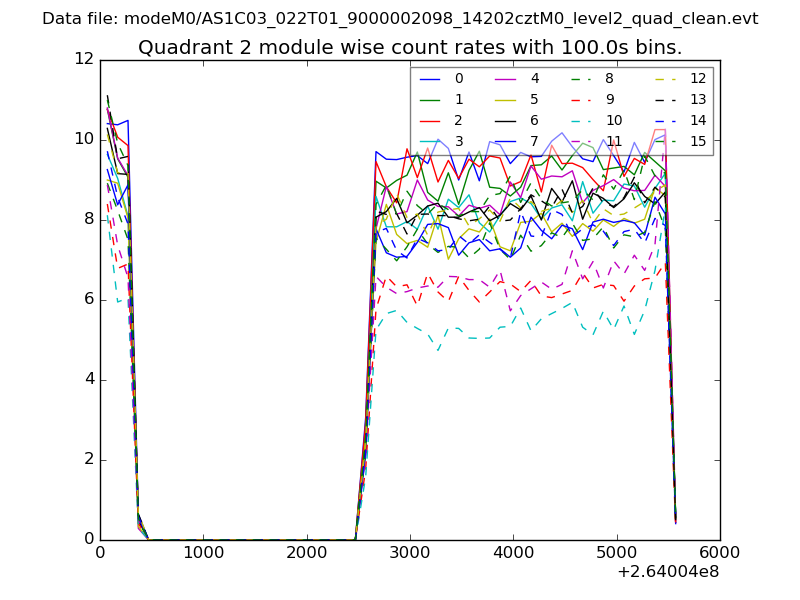
| Module-wise count rates for Quadrant B Data is divided into 100 sec bins |
 |
 |
| Module-wise count rates for Quadrant C Data is divided into 100 sec bins |
 |
 |
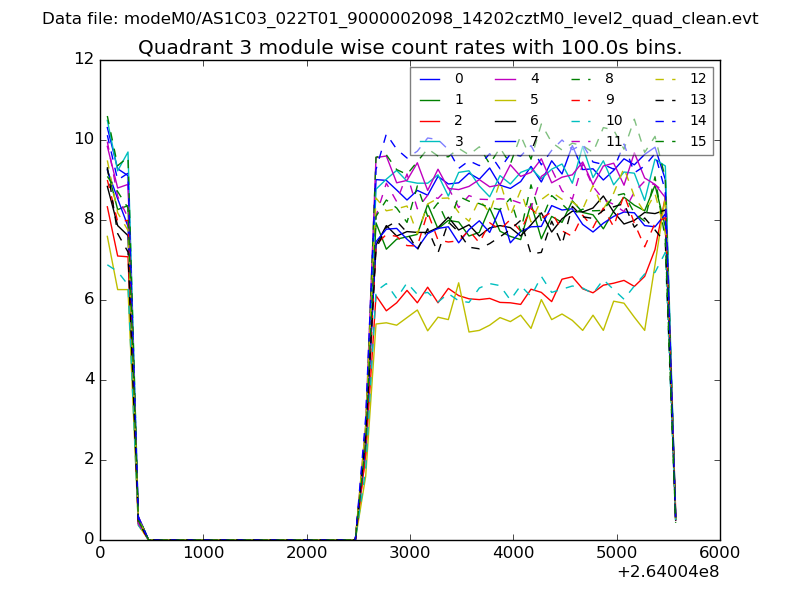
| Module-wise count rates for Quadrant D Data is divided into 100 sec bins |
 |
 |
| Parameter | Plot |
|---|---|
| CZT HV Monitor | 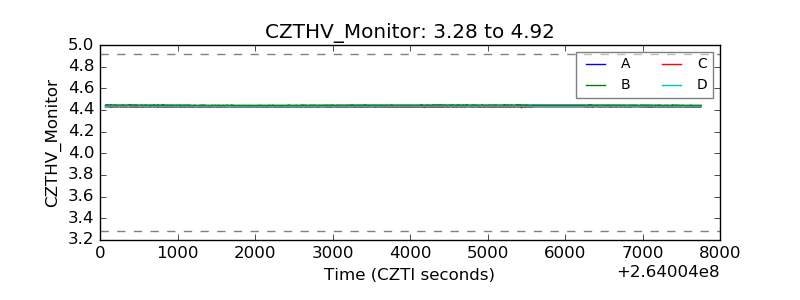 |
| D_VDD | 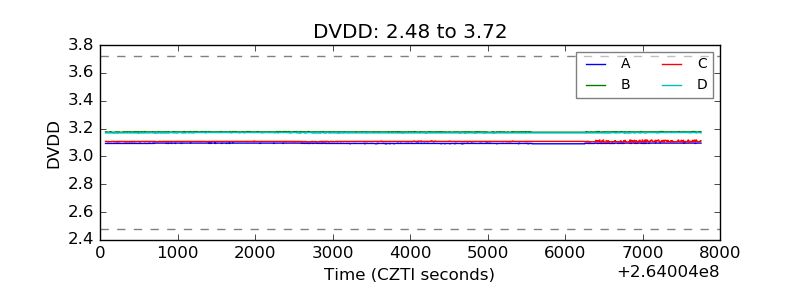 |
| Temperature 1 | 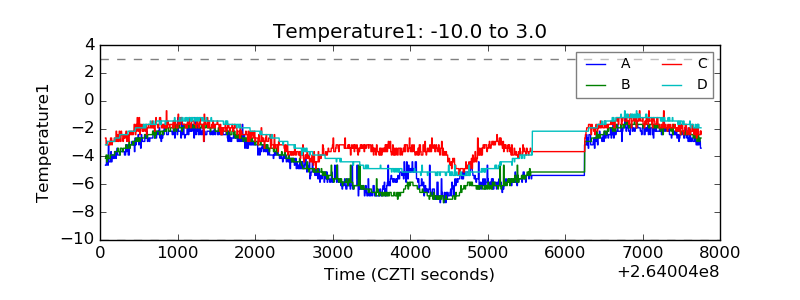 |
| Veto HV Monitor | 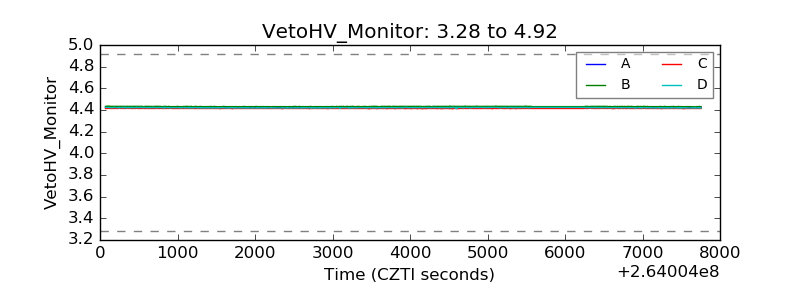 |
| Veto LLD | 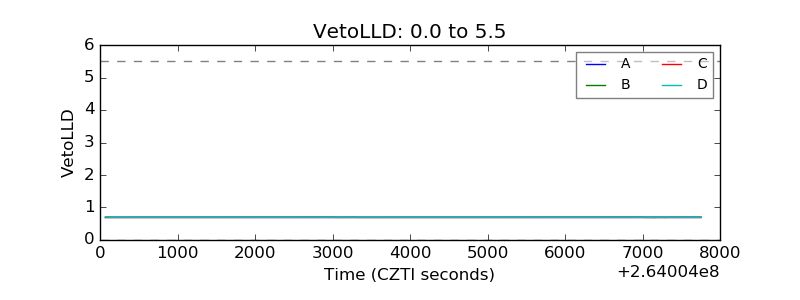 |
| Alpha Counter | 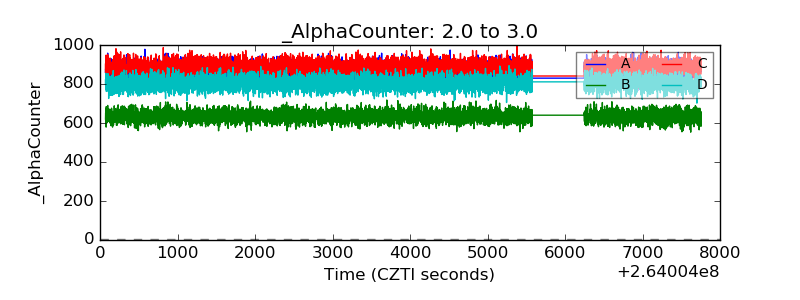 |
| _CPM_Rate | 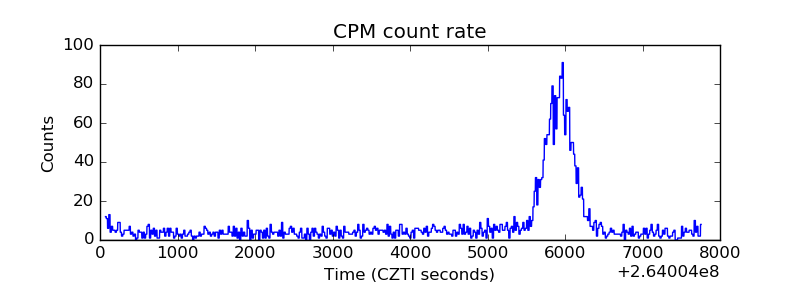 |
| CZT Counter | 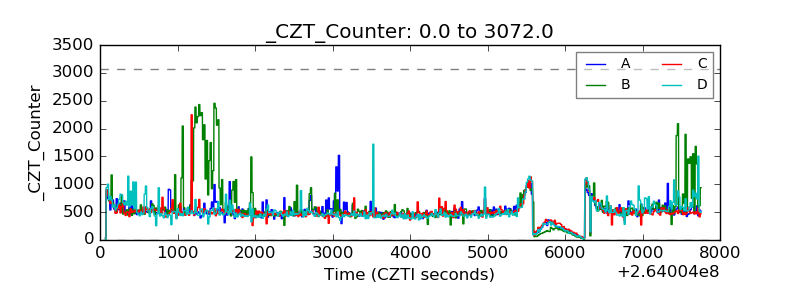 |
| +2.5 Volts monitor |  |
| +5 Volts monitor |  |
| _ROLL_ROT | 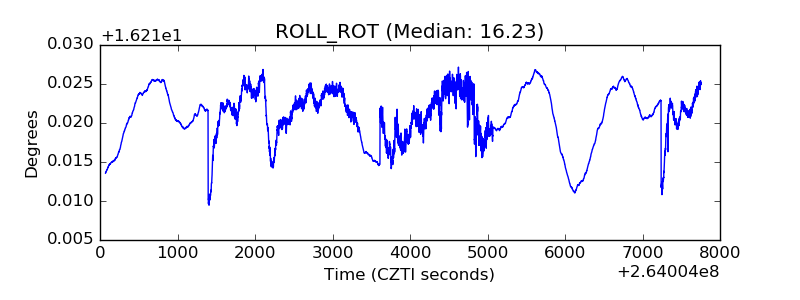 |
| _Roll_DEC | 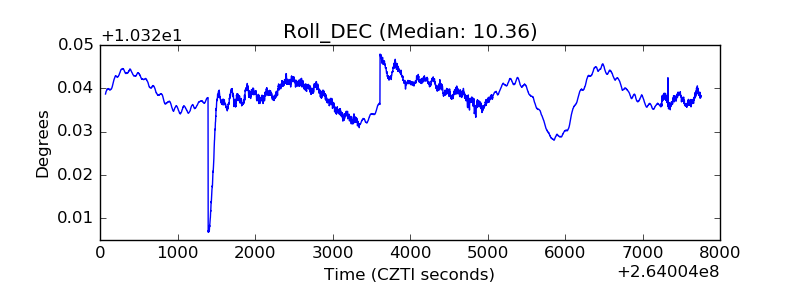 |
| _Roll_RA | 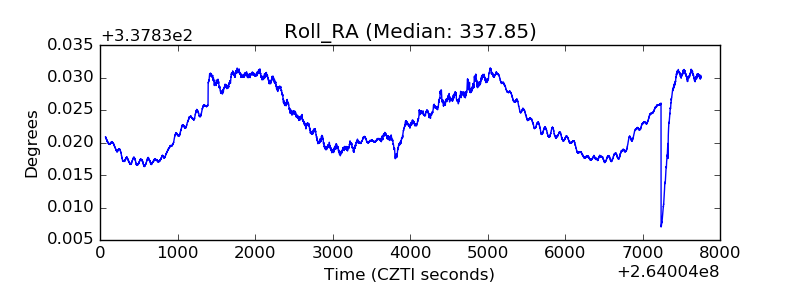 |
| Veto Counter |  |