| Param | Original file | Final file |
|---|---|---|
| Filename | modeM0/AS1C03_022T01_9000002098_14204cztM0_level2.evt | modeM0/AS1C03_022T01_9000002098_14204cztM0_level2_quad_clean.evt |
| Size (bytes) | 602,435,520 | 78,295,680 |
| Size | 574.5 MB | 74.7 MB |
| Events in quadrant A | 3,623,723 | 484,253 |
| Events in quadrant B | 4,954,335 | 474,965 |
| Events in quadrant C | 3,664,831 | 459,927 |
| Events in quadrant D | 5,520,034 | 456,781 |
| Mode M9 | |||
|---|---|---|---|
| Quadrant | BADHDUFLAG | Total packets | Discarded packets |
| A | 0 | 3 | 0 |
| B | 0 | 3 | 0 |
| C | 0 | 3 | 0 |
| D | 0 | 3 | 0 |
| Mode M0 | |||
|---|---|---|---|
| Quadrant | BADHDUFLAG | Total packets | Discarded packets |
| A | 0 | 14960 | 2 |
| B | 0 | 19304 | 1 |
| C | 0 | 14972 | 1 |
| D | 0 | 21140 | 1 |
| Mode SS | |||
|---|---|---|---|
| Quadrant | BADHDUFLAG | Total packets | Discarded packets |
| A | 0 | 144 | 0 |
| B | 0 | 144 | 0 |
| C | 0 | 144 | 0 |
| D | 0 | 144 | 0 |
| Quadrant | Total seconds | Saturated seconds | Saturation percentage |
|---|---|---|---|
| A | 7108 | 73 | 1.027012% |
| B | 7108 | 708 | 9.960608% |
| C | 7108 | 67 | 0.942600% |
| D | 7108 | 761 | 10.706246% |
Noise dominated data is calculated using 1-second bins in cleaned event files. If a bin has >2000 counts, and if more than 50% of those come from <1% of pixels, then it is considered to be noise-dominated and hence unusable.
| Quadrant | # 1 sec bins | Bins with >0 counts | Bins with >2000 counts | High rate bins dominated by noise | Noise dominated (total time) | Noise dominated (detector-on time) | Marked lightcurve |
|---|---|---|---|---|---|---|---|
| A | 7434 | 7110 | 1 | 1 | 0.01% | 0.01% | 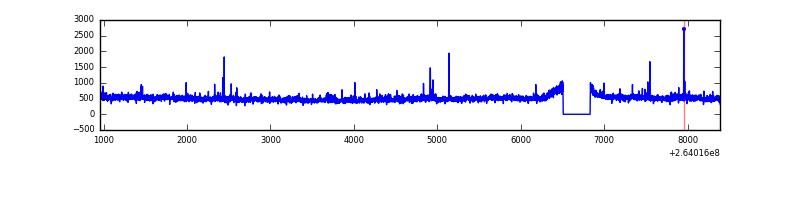 |
| B | 7434 | 7110 | 351 | 351 | 4.72% | 4.94% | 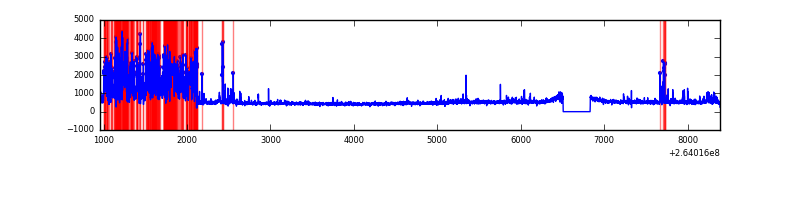 |
| C | 7434 | 7110 | 0 | 0 | 0.00% | 0.00% | 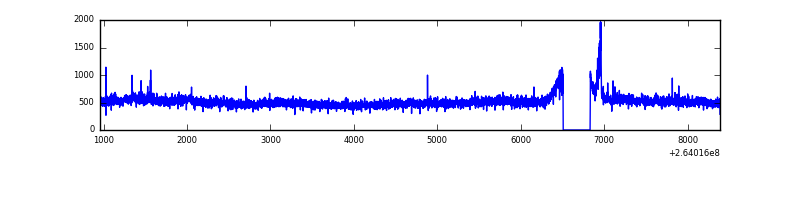 |
| D | 7434 | 7110 | 504 | 504 | 6.78% | 7.09% | 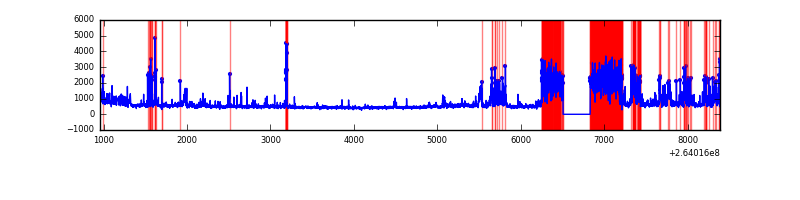 |
Top three noisy pixels from each quadrant. If the there are fewer than three noisy pixels in the level2.evt file, extra rows are filled as -1
| Pixel properties | Quadrant properties | ||||||
|---|---|---|---|---|---|---|---|
| Quadrant | DetID | PixID | Counts | Sigma | Mean | Median | Sigma |
| A | 8 | 15 | 167662 | 932.29 | 872 | 854 | 178.9 |
| A | 12 | 189 | 61070 | 336.55 | 872 | 854 | 178.9 |
| A | 15 | 69 | 16381 | 86.78 | 872 | 854 | 178.9 |
| B | 0 | 182 | 1297175 | 8069.6 | 830 | 810 | 160.6 |
| B | 4 | 142 | 164343 | 1017.96 | 830 | 810 | 160.6 |
| B | 15 | 185 | 40088 | 244.5 | 830 | 810 | 160.6 |
| C | 3 | 233 | 384825 | 1998.02 | 830 | 833 | 192.2 |
| C | 0 | 207 | 43354 | 221.25 | 830 | 833 | 192.2 |
| C | 13 | 61 | 6109 | 27.45 | 830 | 833 | 192.2 |
| D | 13 | 122 | 1240812 | 6501.02 | 783 | 763 | 190.7 |
| D | 8 | 195 | 242846 | 1269.13 | 783 | 763 | 190.7 |
| D | 5 | 222 | 229703 | 1200.23 | 783 | 763 | 190.7 |
Histogram calculated using DETX and DETY for each event in the final _common_clean file
| Quadrant A |  |
 |
Quadrant B |
|---|---|---|---|
| Quadrant D |  |
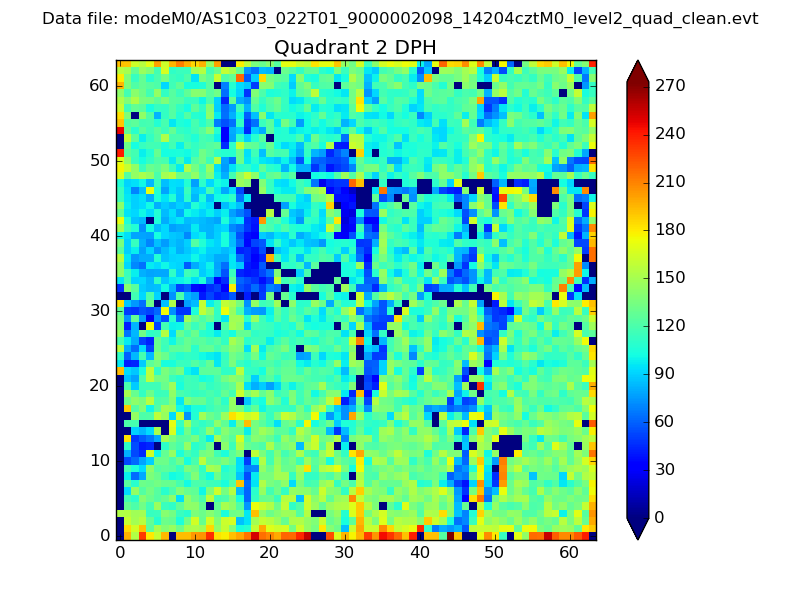 |
Quadrant C |
| Plot type | Count rate plots | Images |
|---|---|---|
| Comparison with Poisson distribution Blue bars denote a histogram of data divided into 1 sec bins. Red curve is a Poisson curve with rate = median count rate of data. |
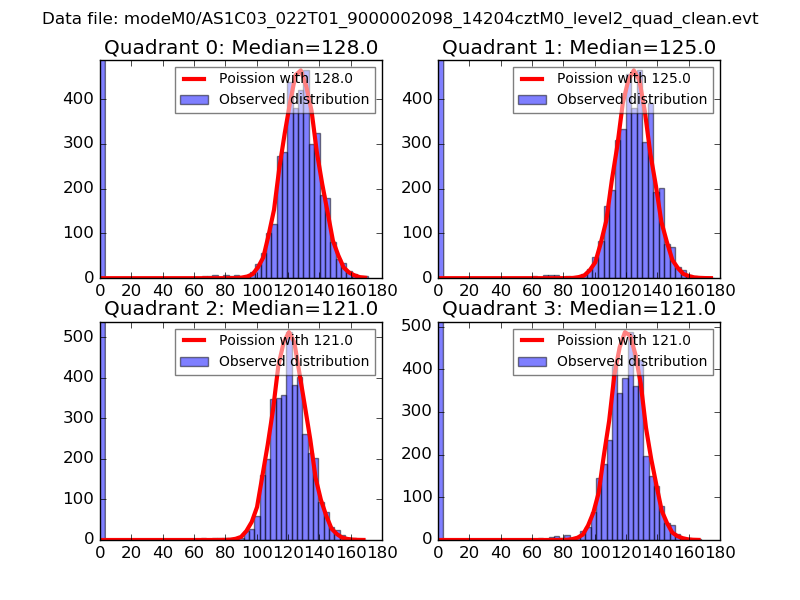 |
 |
| Quadrant-wise count rates Data is divided into 100 sec bins |
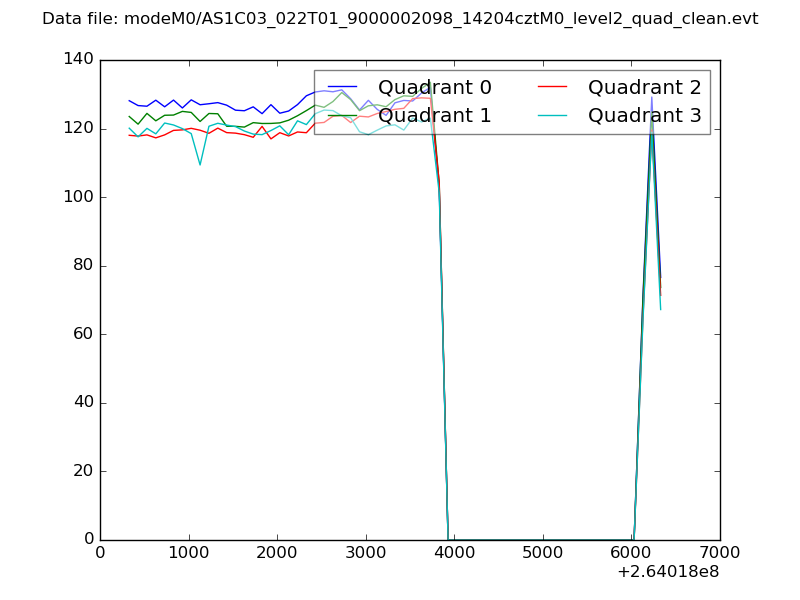 |
|
| Module-wise count rates for Quadrant A Data is divided into 100 sec bins |
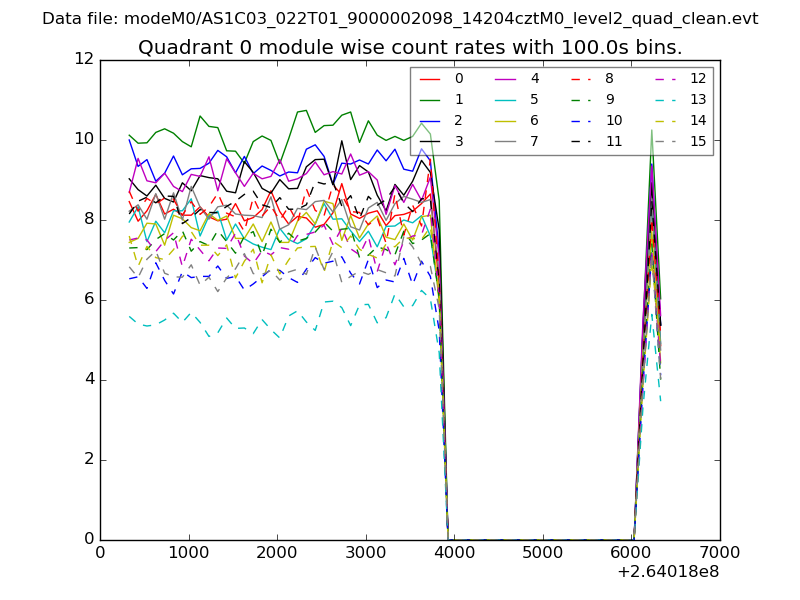 |
 |
| Module-wise count rates for Quadrant B Data is divided into 100 sec bins |
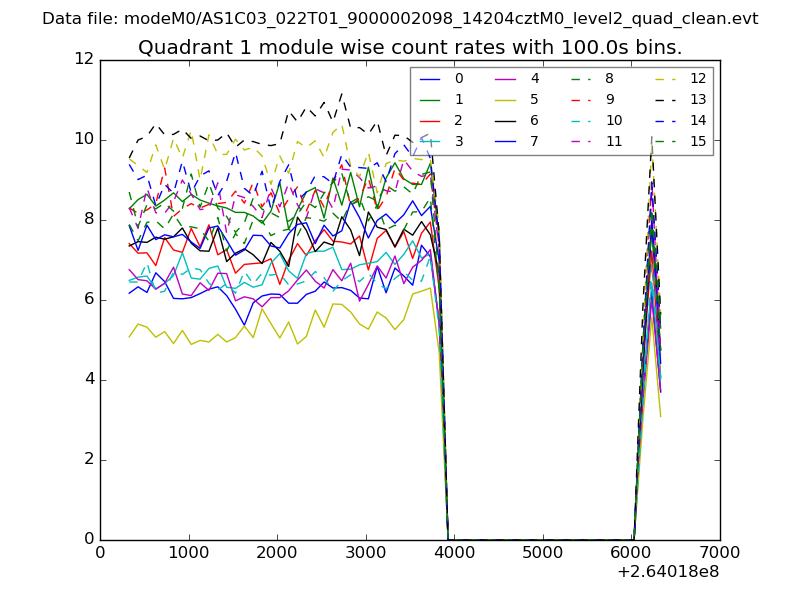 |
 |
| Module-wise count rates for Quadrant C Data is divided into 100 sec bins |
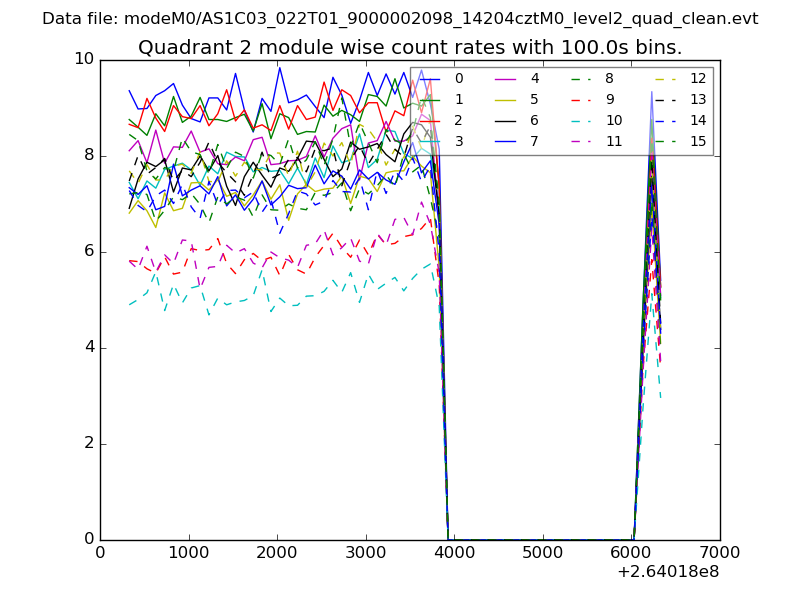 |
 |
| Module-wise count rates for Quadrant D Data is divided into 100 sec bins |
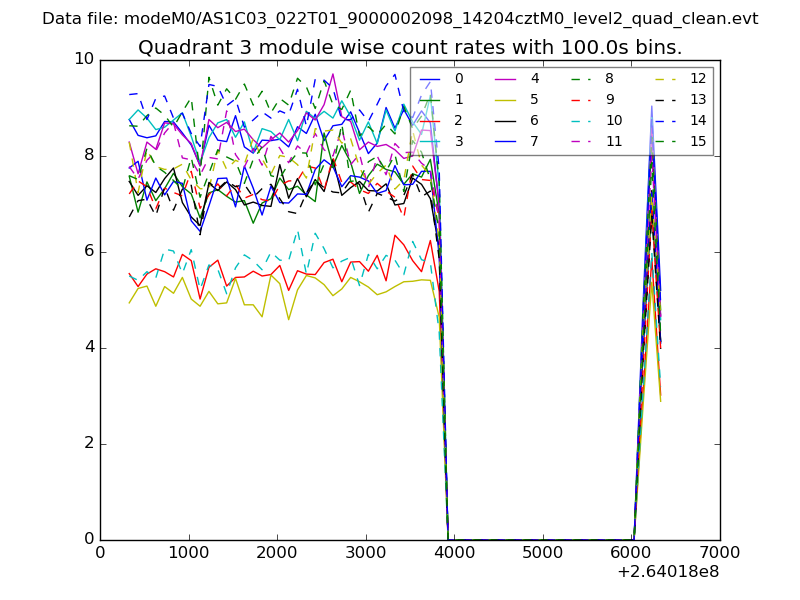 |
 |
| Parameter | Plot |
|---|---|
| CZT HV Monitor | 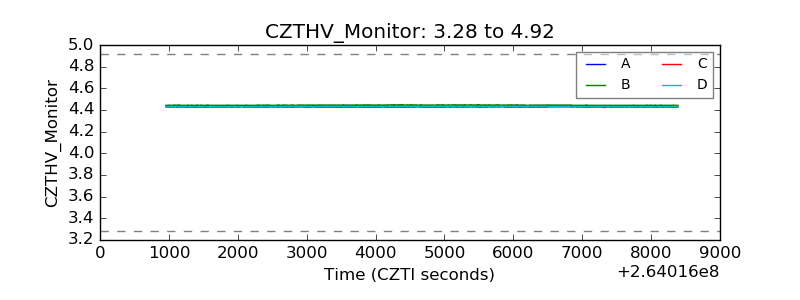 |
| D_VDD | 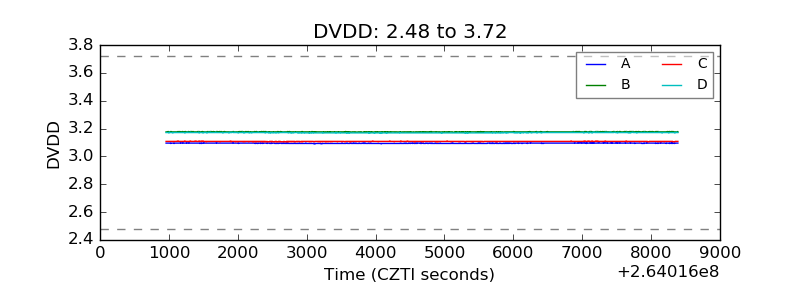 |
| Temperature 1 | 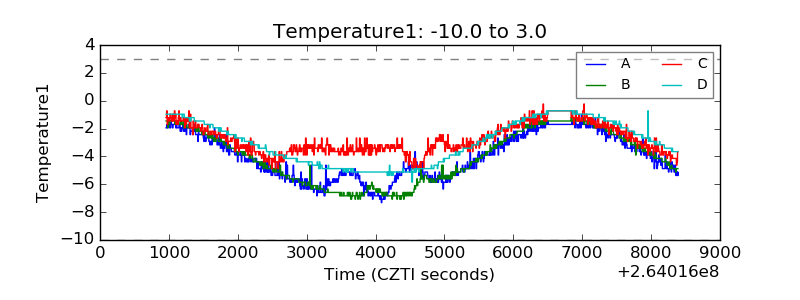 |
| Veto HV Monitor | 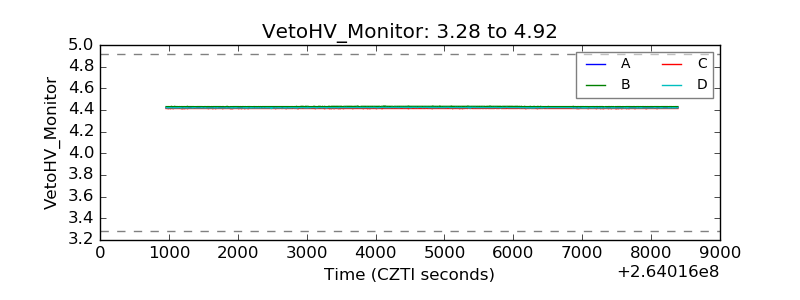 |
| Veto LLD | 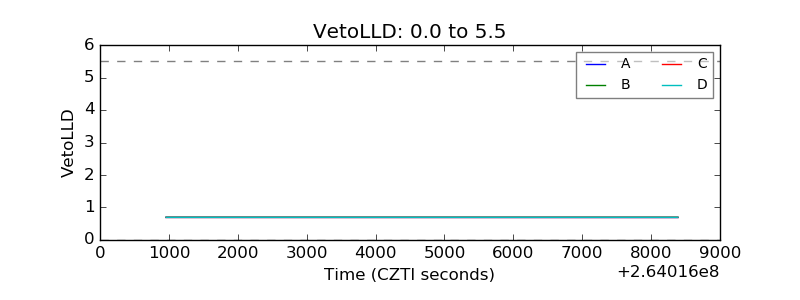 |
| Alpha Counter | 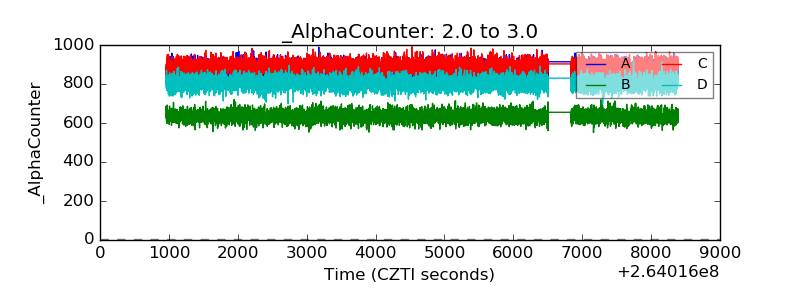 |
| _CPM_Rate | 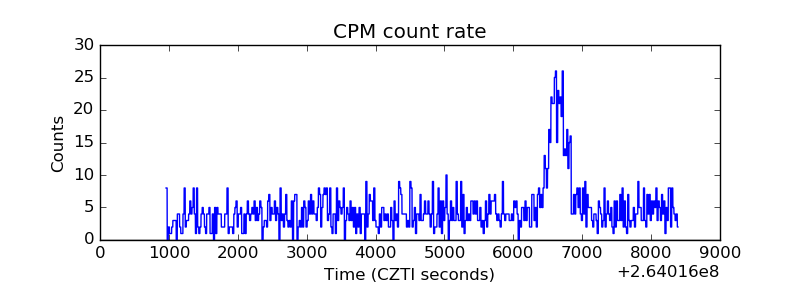 |
| CZT Counter |  |
| +2.5 Volts monitor |  |
| +5 Volts monitor |  |
| _ROLL_ROT | 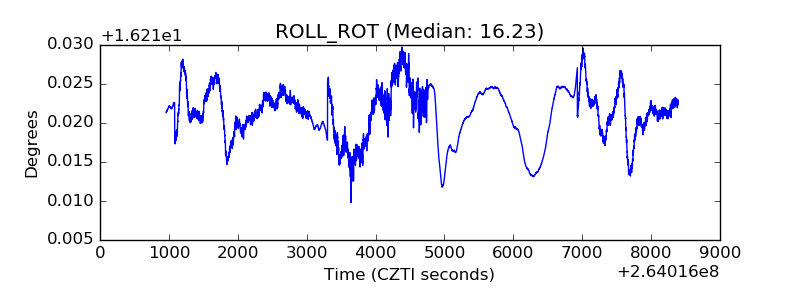 |
| _Roll_DEC | 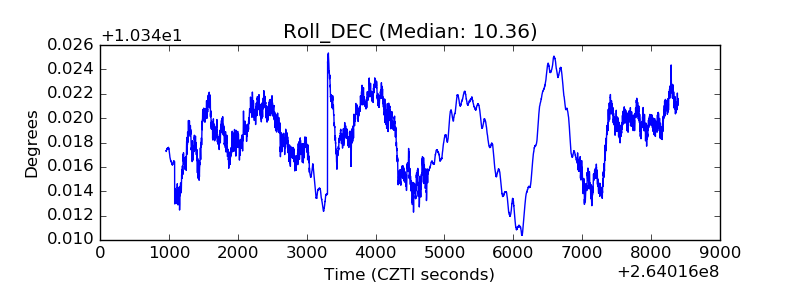 |
| _Roll_RA | 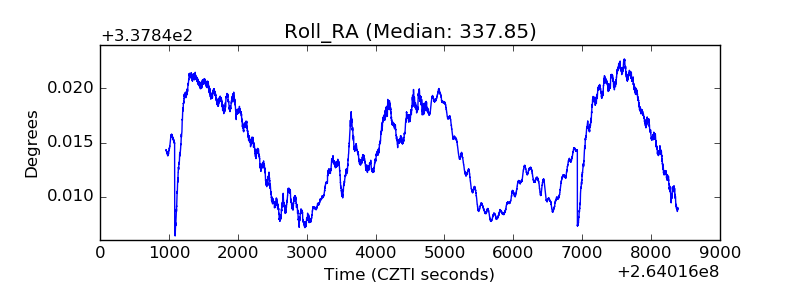 |
| Veto Counter | 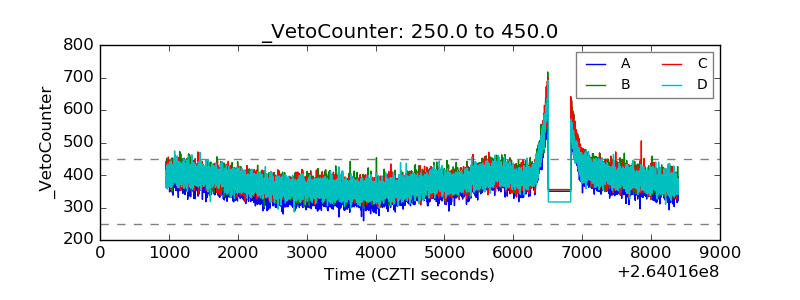 |