| Param | Original file | Final file |
|---|---|---|
| Filename | modeM0/AS1C03_022T01_9000002098_14205cztM0_level2.evt | modeM0/AS1C03_022T01_9000002098_14205cztM0_level2_quad_clean.evt |
| Size (bytes) | 665,179,200 | 84,867,840 |
| Size | 634.4 MB | 80.9 MB |
| Events in quadrant A | 3,770,333 | 537,395 |
| Events in quadrant B | 3,890,174 | 526,851 |
| Events in quadrant C | 3,591,554 | 511,024 |
| Events in quadrant D | 8,398,534 | 486,252 |
| Mode M9 | |||
|---|---|---|---|
| Quadrant | BADHDUFLAG | Total packets | Discarded packets |
| A | 0 | 4 | 0 |
| B | 0 | 4 | 0 |
| C | 0 | 4 | 0 |
| D | 0 | 4 | 0 |
| Mode M0 | |||
|---|---|---|---|
| Quadrant | BADHDUFLAG | Total packets | Discarded packets |
| A | 0 | 15628 | 2 |
| B | 0 | 16241 | 1 |
| C | 0 | 15065 | 1 |
| D | 0 | 30007 | 1 |
| Mode SS | |||
|---|---|---|---|
| Quadrant | BADHDUFLAG | Total packets | Discarded packets |
| A | 0 | 148 | 0 |
| B | 0 | 148 | 0 |
| C | 0 | 148 | 0 |
| D | 0 | 148 | 0 |
| Quadrant | Total seconds | Saturated seconds | Saturation percentage |
|---|---|---|---|
| A | 7294 | 40 | 0.548396% |
| B | 7294 | 111 | 1.521799% |
| C | 7294 | 32 | 0.438717% |
| D | 7294 | 1598 | 21.908418% |
Noise dominated data is calculated using 1-second bins in cleaned event files. If a bin has >2000 counts, and if more than 50% of those come from <1% of pixels, then it is considered to be noise-dominated and hence unusable.
| Quadrant | # 1 sec bins | Bins with >0 counts | Bins with >2000 counts | High rate bins dominated by noise | Noise dominated (total time) | Noise dominated (detector-on time) | Marked lightcurve |
|---|---|---|---|---|---|---|---|
| A | 7730 | 7296 | 2 | 2 | 0.03% | 0.03% | 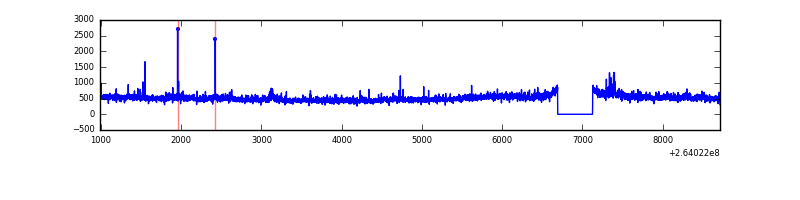 |
| B | 7730 | 7296 | 31 | 31 | 0.40% | 0.42% | 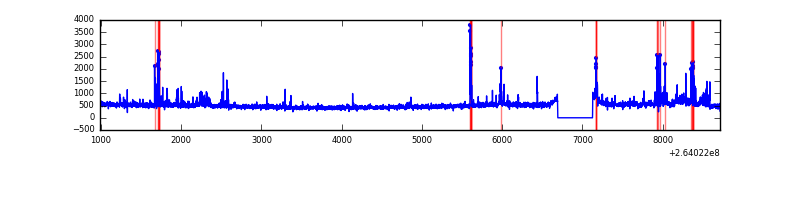 |
| C | 7730 | 7296 | 0 | 0 | 0.00% | 0.00% | 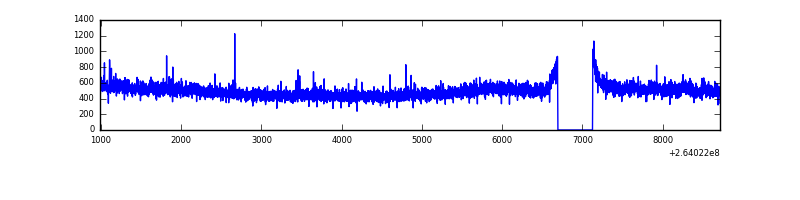 |
| D | 7730 | 7296 | 1180 | 1180 | 15.27% | 16.17% | 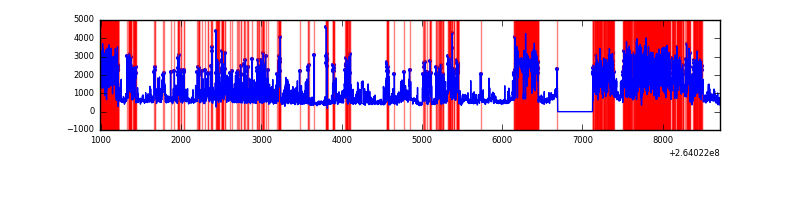 |
Top three noisy pixels from each quadrant. If the there are fewer than three noisy pixels in the level2.evt file, extra rows are filled as -1
| Pixel properties | Quadrant properties | ||||||
|---|---|---|---|---|---|---|---|
| Quadrant | DetID | PixID | Counts | Sigma | Mean | Median | Sigma |
| A | 8 | 15 | 236604 | 1284.9 | 889 | 867 | 183.5 |
| A | 12 | 189 | 64784 | 348.38 | 889 | 867 | 183.5 |
| A | 8 | 4 | 21648 | 113.27 | 889 | 867 | 183.5 |
| B | 0 | 85 | 142488 | 836.02 | 878 | 856 | 169.4 |
| B | 0 | 182 | 96131 | 562.38 | 878 | 856 | 169.4 |
| B | 4 | 97 | 47332 | 274.34 | 878 | 856 | 169.4 |
| C | 3 | 233 | 281464 | 1426.45 | 848 | 853 | 196.7 |
| C | 13 | 61 | 6101 | 26.68 | 848 | 853 | 196.7 |
| C | 0 | 207 | 4554 | 18.81 | 848 | 853 | 196.7 |
| D | 13 | 122 | 2121158 | 11215.81 | 772 | 752 | 189.1 |
| D | 10 | 157 | 1294202 | 6841.66 | 772 | 752 | 189.1 |
| D | 5 | 222 | 863217 | 4561.98 | 772 | 752 | 189.1 |
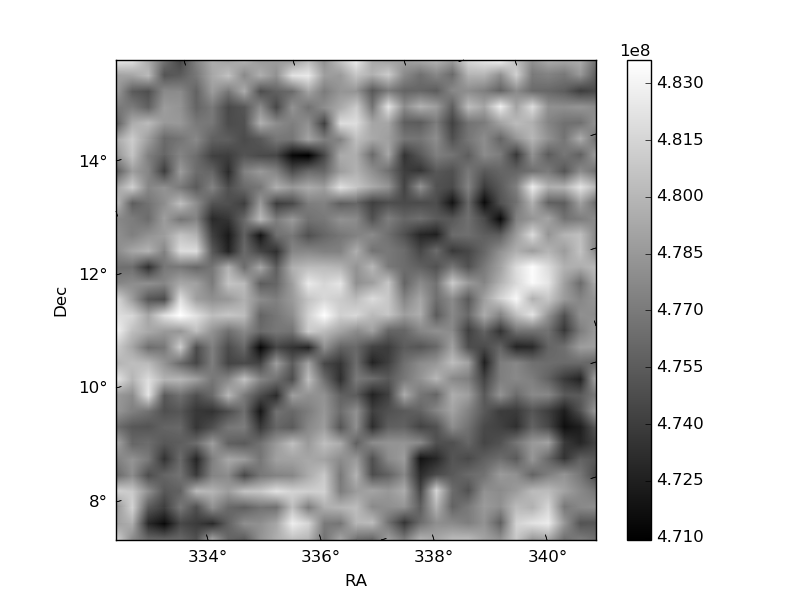
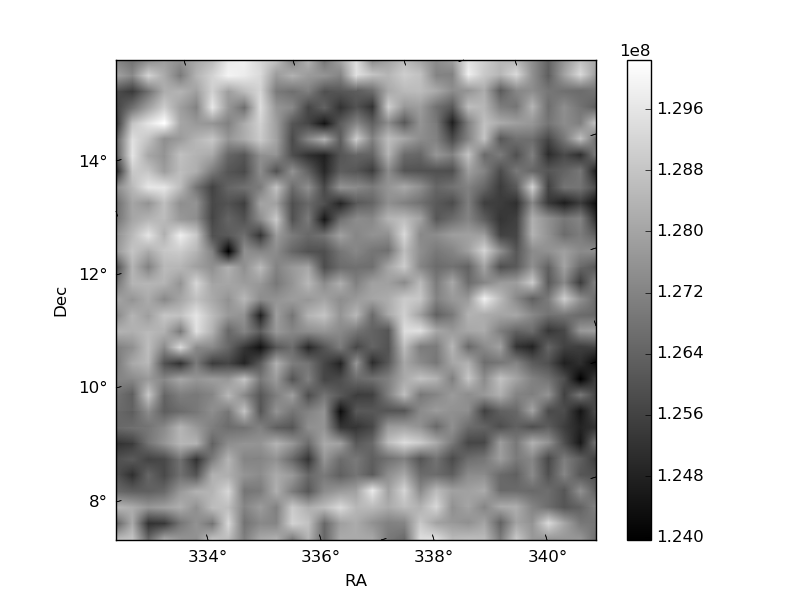
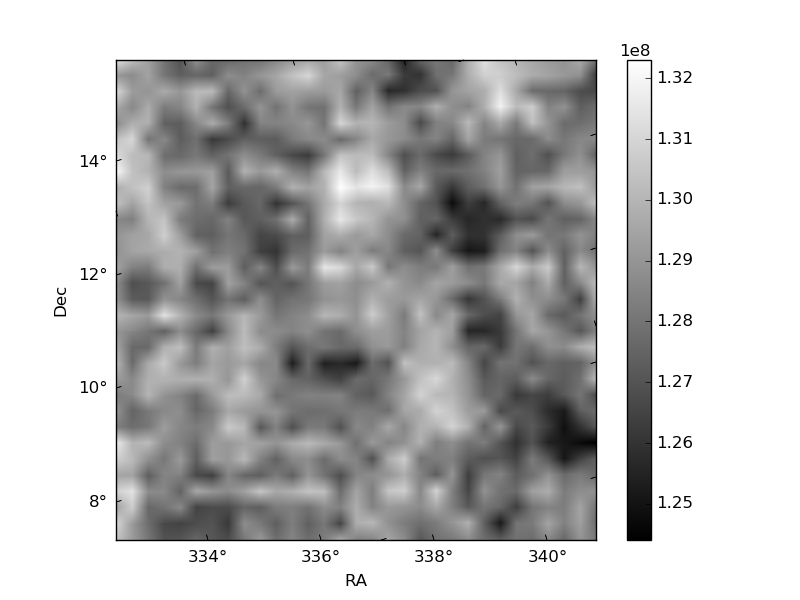
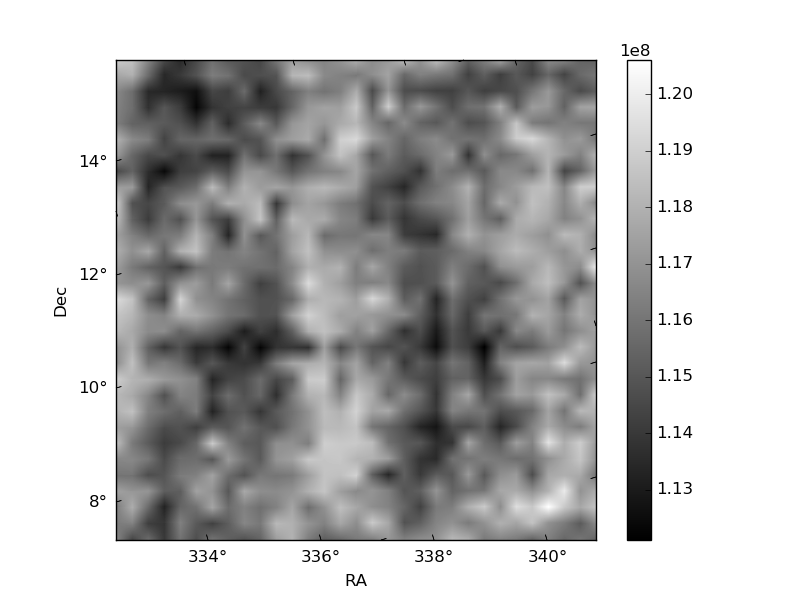
Histogram calculated using DETX and DETY for each event in the final _common_clean file
| Quadrant A | 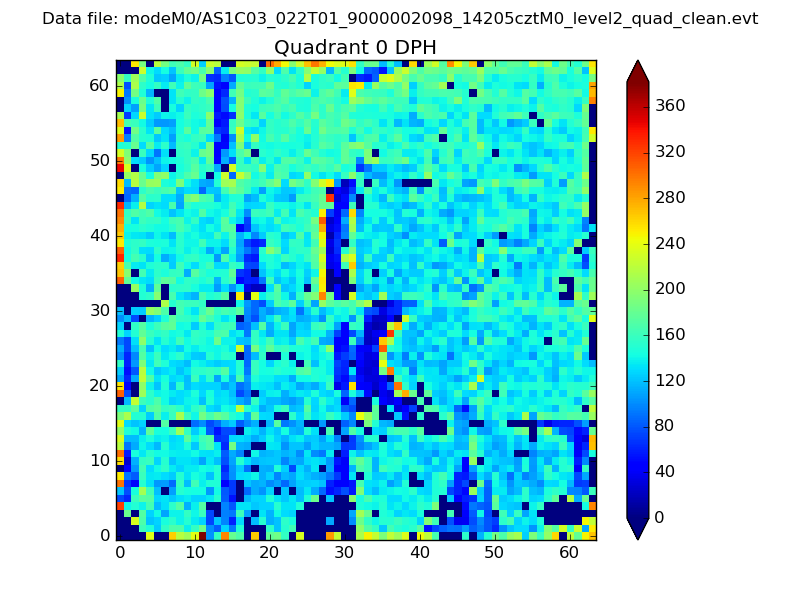 |
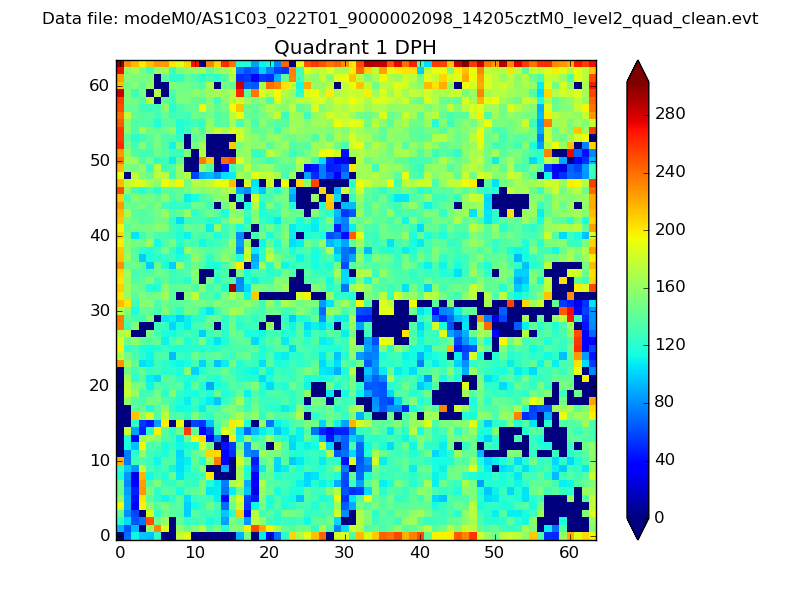 |
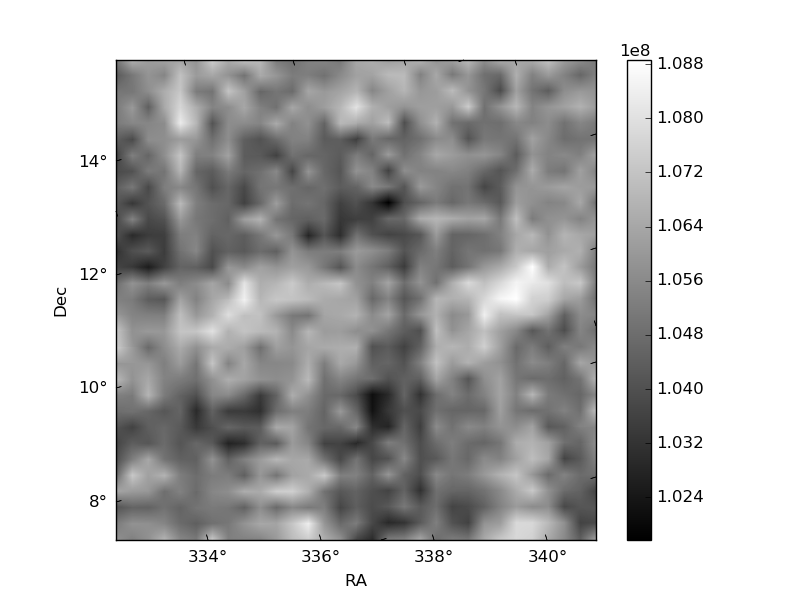
Quadrant B |
|---|---|---|---|
| Quadrant D | 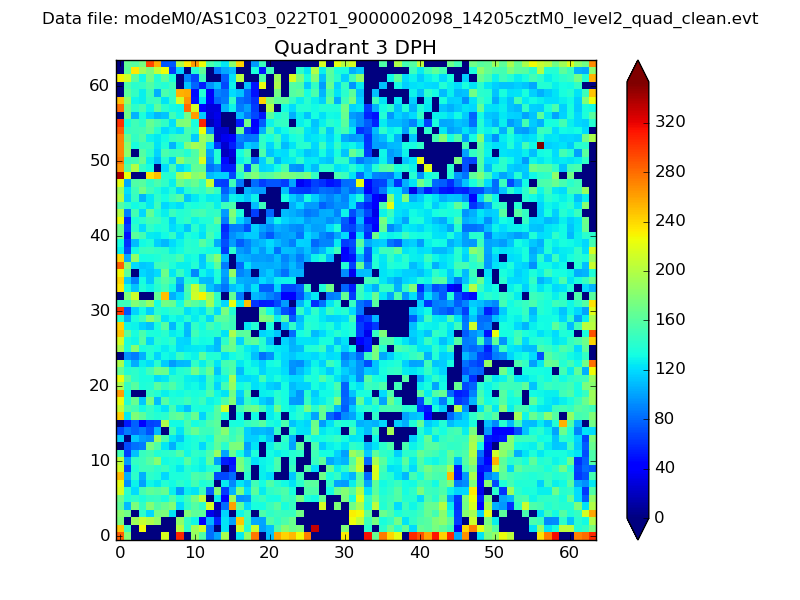 |
 |
Quadrant C |
| Plot type | Count rate plots | Images |
|---|---|---|
| Comparison with Poisson distribution Blue bars denote a histogram of data divided into 1 sec bins. Red curve is a Poisson curve with rate = median count rate of data. |
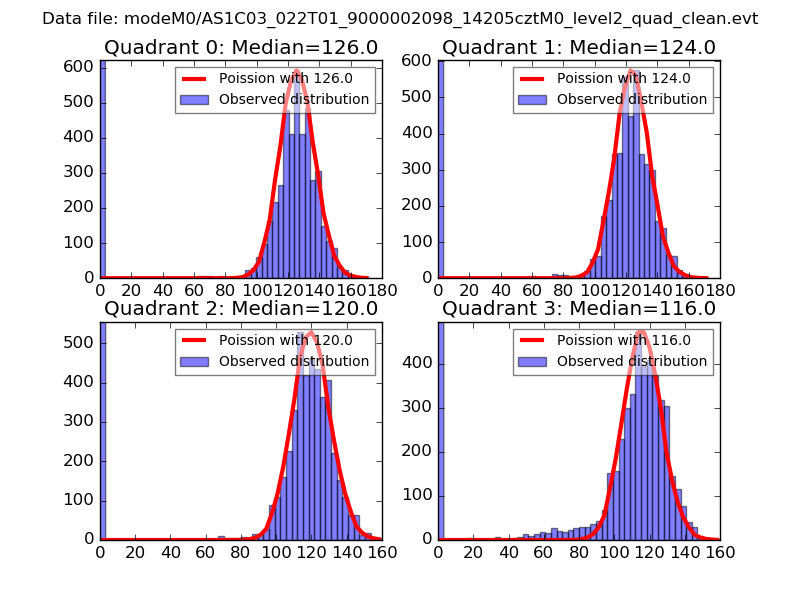 |
 |
| Quadrant-wise count rates Data is divided into 100 sec bins |
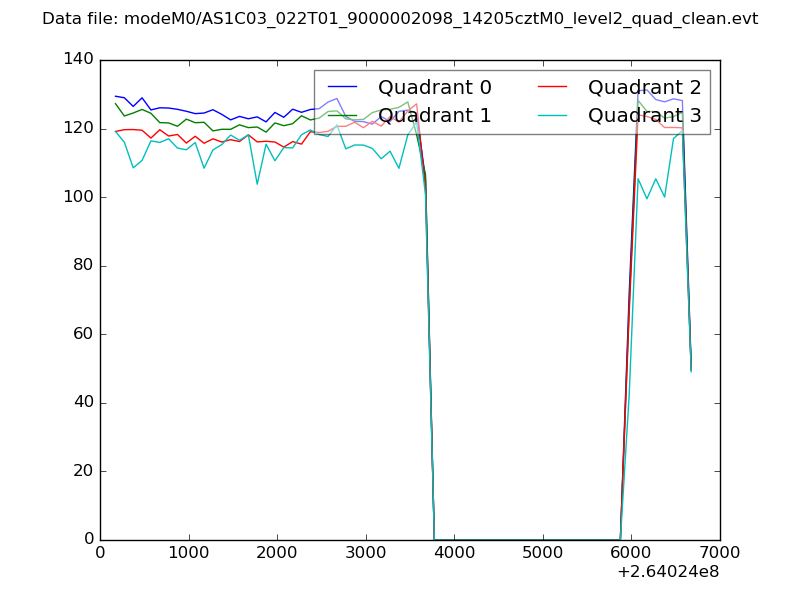 |
|
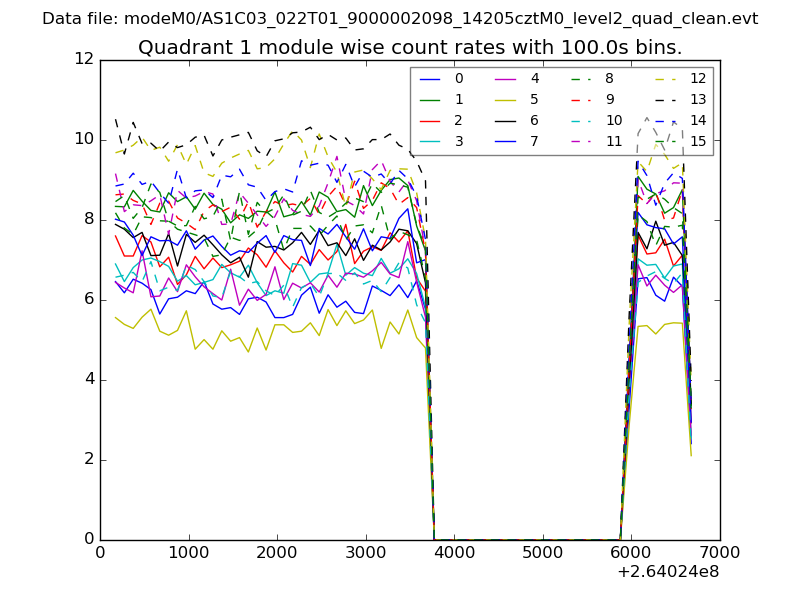
| Module-wise count rates for Quadrant A Data is divided into 100 sec bins |
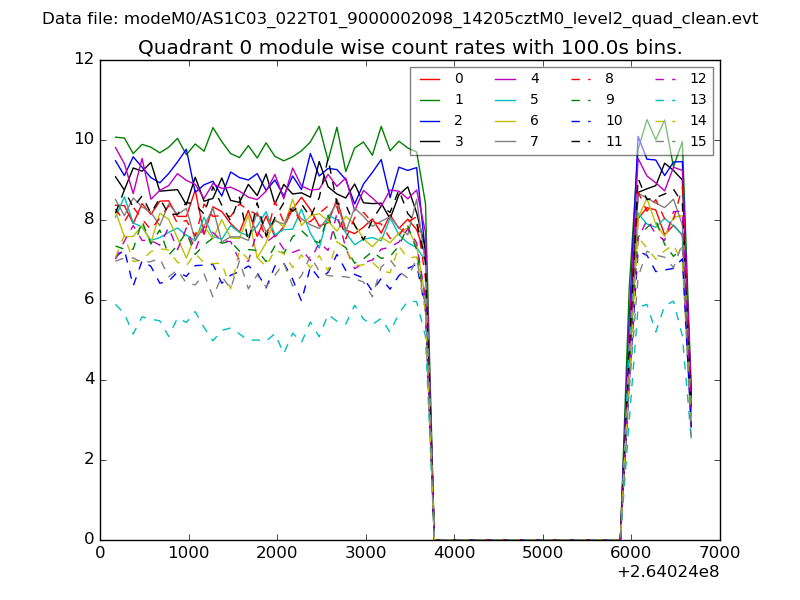 |
 |
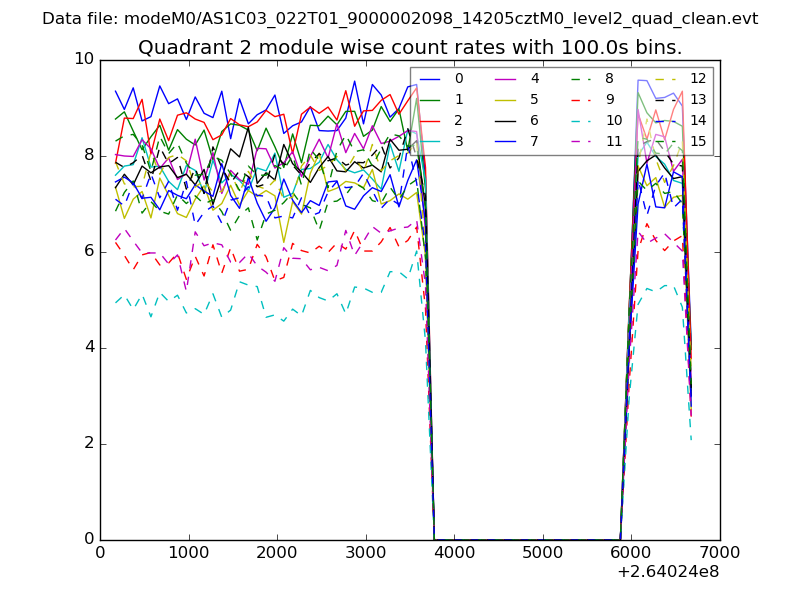
| Module-wise count rates for Quadrant B Data is divided into 100 sec bins |
 |
 |
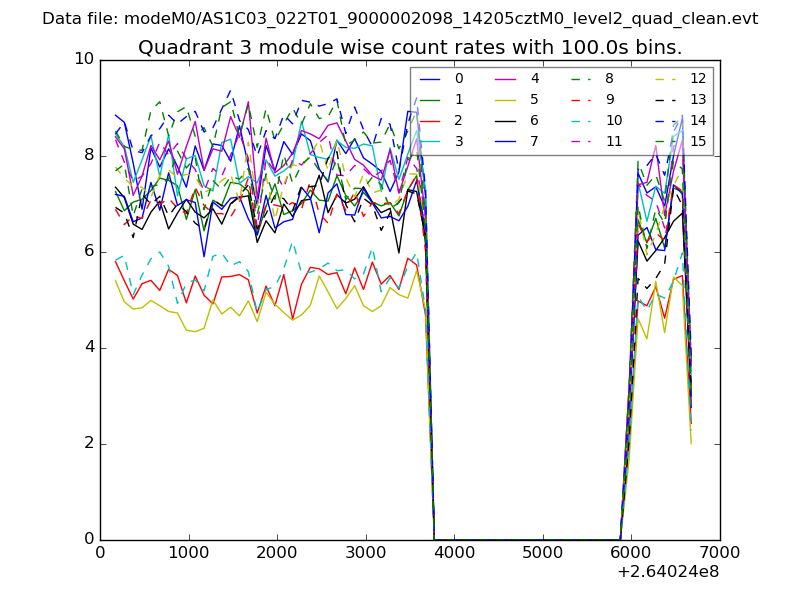
| Module-wise count rates for Quadrant C Data is divided into 100 sec bins |
 |
 |
| Module-wise count rates for Quadrant D Data is divided into 100 sec bins |
 |
 |
| Parameter | Plot |
|---|---|
| CZT HV Monitor | 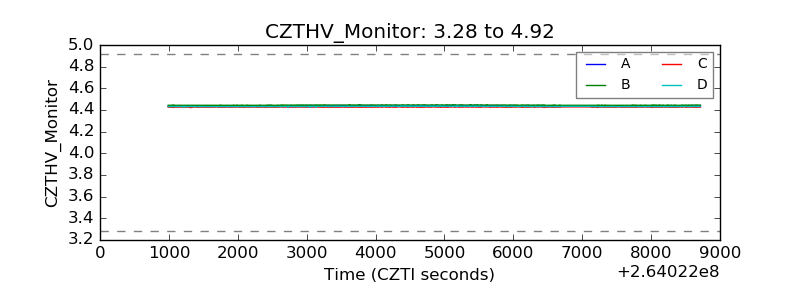 |
| D_VDD | 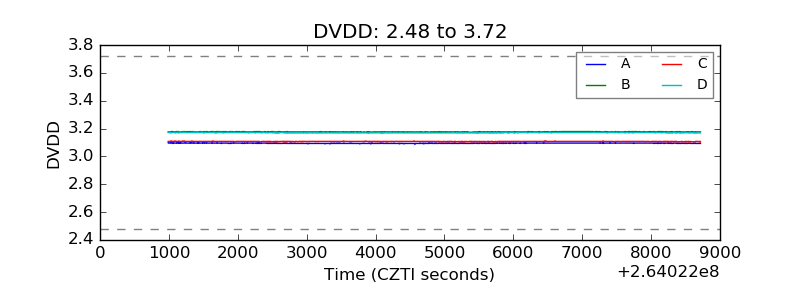 |
| Temperature 1 |  |
| Veto HV Monitor | 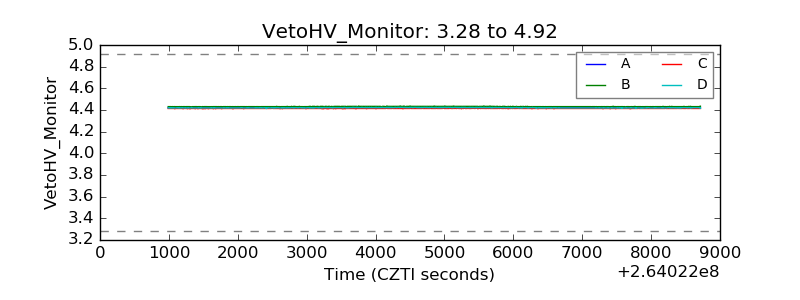 |
| Veto LLD | 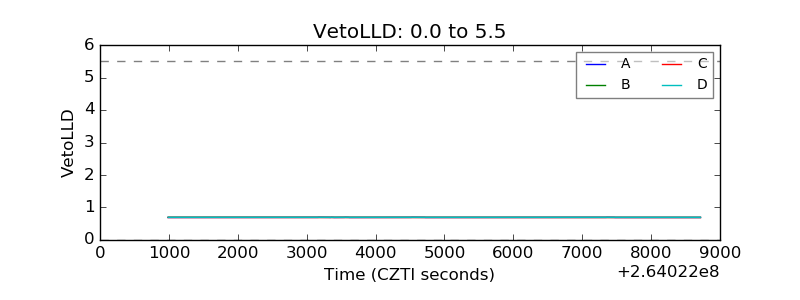 |
| Alpha Counter | 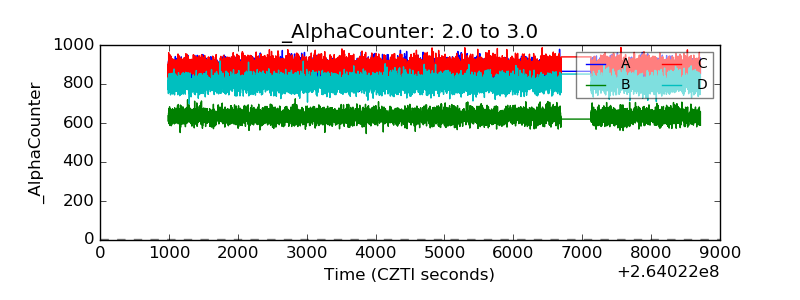 |
| _CPM_Rate | 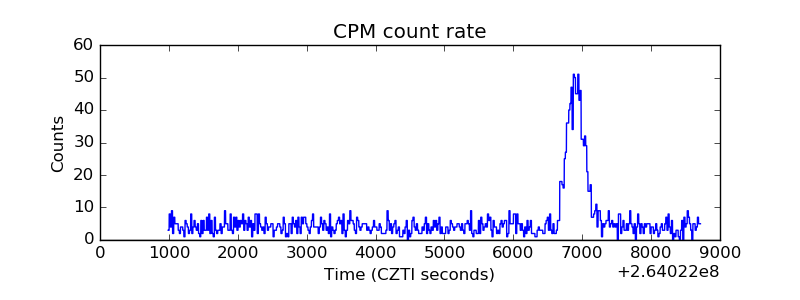 |
| CZT Counter | 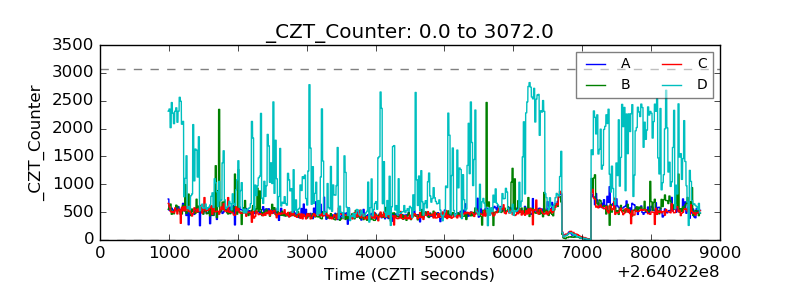 |
| +2.5 Volts monitor |  |
| +5 Volts monitor |  |
| _ROLL_ROT | 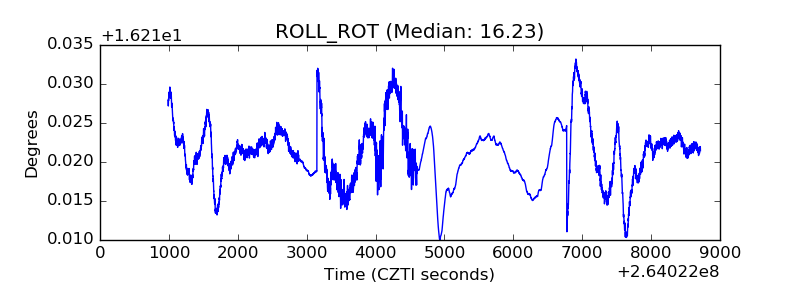 |
| _Roll_DEC | 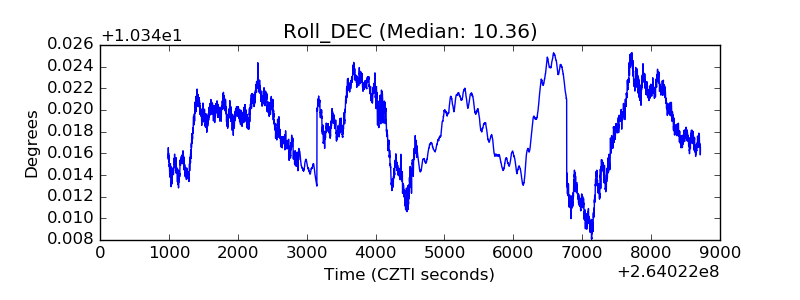 |
| _Roll_RA | 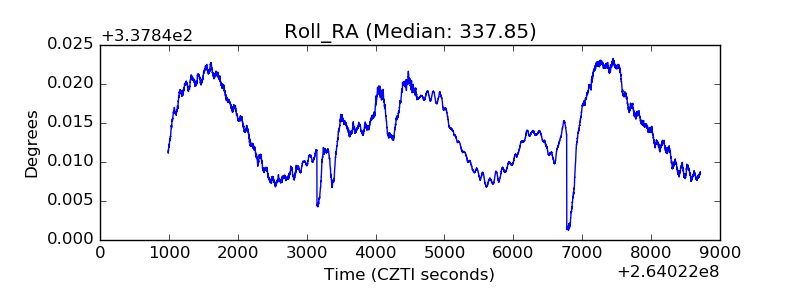 |
| Veto Counter | 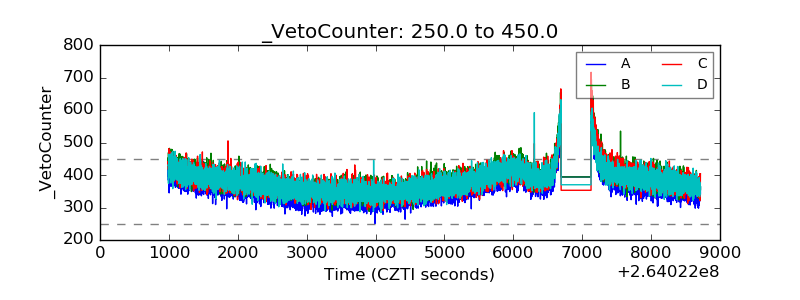 |