| Param | Original file | Final file |
|---|---|---|
| Filename | modeM0/AS1C03_022T01_9000002098_14207cztM0_level2.evt | modeM0/AS1C03_022T01_9000002098_14207cztM0_level2_quad_clean.evt |
| Size (bytes) | 1,168,289,280 | 164,640,960 |
| Size | 1.1 GB | 157.0 MB |
| Events in quadrant A | 6,552,347 | 1,096,412 |
| Events in quadrant B | 6,869,497 | 1,077,937 |
| Events in quadrant C | 6,305,255 | 1,045,890 |
| Events in quadrant D | 14,787,085 | 876,813 |
| Mode M9 | |||
|---|---|---|---|
| Quadrant | BADHDUFLAG | Total packets | Discarded packets |
| A | 0 | 14 | 0 |
| B | 0 | 14 | 0 |
| C | 0 | 14 | 0 |
| D | 0 | 15 | 0 |
| Mode M0 | |||
|---|---|---|---|
| Quadrant | BADHDUFLAG | Total packets | Discarded packets |
| A | 0 | 27841 | 4 |
| B | 0 | 28983 | 3 |
| C | 0 | 26632 | 3 |
| D | 0 | 52867 | 3 |
| Mode SS | |||
|---|---|---|---|
| Quadrant | BADHDUFLAG | Total packets | Discarded packets |
| A | 0 | 260 | 0 |
| B | 0 | 260 | 0 |
| C | 0 | 260 | 0 |
| D | 0 | 260 | 0 |
| Quadrant | Total seconds | Saturated seconds | Saturation percentage |
|---|---|---|---|
| A | 12859 | 73 | 0.567696% |
| B | 12859 | 184 | 1.430904% |
| C | 12859 | 37 | 0.287736% |
| D | 12859 | 2893 | 22.497861% |
Noise dominated data is calculated using 1-second bins in cleaned event files. If a bin has >2000 counts, and if more than 50% of those come from <1% of pixels, then it is considered to be noise-dominated and hence unusable.
| Quadrant | # 1 sec bins | Bins with >0 counts | Bins with >2000 counts | High rate bins dominated by noise | Noise dominated (total time) | Noise dominated (detector-on time) | Marked lightcurve |
|---|---|---|---|---|---|---|---|
| A | 14190 | 12862 | 10 | 10 | 0.07% | 0.08% | 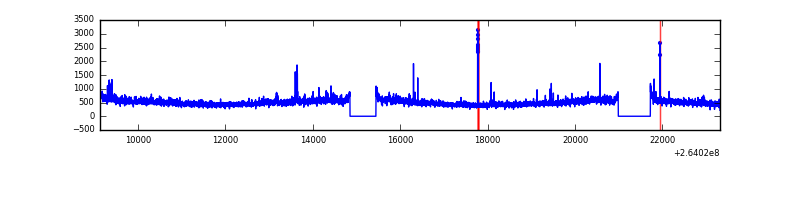 |
| B | 14190 | 12862 | 52 | 52 | 0.37% | 0.40% | 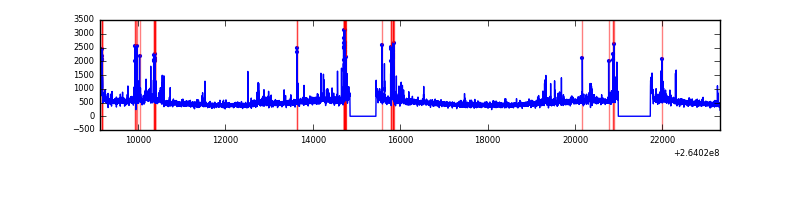 |
| C | 14190 | 12862 | 0 | 0 | 0.00% | 0.00% | 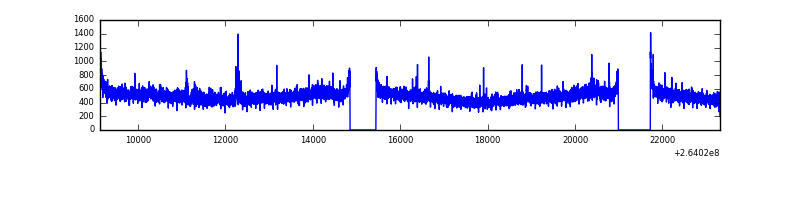 |
| D | 14189 | 12861 | 2327 | 2327 | 16.40% | 18.09% | 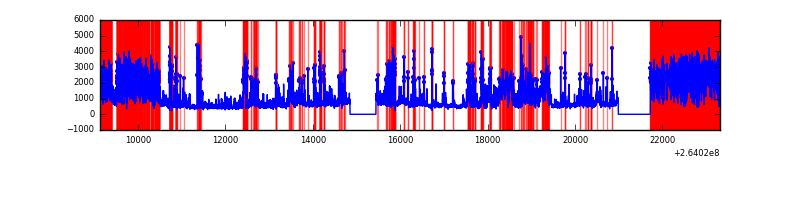 |
Top three noisy pixels from each quadrant. If the there are fewer than three noisy pixels in the level2.evt file, extra rows are filled as -1
| Pixel properties | Quadrant properties | ||||||
|---|---|---|---|---|---|---|---|
| Quadrant | DetID | PixID | Counts | Sigma | Mean | Median | Sigma |
| A | 8 | 15 | 340489 | 1068.44 | 1549 | 1514 | 317.3 |
| A | 12 | 189 | 139667 | 435.46 | 1549 | 1514 | 317.3 |
| A | 9 | 143 | 79258 | 245.05 | 1549 | 1514 | 317.3 |
| B | 0 | 182 | 220867 | 743.03 | 1539 | 1503 | 295.2 |
| B | 0 | 85 | 164406 | 551.79 | 1539 | 1503 | 295.2 |
| B | 4 | 97 | 138960 | 465.6 | 1539 | 1503 | 295.2 |
| C | 3 | 233 | 500342 | 1441.05 | 1486 | 1492 | 346.2 |
| C | 13 | 61 | 10743 | 26.72 | 1486 | 1492 | 346.2 |
| C | 0 | 207 | 9597 | 23.41 | 1486 | 1492 | 346.2 |
| D | 13 | 122 | 4616513 | 14466.68 | 1320 | 1291 | 319.0 |
| D | 10 | 157 | 1634183 | 5118.4 | 1320 | 1291 | 319.0 |
| D | 5 | 222 | 1257649 | 3938.13 | 1320 | 1291 | 319.0 |
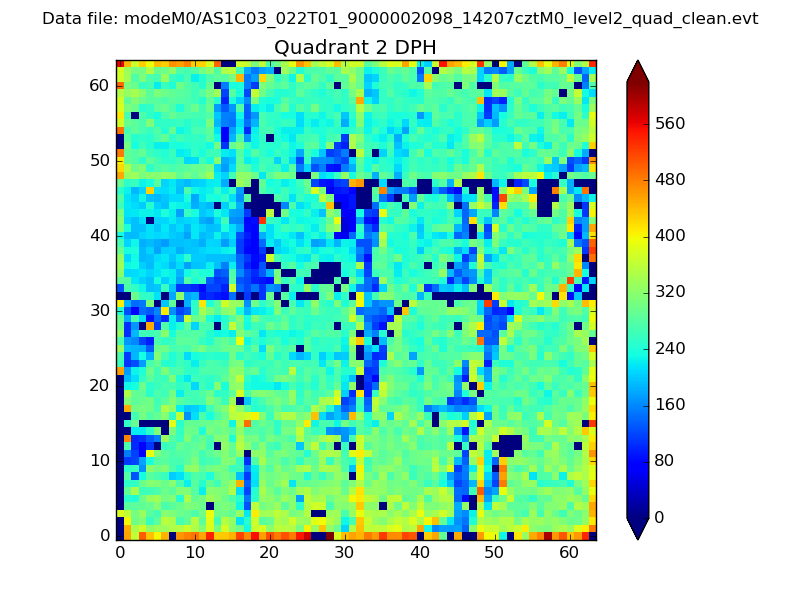
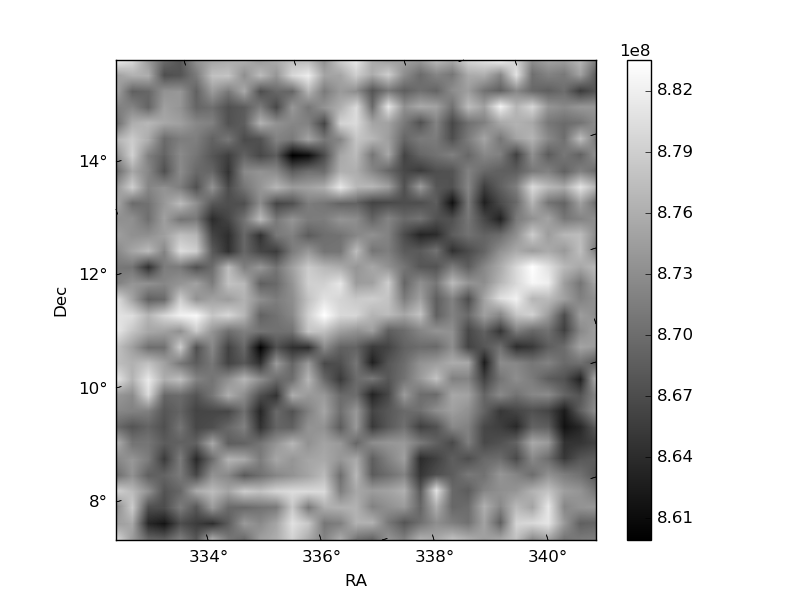
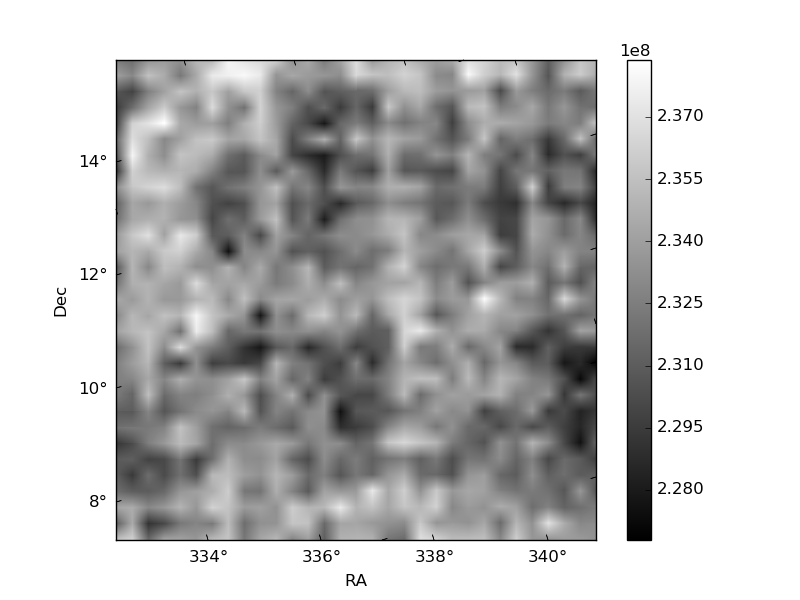
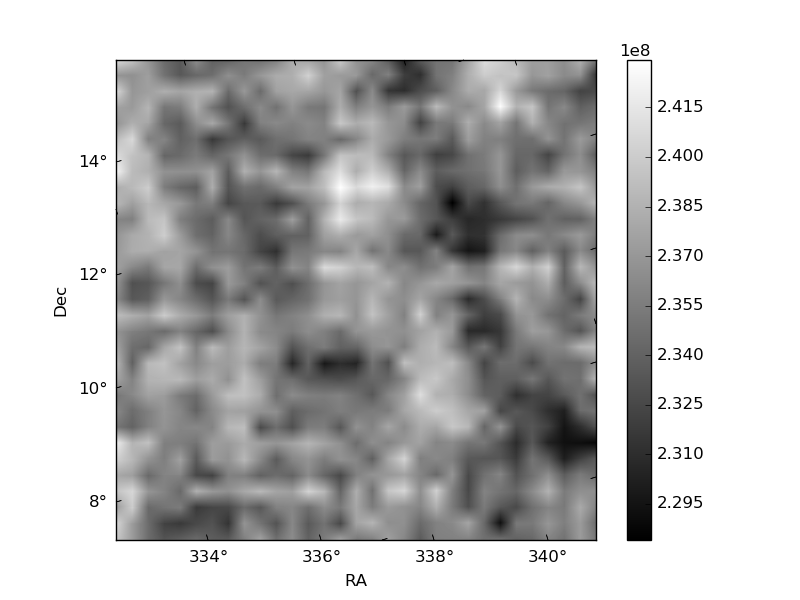
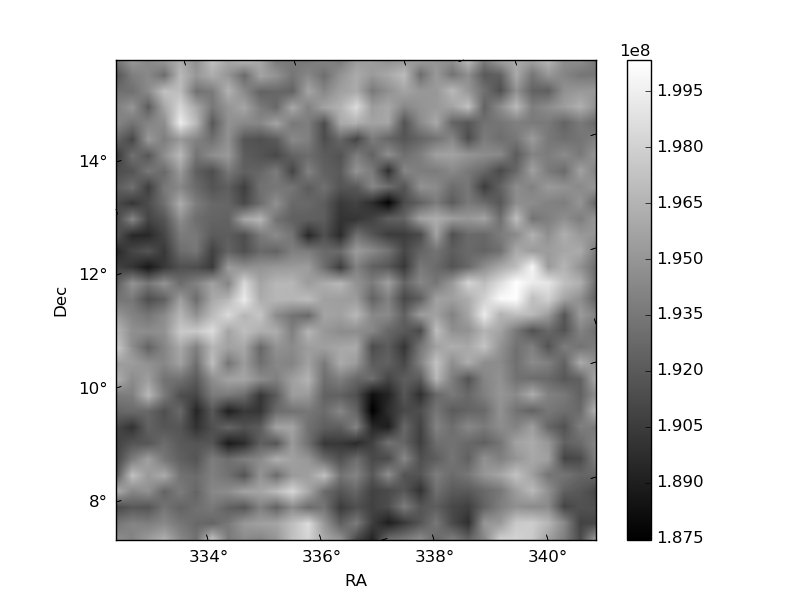
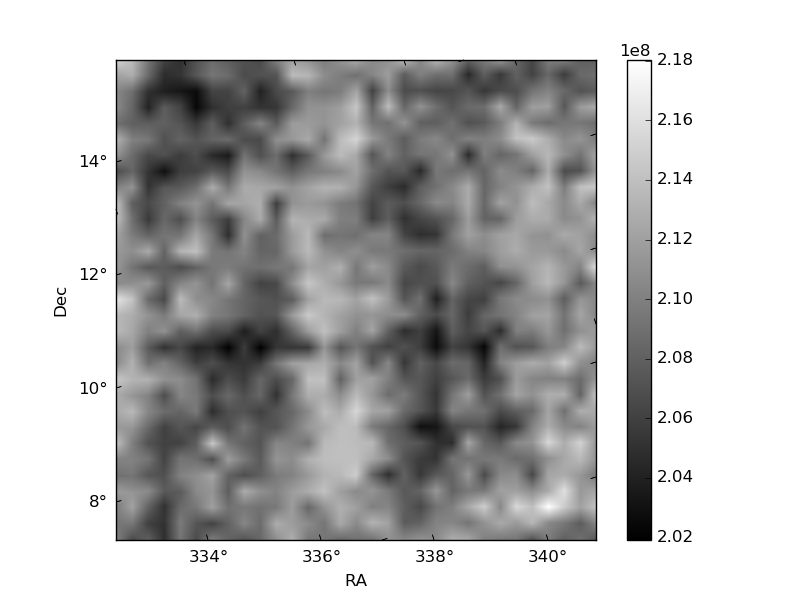
Histogram calculated using DETX and DETY for each event in the final _common_clean file
| Quadrant A | 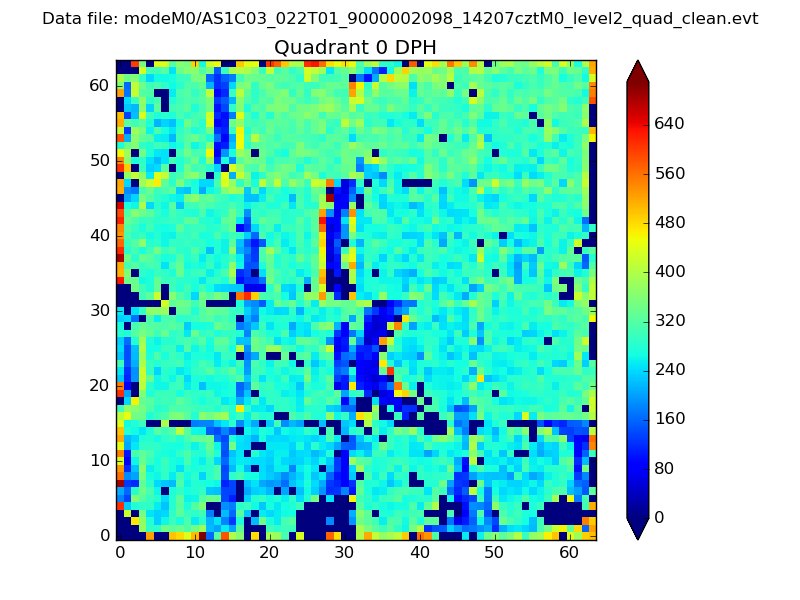 |
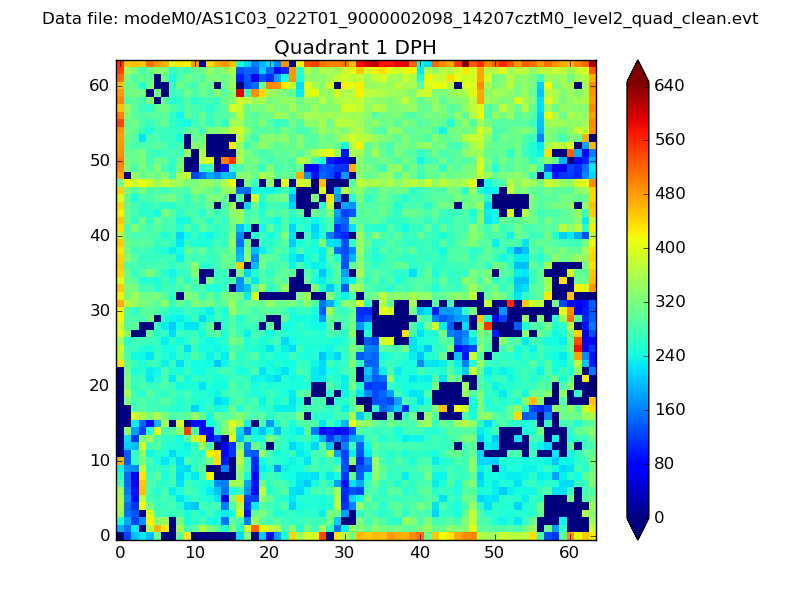 |
Quadrant B |
|---|---|---|---|
| Quadrant D | 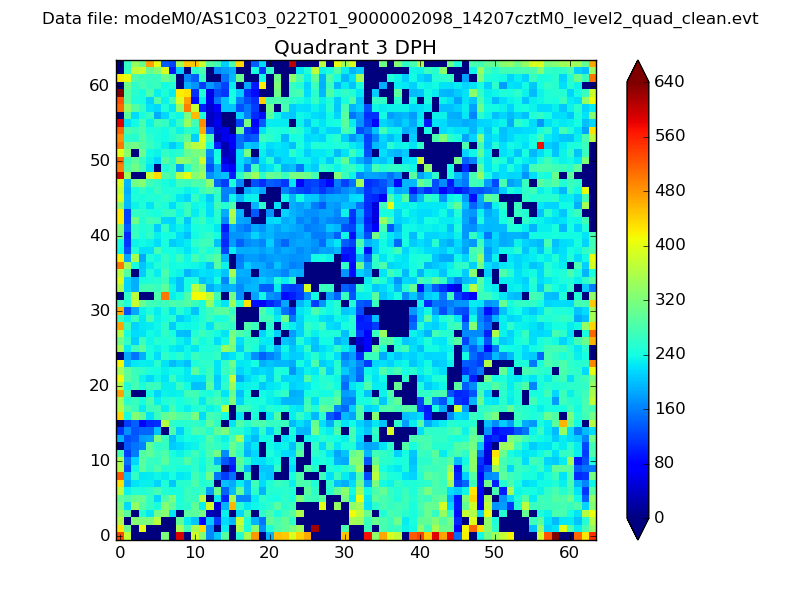 |
 |
Quadrant C |
| Plot type | Count rate plots | Images |
|---|---|---|
| Comparison with Poisson distribution Blue bars denote a histogram of data divided into 1 sec bins. Red curve is a Poisson curve with rate = median count rate of data. |
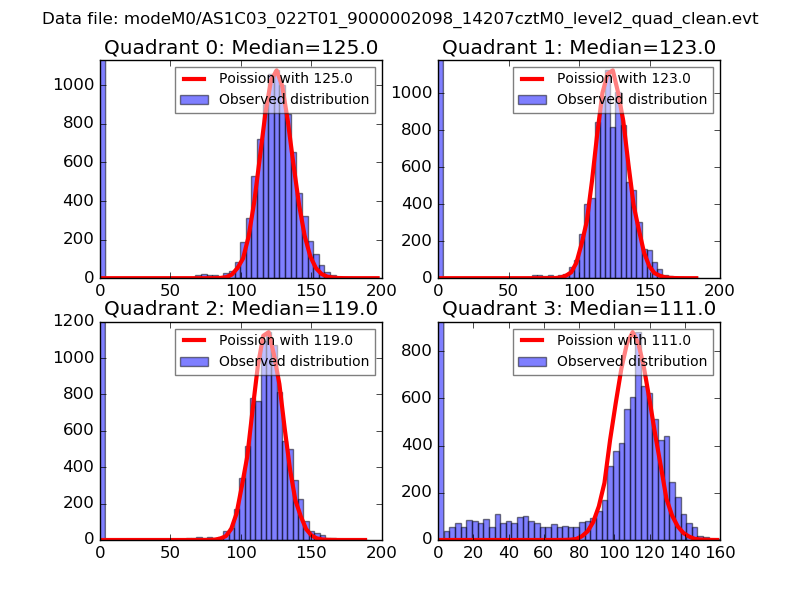 |
 |
| Quadrant-wise count rates Data is divided into 100 sec bins |
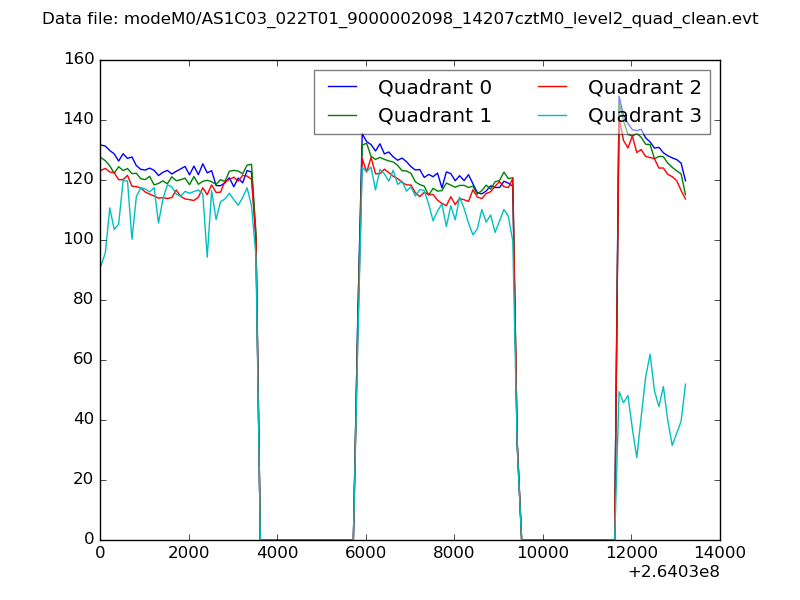 |
|
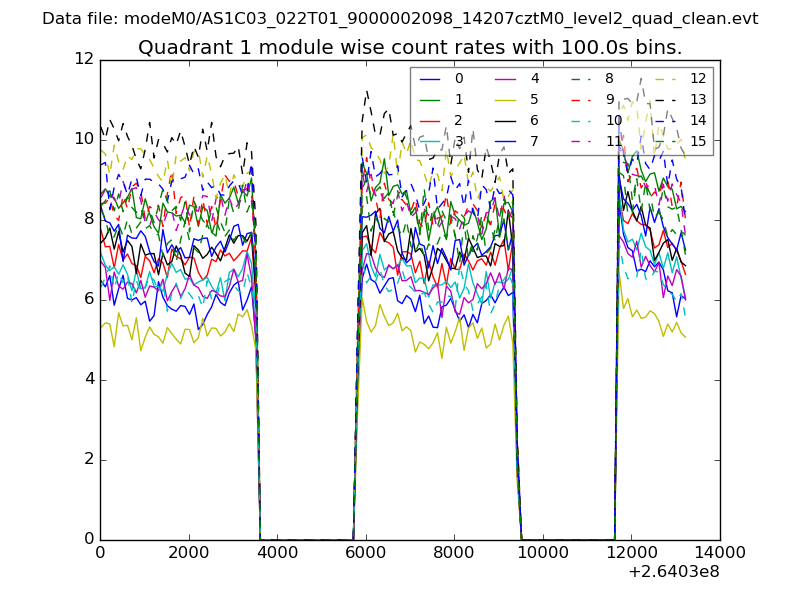
| Module-wise count rates for Quadrant A Data is divided into 100 sec bins |
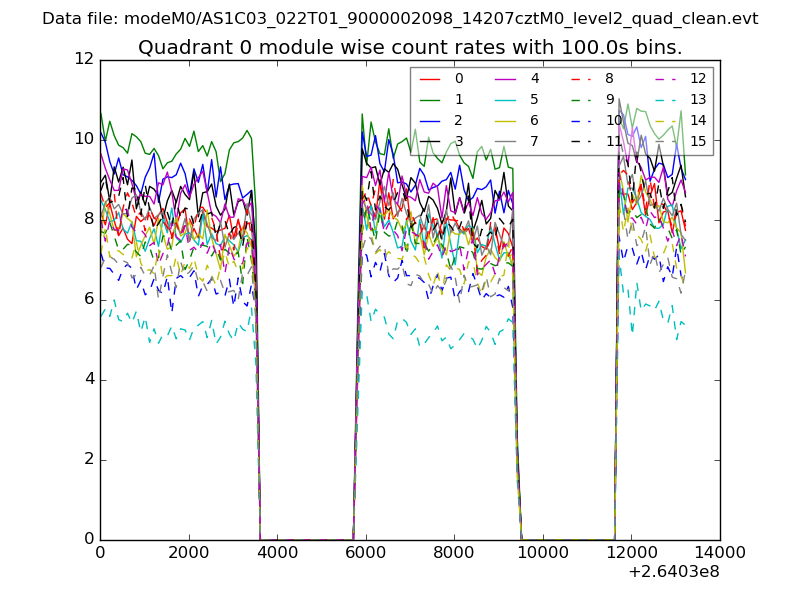 |
 |
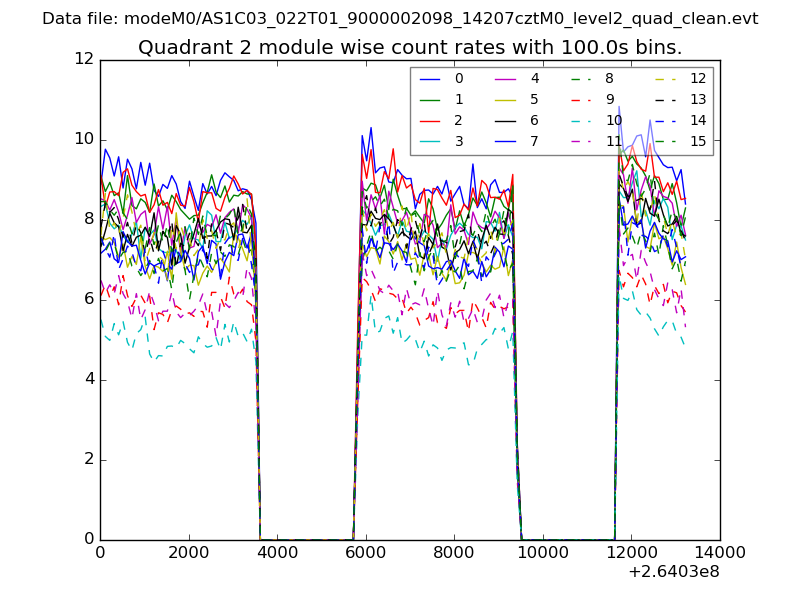
| Module-wise count rates for Quadrant B Data is divided into 100 sec bins |
 |
 |
| Module-wise count rates for Quadrant C Data is divided into 100 sec bins |
 |
 |
| Module-wise count rates for Quadrant D Data is divided into 100 sec bins |
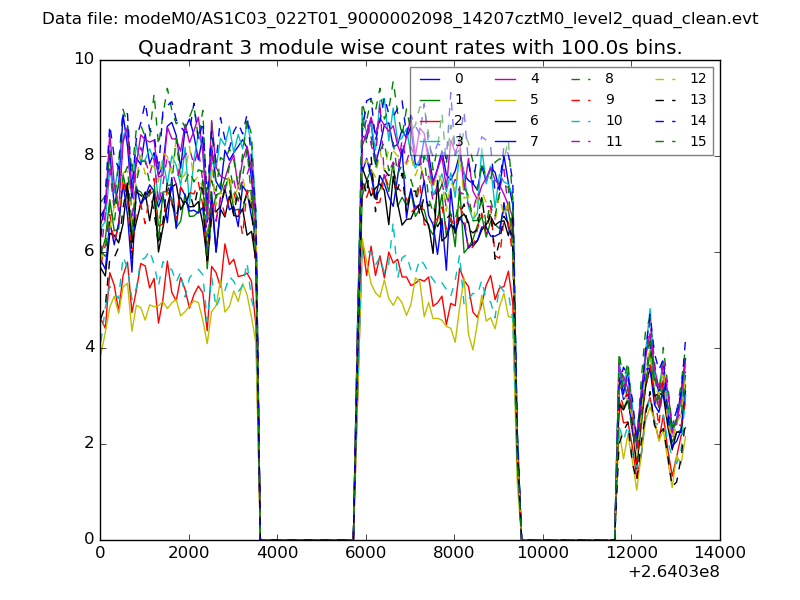 |
 |
| Parameter | Plot |
|---|---|
| CZT HV Monitor | 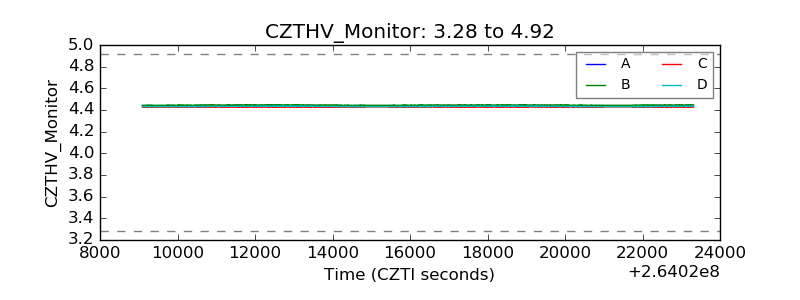 |
| D_VDD |  |
| Temperature 1 | 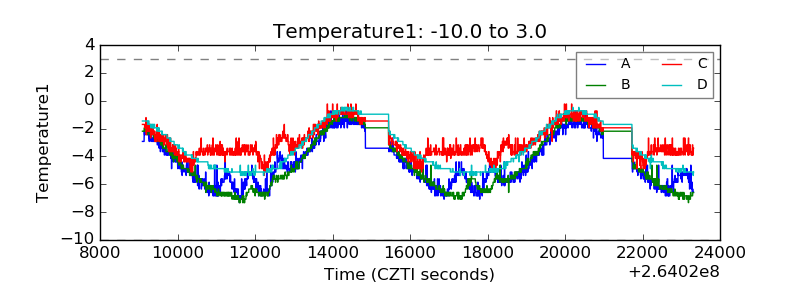 |
| Veto HV Monitor |  |
| Veto LLD | 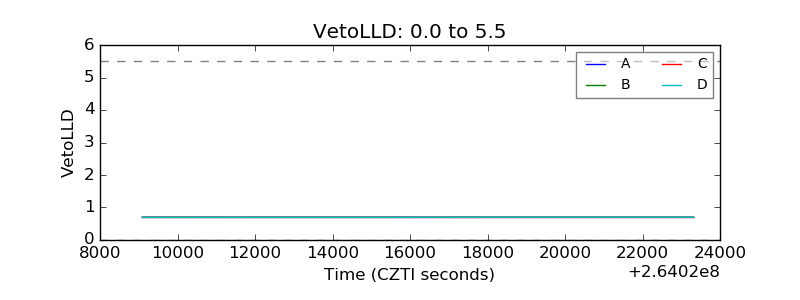 |
| Alpha Counter | 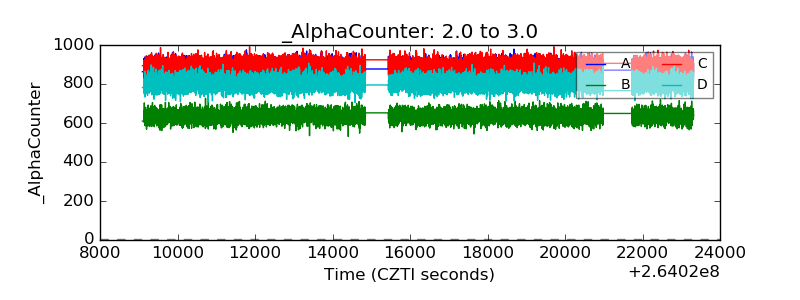 |
| _CPM_Rate | 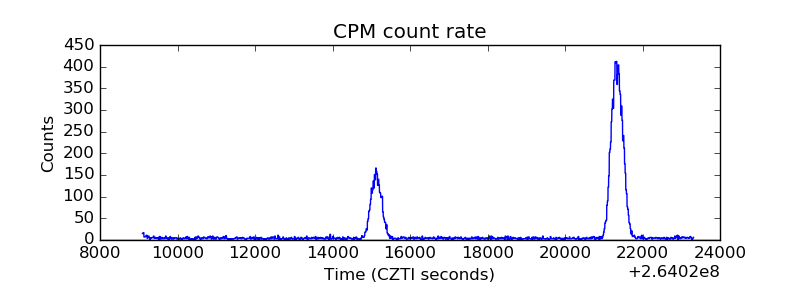 |
| CZT Counter | 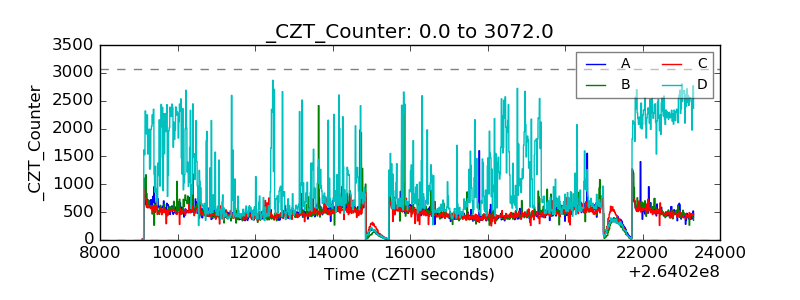 |
| +2.5 Volts monitor |  |
| +5 Volts monitor |  |
| _ROLL_ROT | 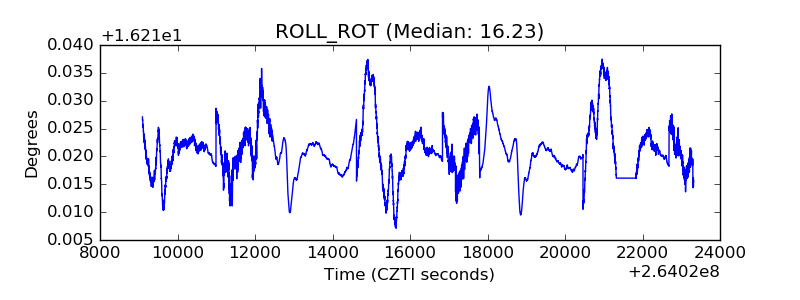 |
| _Roll_DEC | 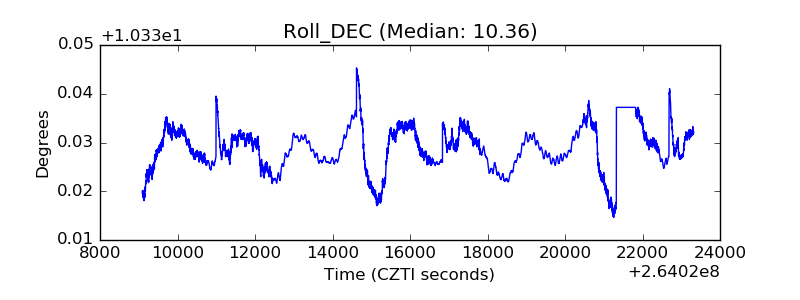 |
| _Roll_RA |  |
| Veto Counter | 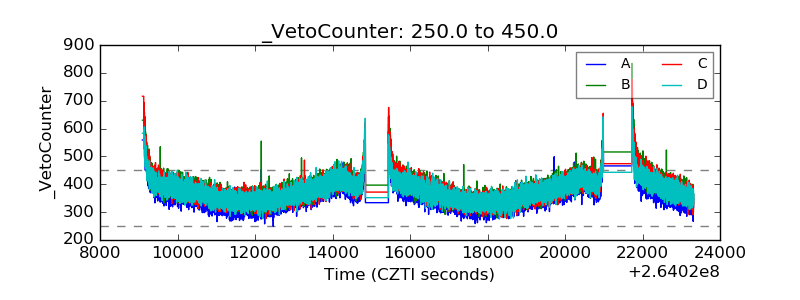 |