| Param | Original file | Final file |
|---|---|---|
| Filename | modeM0/AS1C03_022T01_9000002098_14208cztM0_level2.evt | modeM0/AS1C03_022T01_9000002098_14208cztM0_level2_quad_clean.evt |
| Size (bytes) | 422,147,520 | 58,579,200 |
| Size | 402.6 MB | 55.9 MB |
| Events in quadrant A | 1,637,926 | 439,229 |
| Events in quadrant B | 1,690,976 | 435,194 |
| Events in quadrant C | 1,619,212 | 421,836 |
| Events in quadrant D | 7,596,188 | 226,721 |
| Mode M9 | |||
|---|---|---|---|
| Quadrant | BADHDUFLAG | Total packets | Discarded packets |
| A | 1 | 273359709408 | 0 |
| B | 1 | -1 | -1 |
| C | 1 | -1 | -1 |
| D | 1 | -1 | -1 |
| Mode M0 | |||
|---|---|---|---|
| Quadrant | BADHDUFLAG | Total packets | Discarded packets |
| A | 0 | 7324 | 1 |
| B | 0 | 7545 | 1 |
| C | 0 | 7195 | 1 |
| D | 0 | 24964 | 1 |
| Mode SS | |||
|---|---|---|---|
| Quadrant | BADHDUFLAG | Total packets | Discarded packets |
| A | 0 | 70 | 0 |
| B | 0 | 70 | 0 |
| C | 0 | 70 | 0 |
| D | 0 | 70 | 0 |
| Quadrant | Total seconds | Saturated seconds | Saturation percentage |
|---|---|---|---|
| A | 3525 | 15 | 0.425532% |
| B | 3525 | 28 | 0.794326% |
| C | 3525 | 3 | 0.085106% |
| D | 3525 | 2708 | 76.822695% |
Noise dominated data is calculated using 1-second bins in cleaned event files. If a bin has >2000 counts, and if more than 50% of those come from <1% of pixels, then it is considered to be noise-dominated and hence unusable.
| Quadrant | # 1 sec bins | Bins with >0 counts | Bins with >2000 counts | High rate bins dominated by noise | Noise dominated (total time) | Noise dominated (detector-on time) | Marked lightcurve |
|---|---|---|---|---|---|---|---|
| A | 3526 | 3526 | 2 | 2 | 0.06% | 0.06% | 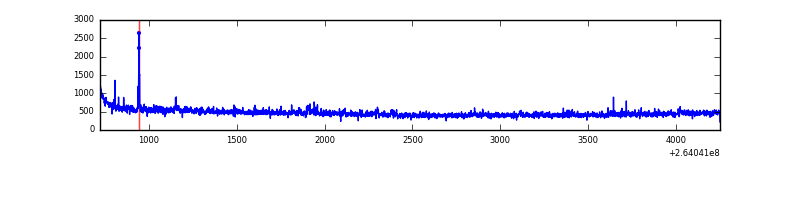 |
| B | 3526 | 3526 | 1 | 1 | 0.03% | 0.03% | 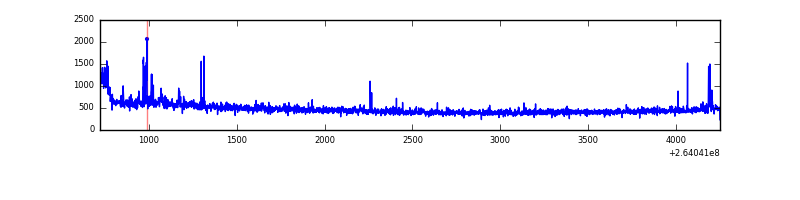 |
| C | 3526 | 3526 | 0 | 0 | 0.00% | 0.00% | 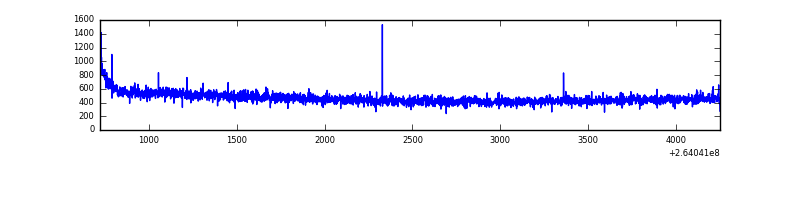 |
| D | 3526 | 3526 | 2321 | 2321 | 65.83% | 65.83% | 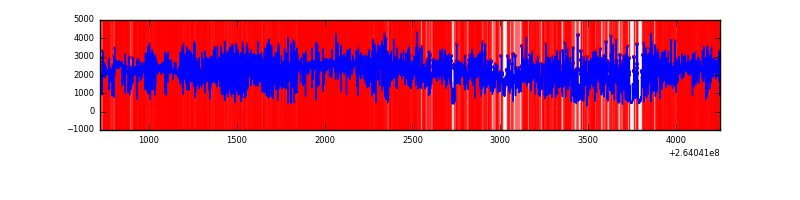 |
Top three noisy pixels from each quadrant. If the there are fewer than three noisy pixels in the level2.evt file, extra rows are filled as -1
| Pixel properties | Quadrant properties | ||||||
|---|---|---|---|---|---|---|---|
| Quadrant | DetID | PixID | Counts | Sigma | Mean | Median | Sigma |
| A | 8 | 15 | 46068 | 552.61 | 399 | 390 | 82.7 |
| A | 12 | 189 | 30053 | 358.86 | 399 | 390 | 82.7 |
| A | 9 | 143 | 16229 | 191.62 | 399 | 390 | 82.7 |
| B | 4 | 97 | 27915 | 347.15 | 401 | 390 | 79.3 |
| B | 0 | 219 | 24050 | 298.41 | 401 | 390 | 79.3 |
| B | 0 | 85 | 21298 | 263.7 | 401 | 390 | 79.3 |
| C | 3 | 233 | 105775 | 1143.83 | 388 | 391 | 92.1 |
| C | 13 | 61 | 2738 | 25.47 | 388 | 391 | 92.1 |
| C | 14 | 234 | 1357 | 10.48 | 388 | 391 | 92.1 |
| D | 13 | 122 | 6129347 | 110554.65 | 227 | 222 | 55.4 |
| D | 5 | 222 | 496804 | 8957.14 | 227 | 222 | 55.4 |
| D | 10 | 199 | 49754 | 893.44 | 227 | 222 | 55.4 |
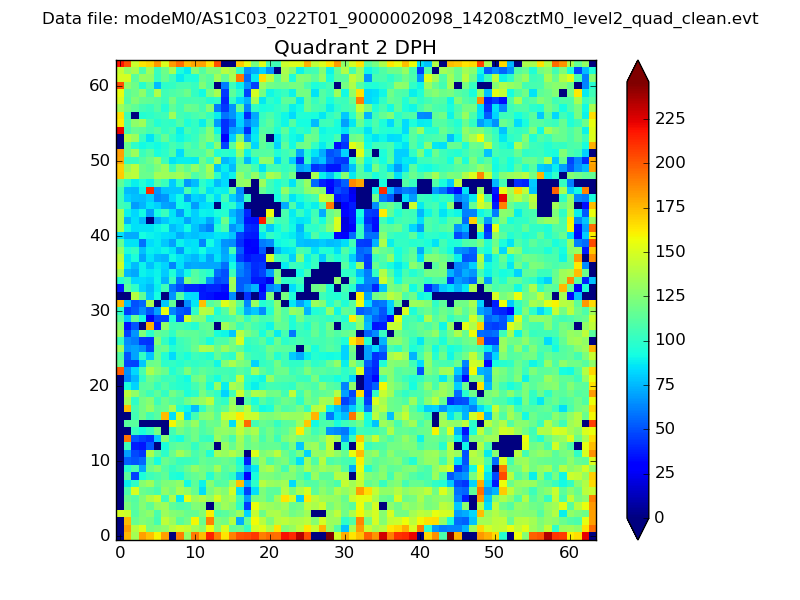
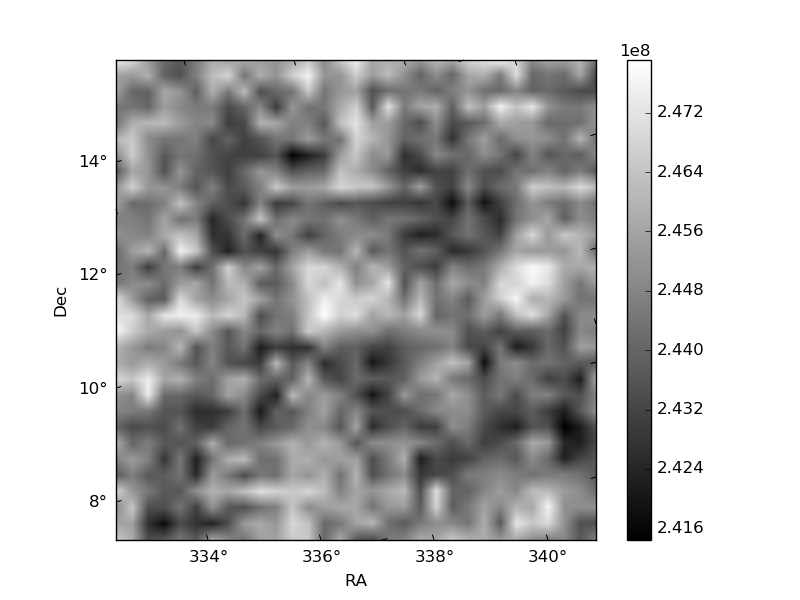
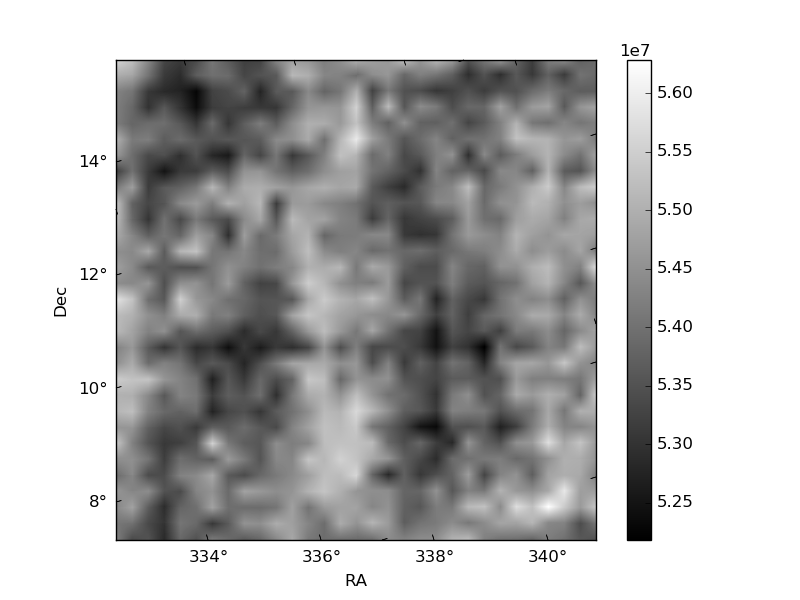
Histogram calculated using DETX and DETY for each event in the final _common_clean file
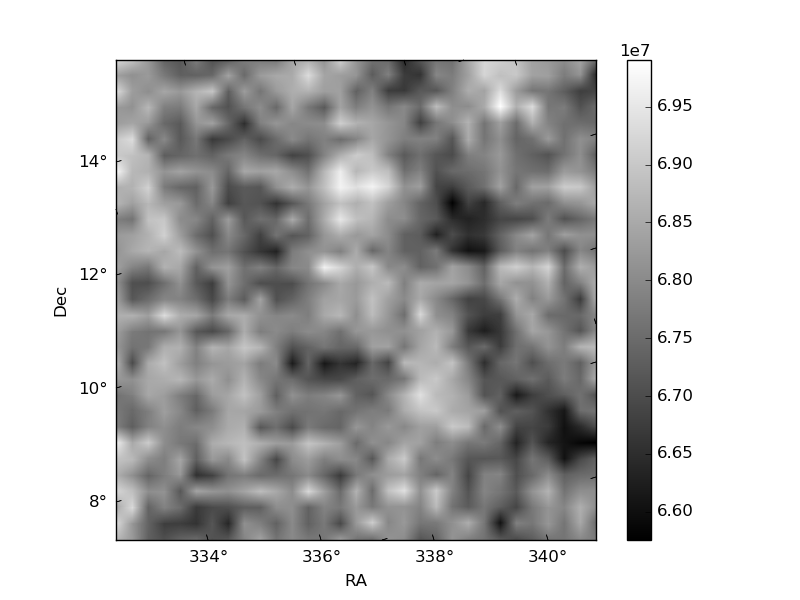
| Quadrant A | 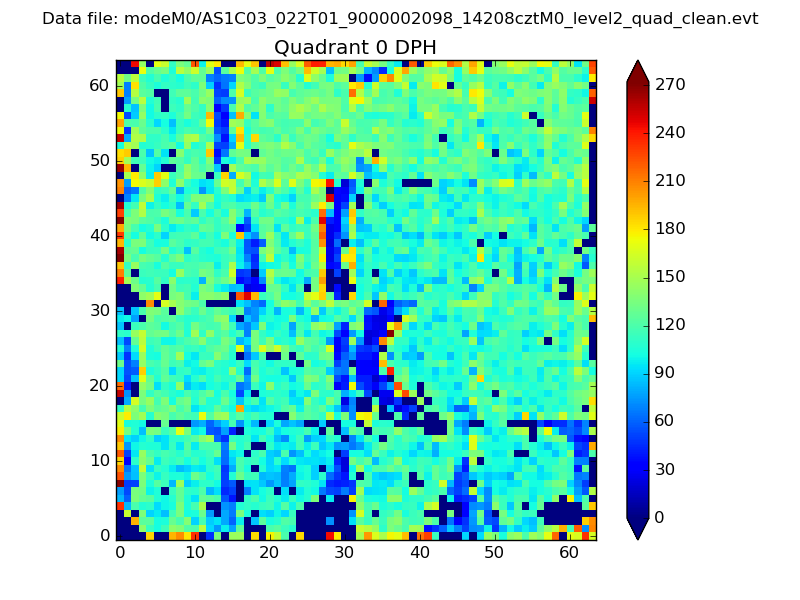 |
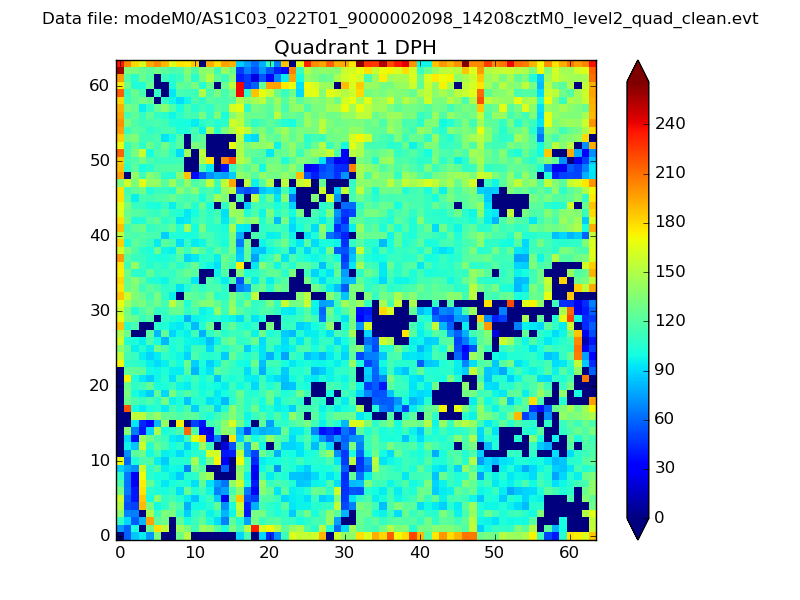 |
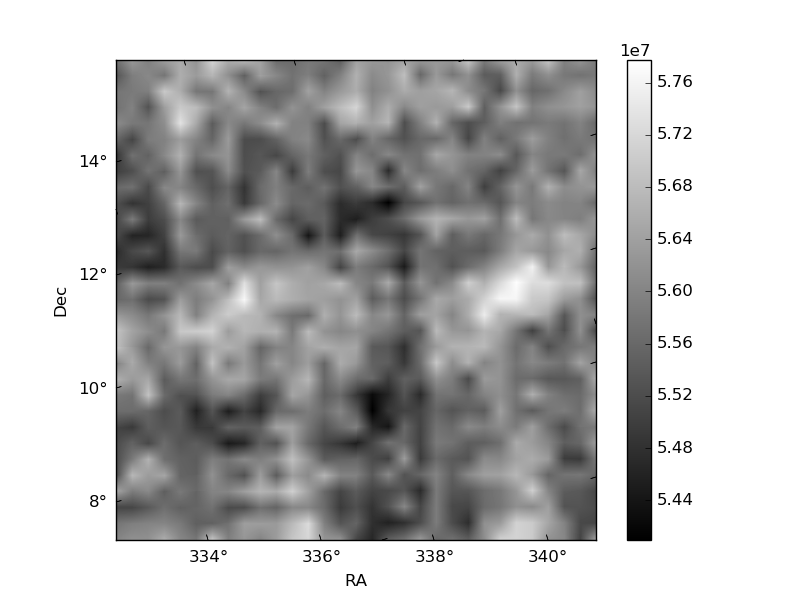
Quadrant B |
|---|---|---|---|
| Quadrant D | 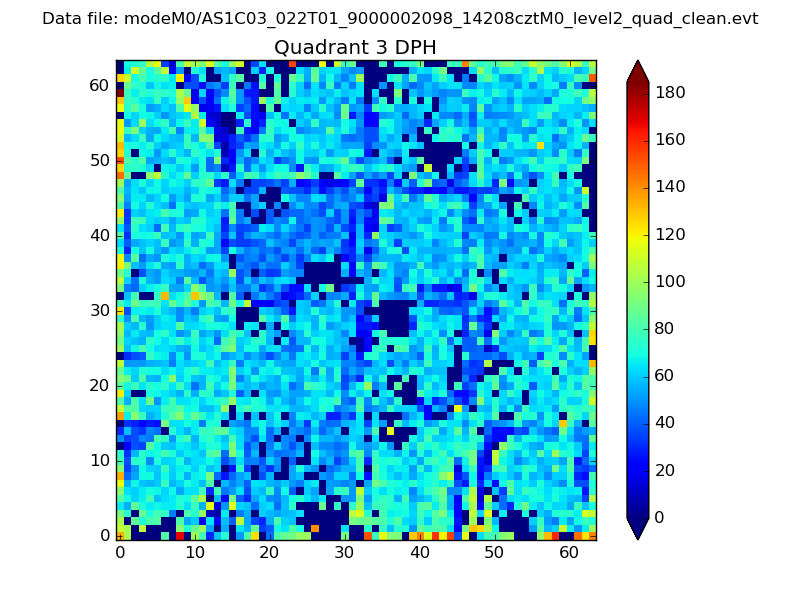 |
 |
Quadrant C |
| Plot type | Count rate plots | Images |
|---|---|---|
| Comparison with Poisson distribution Blue bars denote a histogram of data divided into 1 sec bins. Red curve is a Poisson curve with rate = median count rate of data. |
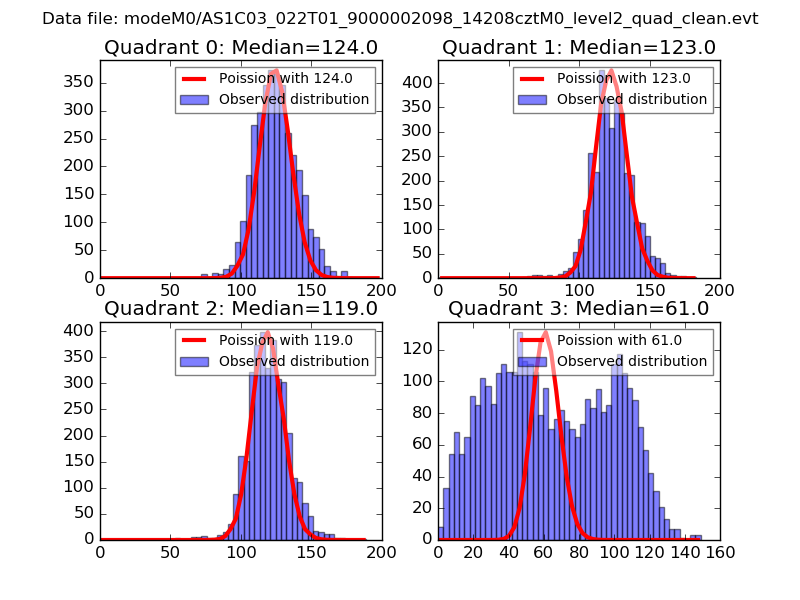 |
 |
| Quadrant-wise count rates Data is divided into 100 sec bins |
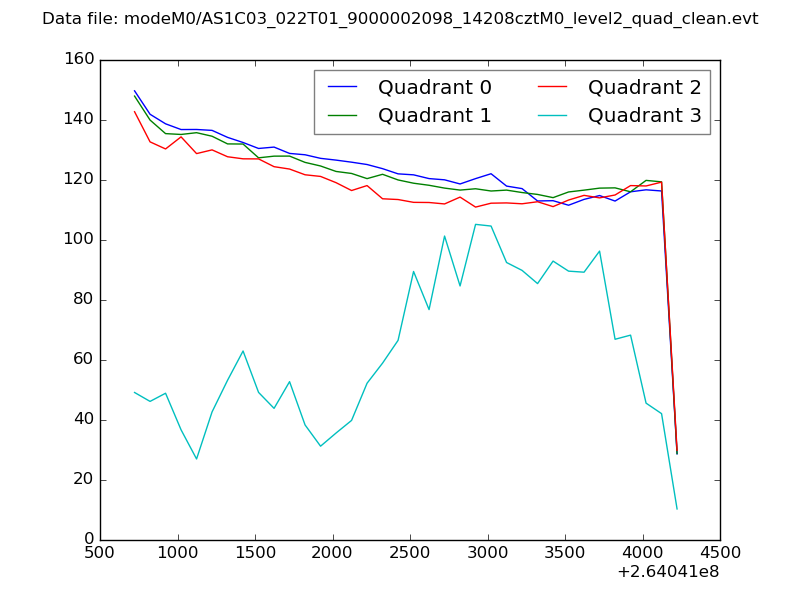 |
|
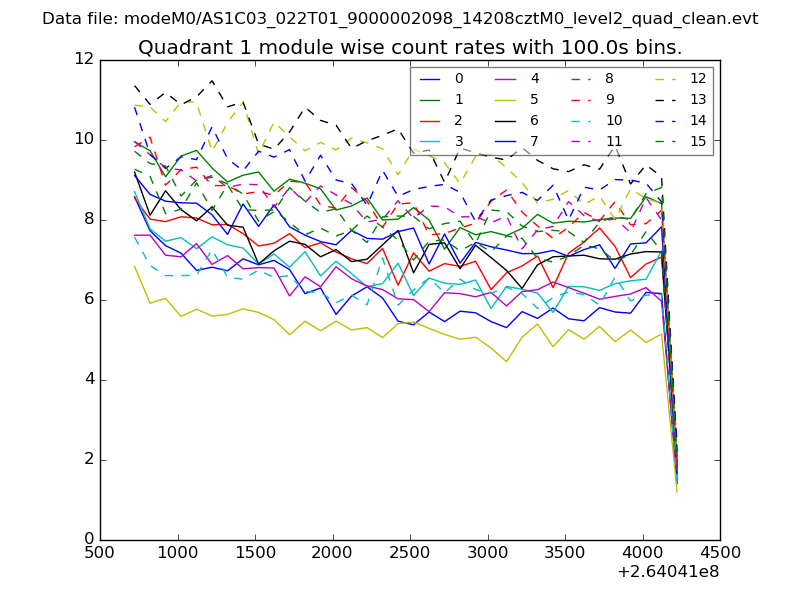
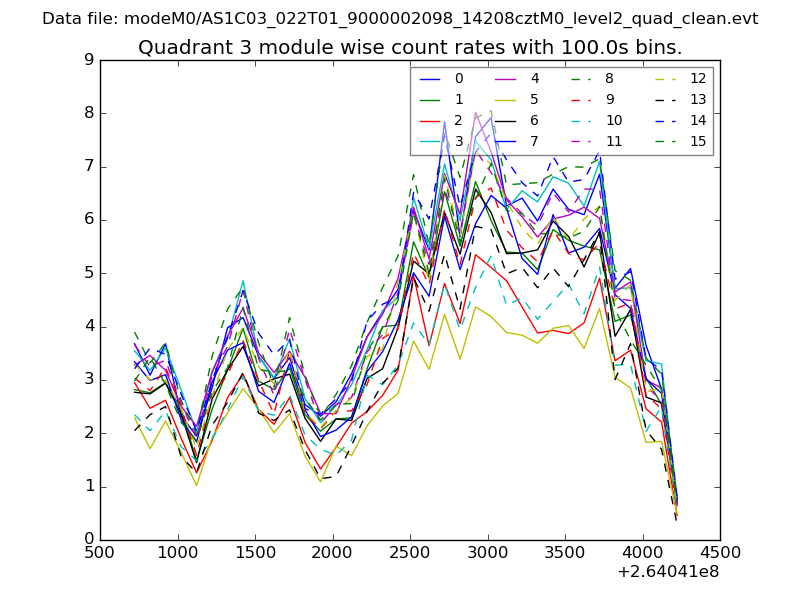
| Module-wise count rates for Quadrant A Data is divided into 100 sec bins |
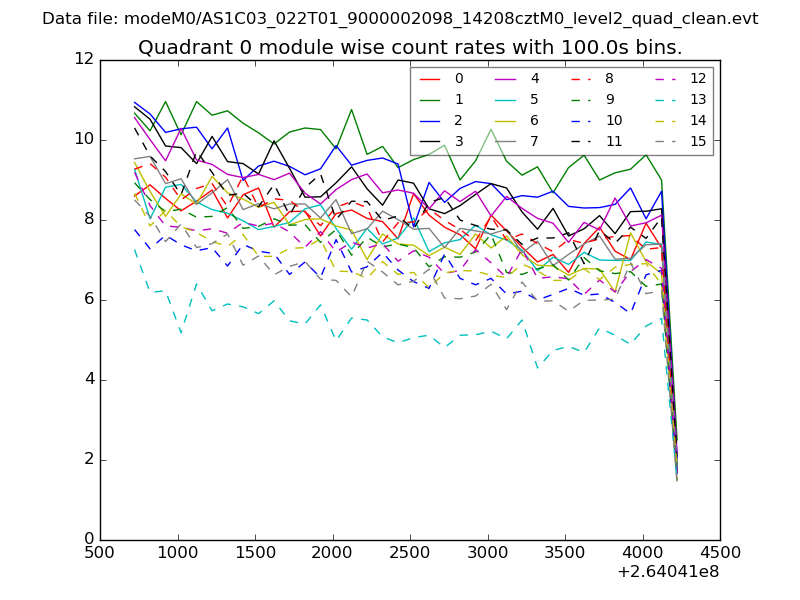 |
 |
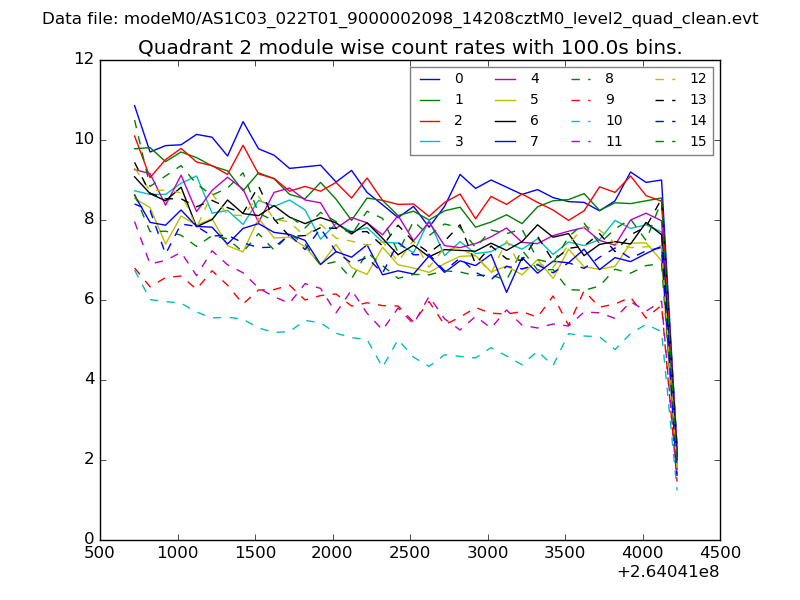
| Module-wise count rates for Quadrant B Data is divided into 100 sec bins |
 |
 |
| Module-wise count rates for Quadrant C Data is divided into 100 sec bins |
 |
 |
| Module-wise count rates for Quadrant D Data is divided into 100 sec bins |
 |
 |
| Parameter | Plot |
|---|---|
| CZT HV Monitor | 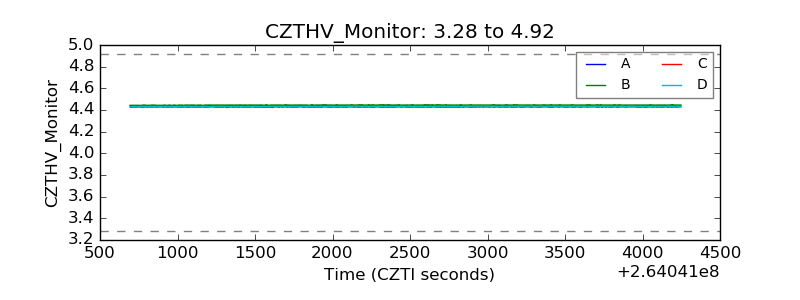 |
| D_VDD | 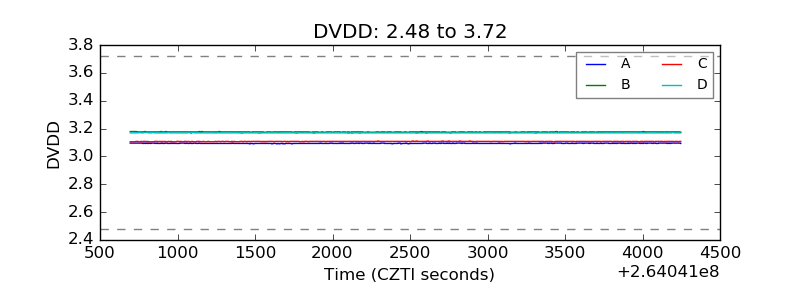 |
| Temperature 1 | 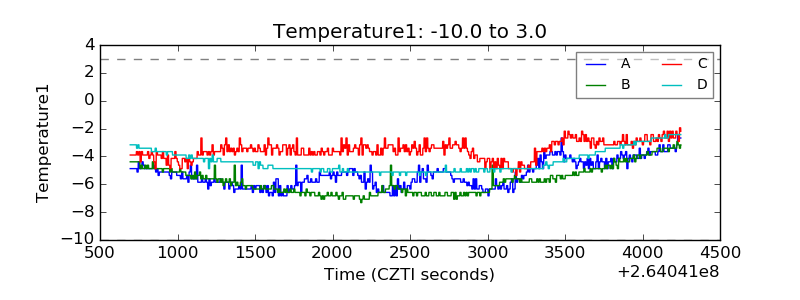 |
| Veto HV Monitor | 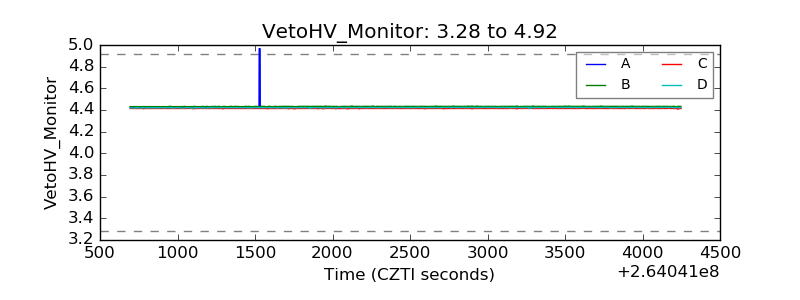 |
| Veto LLD | 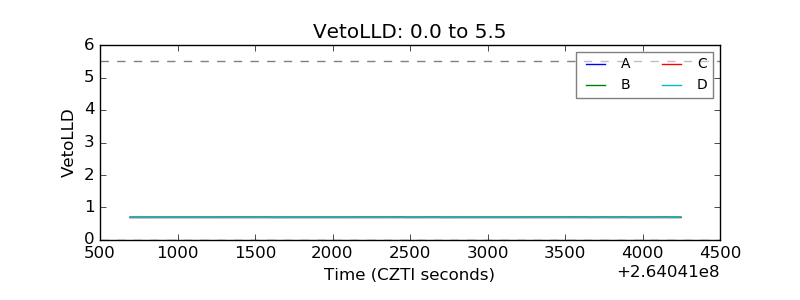 |
| Alpha Counter | 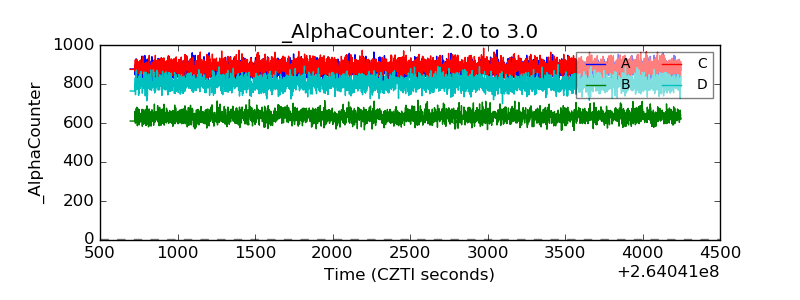 |
| _CPM_Rate | 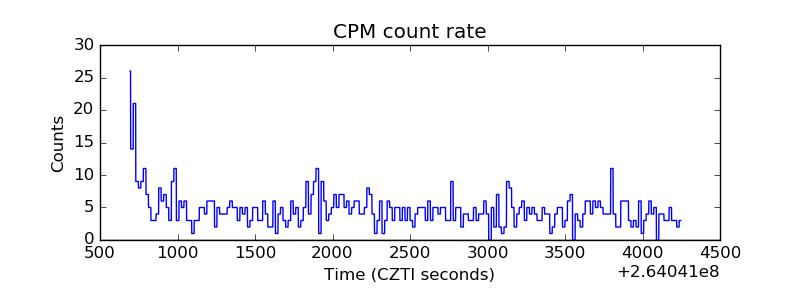 |
| CZT Counter | 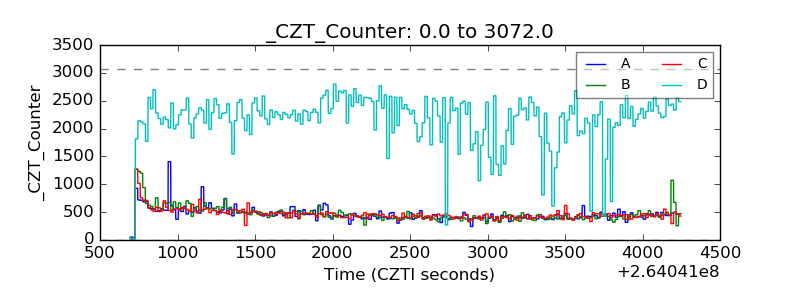 |
| +2.5 Volts monitor | 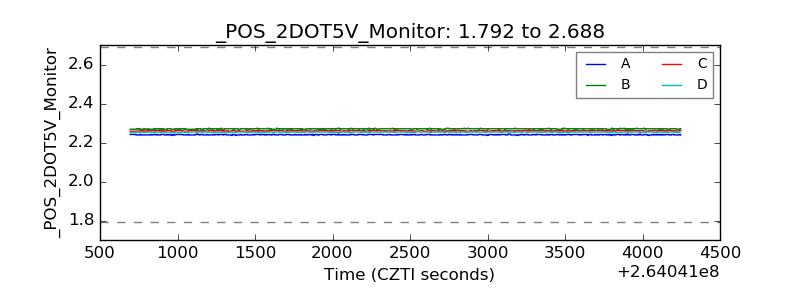 |
| +5 Volts monitor |  |
| _ROLL_ROT | 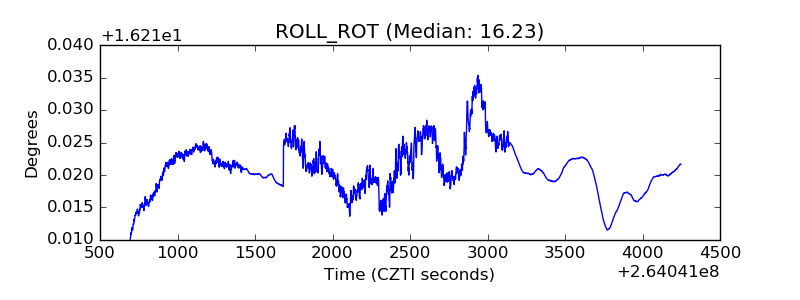 |
| _Roll_DEC |  |
| _Roll_RA | 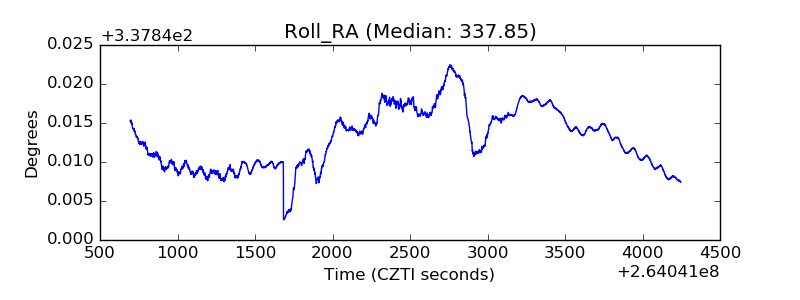 |
| Veto Counter | 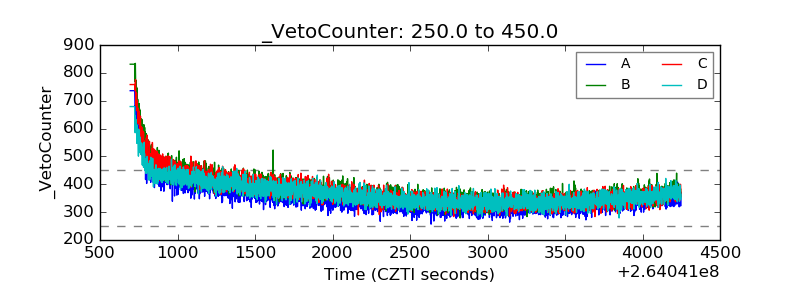 |