| Param | Original file | Final file |
|---|---|---|
| Filename | modeM0/AS1G08_084T01_9000002100cztM0_level2.fits | modeM0/AS1G08_084T01_9000002100cztM0_level2_quad_clean.evt |
| Size (bytes) | 1,223,176,320 | 1,338,039,360 |
| Size | 1.1 GB | 1.2 GB |
| Events in quadrant A | 7,542,622 | 8,506,640 |
| Events in quadrant B | 7,213,618 | 8,387,312 |
| Events in quadrant C | 7,366,338 | 7,907,694 |
| Events in quadrant D | 6,256,200 | 7,062,489 |
| Mode SS | |||
|---|---|---|---|
| Quadrant | BADHDUFLAG | Total packets | Discarded packets |
| A | 0 | 2580 | 0 |
| B | 0 | 2580 | 0 |
| C | 0 | 2580 | 0 |
| D | 0 | 2580 | 0 |
| Mode M0 | |||
|---|---|---|---|
| Quadrant | BADHDUFLAG | Total packets | Discarded packets |
| A | 0 | 264424 | 0 |
| B | 0 | 284713 | 0 |
| C | 0 | 272633 | 0 |
| D | 0 | 362377 | 0 |
| Mode M9 | |||
|---|---|---|---|
| Quadrant | BADHDUFLAG | Total packets | Discarded packets |
| A | 0 | 211 | 0 |
| B | 0 | 211 | 0 |
| C | 0 | 211 | 0 |
| D | 0 | 212 | 0 |
| Quadrant | Total seconds | Saturated seconds | Saturation percentage |
|---|---|---|---|
| A | 126406 | 1332 | 1.053747% |
| B | 126414 | 3118 | 2.466499% |
| C | 126410 | 1146 | 0.906574% |
| D | 126401 | 7203 | 5.698531% |
Noise dominated data is calculated using 1-second bins in cleaned event files. If a bin has >2000 counts, and if more than 50% of those come from <1% of pixels, then it is considered to be noise-dominated and hence unusable.
| Quadrant | # 1 sec bins | Bins with >0 counts | Bins with >2000 counts | High rate bins dominated by noise | Noise dominated (total time) | Noise dominated (detector-on time) | Marked lightcurve |
|---|---|---|---|---|---|---|---|
| A | 148054 | 126405 | 0 | 0 | 0.00% | 0.00% |  |
| B | 148054 | 126410 | 0 | 0 | 0.00% | 0.00% |  |
| C | 148054 | 126418 | 0 | 0 | 0.00% | 0.00% |  |
| D | 148054 | 126380 | 0 | 0 | 0.00% | 0.00% |  |
Top three noisy pixels from each quadrant. If the there are fewer than three noisy pixels in the level2.evt file, extra rows are filled as -1
| Pixel properties | Quadrant properties | ||||||
|---|---|---|---|---|---|---|---|
| Quadrant | DetID | PixID | Counts | Sigma | Mean | Median | Sigma |
| A | 0 | 29 | 7277 | 11.27 | 1967 | 1855 | 480.9 |
| A | 7 | 110 | 6236 | 9.11 | 1967 | 1855 | 480.9 |
| A | 9 | 19 | 5752 | 8.1 | 1967 | 1855 | 480.9 |
| B | 2 | 9 | 6044 | 11.38 | 1909 | 1832 | 370.2 |
| B | 14 | 254 | 4762 | 7.92 | 1909 | 1832 | 370.2 |
| B | 3 | 80 | 4759 | 7.91 | 1909 | 1832 | 370.2 |
| C | 1 | 81 | 5572 | 7.49 | 1948 | 1828 | 499.9 |
| C | 1 | 80 | 5571 | 7.49 | 1948 | 1828 | 499.9 |
| C | 12 | 241 | 5225 | 6.79 | 1948 | 1828 | 499.9 |
| D | 3 | 14 | 4561 | 6.1 | 1789 | 1631 | 479.9 |
| D | 6 | 231 | 4509 | 6.0 | 1789 | 1631 | 479.9 |
| D | 7 | 3 | 4356 | 5.68 | 1789 | 1631 | 479.9 |
Histogram calculated using DETX and DETY for each event in the final _common_clean file
| Quadrant A | 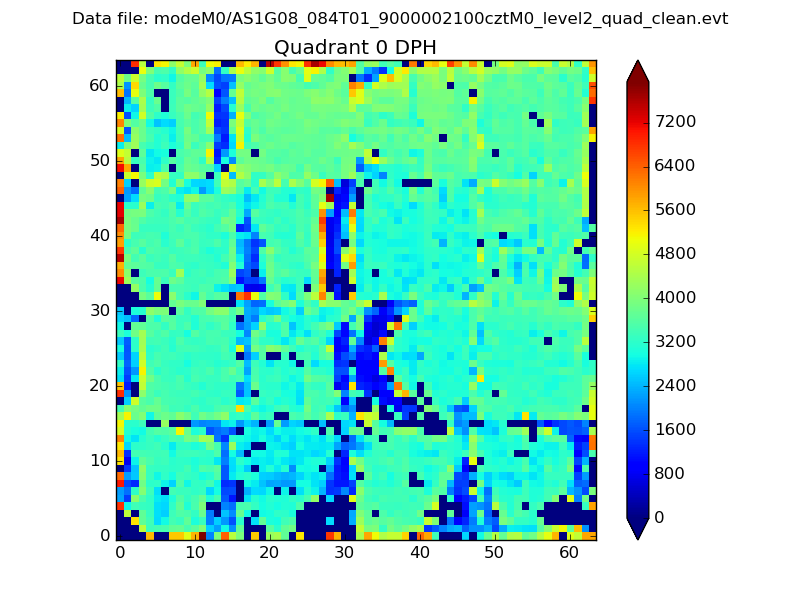 |
 |
Quadrant B |
|---|---|---|---|
| Quadrant D | 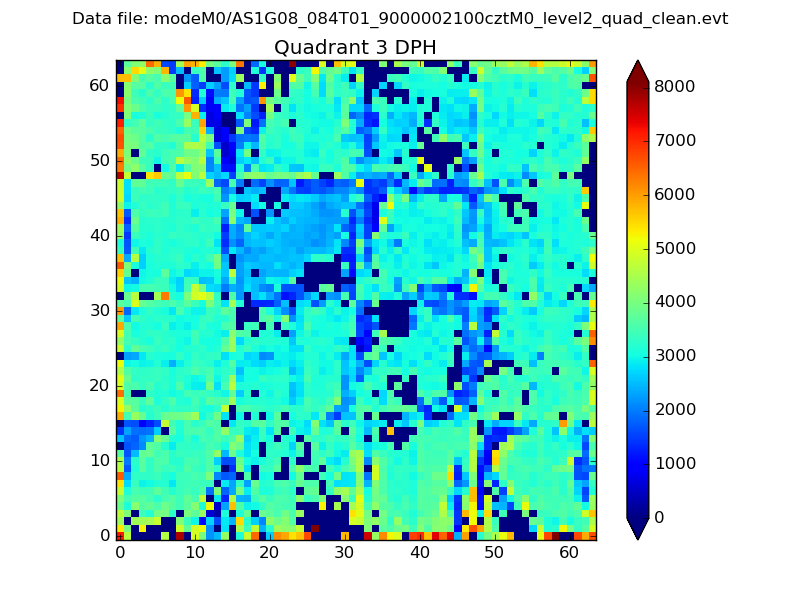 |
 |
Quadrant C |
| Plot type | Count rate plots | Images |
|---|---|---|
| Comparison with Poisson distribution Blue bars denote a histogram of data divided into 1 sec bins. Red curve is a Poisson curve with rate = median count rate of data. |
 |
 |
| Quadrant-wise count rates Data is divided into 100 sec bins |
 |
|
| Module-wise count rates for Quadrant A Data is divided into 100 sec bins |
 |
 |
| Module-wise count rates for Quadrant B Data is divided into 100 sec bins |
 |
 |
| Module-wise count rates for Quadrant C Data is divided into 100 sec bins |
 |
 |
| Module-wise count rates for Quadrant D Data is divided into 100 sec bins |
 |
 |
| Parameter | Plot |
|---|---|
| CZT HV Monitor |  |
| D_VDD |  |
| Temperature 1 | 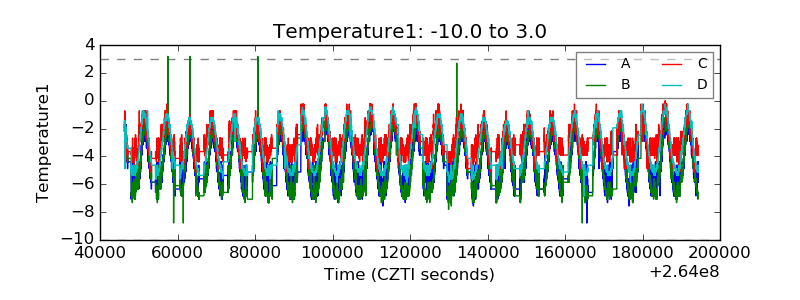 |
| Veto HV Monitor |  |
| Veto LLD |  |
| Alpha Counter |  |
| _CPM_Rate |  |
| CZT Counter |  |
| +2.5 Volts monitor |  |
| +5 Volts monitor |  |
| _ROLL_ROT |  |
| _Roll_DEC |  |
| _Roll_RA | 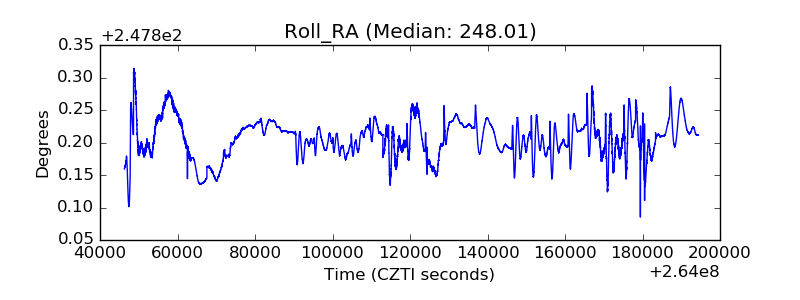 |
| Veto Counter |  |