| Param | Original file | Final file |
|---|---|---|
| Filename | modeM0/AS1G08_084T01_9000002100_14208cztM0_level2.evt | modeM0/AS1G08_084T01_9000002100_14208cztM0_level2_quad_clean.evt |
| Size (bytes) | 232,611,840 | 42,511,680 |
| Size | 221.8 MB | 40.5 MB |
| Events in quadrant A | 1,153,046 | 308,741 |
| Events in quadrant B | 1,215,974 | 310,690 |
| Events in quadrant C | 1,125,720 | 300,082 |
| Events in quadrant D | 3,392,906 | 202,645 |
| Mode SS | |||
|---|---|---|---|
| Quadrant | BADHDUFLAG | Total packets | Discarded packets |
| A | 0 | 46 | 0 |
| B | 0 | 46 | 0 |
| C | 0 | 46 | 0 |
| D | 0 | 46 | 0 |
| Mode M0 | |||
|---|---|---|---|
| Quadrant | BADHDUFLAG | Total packets | Discarded packets |
| A | 0 | 4778 | 2 |
| B | 0 | 4949 | 1 |
| C | 0 | 4675 | 1 |
| D | 0 | 11595 | 1 |
| Mode M9 | |||
|---|---|---|---|
| Quadrant | BADHDUFLAG | Total packets | Discarded packets |
| A | 0 | 9 | 0 |
| B | 0 | 9 | 0 |
| C | 0 | 9 | 0 |
| D | 0 | 9 | 0 |
| Quadrant | Total seconds | Saturated seconds | Saturation percentage |
|---|---|---|---|
| A | 2286 | 8 | 0.349956% |
| B | 2286 | 17 | 0.743657% |
| C | 2286 | 18 | 0.787402% |
| D | 2286 | 1021 | 44.663167% |
Noise dominated data is calculated using 1-second bins in cleaned event files. If a bin has >2000 counts, and if more than 50% of those come from <1% of pixels, then it is considered to be noise-dominated and hence unusable.
| Quadrant | # 1 sec bins | Bins with >0 counts | Bins with >2000 counts | High rate bins dominated by noise | Noise dominated (total time) | Noise dominated (detector-on time) | Marked lightcurve |
|---|---|---|---|---|---|---|---|
| A | 3188 | 2288 | 2 | 2 | 0.06% | 0.09% | 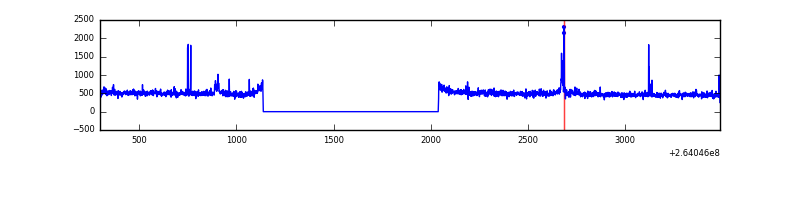 |
| B | 3188 | 2288 | 0 | 0 | 0.00% | 0.00% | 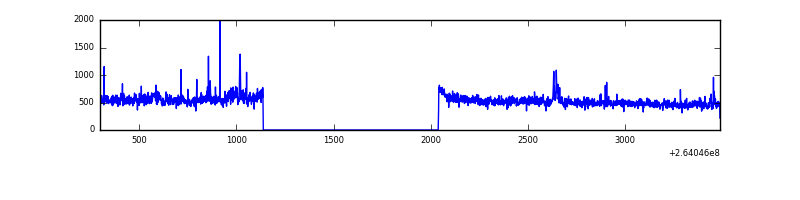 |
| C | 3188 | 2288 | 0 | 0 | 0.00% | 0.00% | 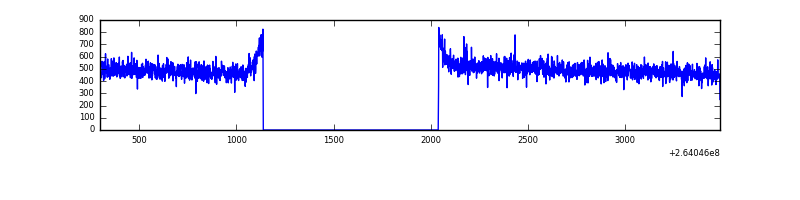 |
| D | 3188 | 2287 | 958 | 958 | 30.05% | 41.89% | 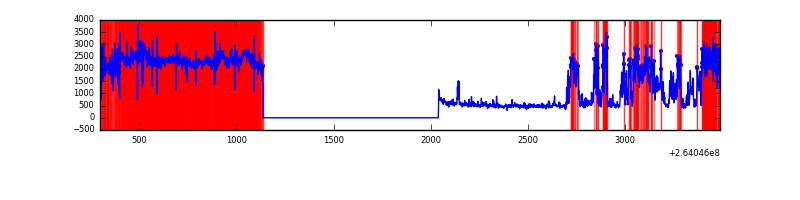 |
Top three noisy pixels from each quadrant. If the there are fewer than three noisy pixels in the level2.evt file, extra rows are filled as -1
| Pixel properties | Quadrant properties | ||||||
|---|---|---|---|---|---|---|---|
| Quadrant | DetID | PixID | Counts | Sigma | Mean | Median | Sigma |
| A | 12 | 189 | 19166 | 320.25 | 284 | 278 | 59.0 |
| A | 9 | 143 | 15926 | 265.32 | 284 | 278 | 59.0 |
| A | 8 | 15 | 13935 | 231.56 | 284 | 278 | 59.0 |
| B | 4 | 97 | 26884 | 465.29 | 287 | 279 | 57.2 |
| B | 0 | 197 | 19315 | 332.92 | 287 | 279 | 57.2 |
| B | 0 | 219 | 14507 | 248.83 | 287 | 279 | 57.2 |
| C | 3 | 233 | 46111 | 692.13 | 277 | 278 | 66.2 |
| C | 13 | 61 | 1900 | 24.49 | 277 | 278 | 66.2 |
| C | 3 | 202 | 623 | 5.21 | 277 | 278 | 66.2 |
| D | 13 | 122 | 1836024 | 34430.09 | 196 | 191 | 53.3 |
| D | 12 | 110 | 696713 | 13062.91 | 196 | 191 | 53.3 |
| D | 10 | 199 | 44102 | 823.53 | 196 | 191 | 53.3 |
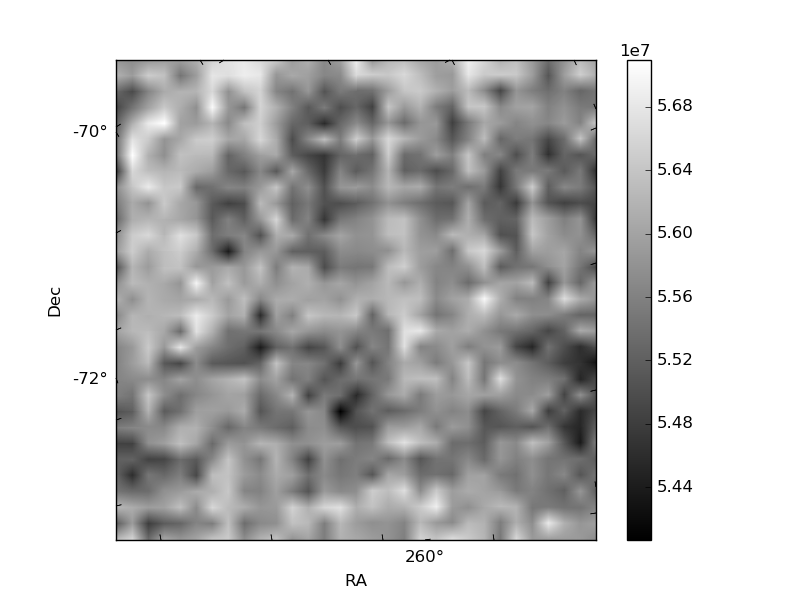
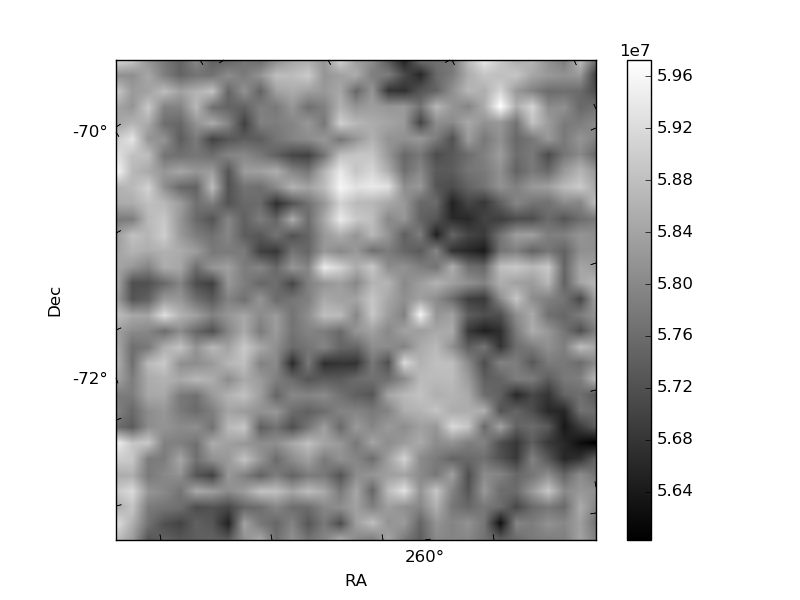
Histogram calculated using DETX and DETY for each event in the final _common_clean file
| Quadrant A |  |
 |
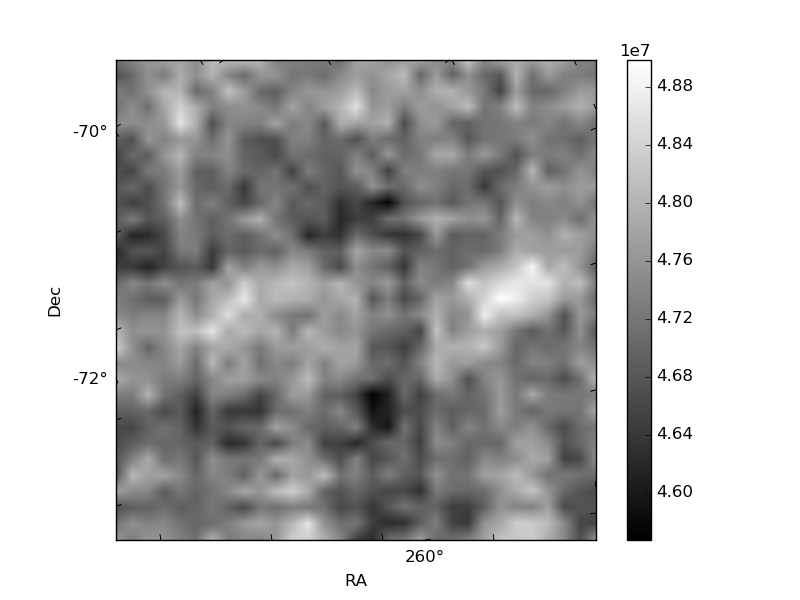
Quadrant B |
|---|---|---|---|
| Quadrant D |  |
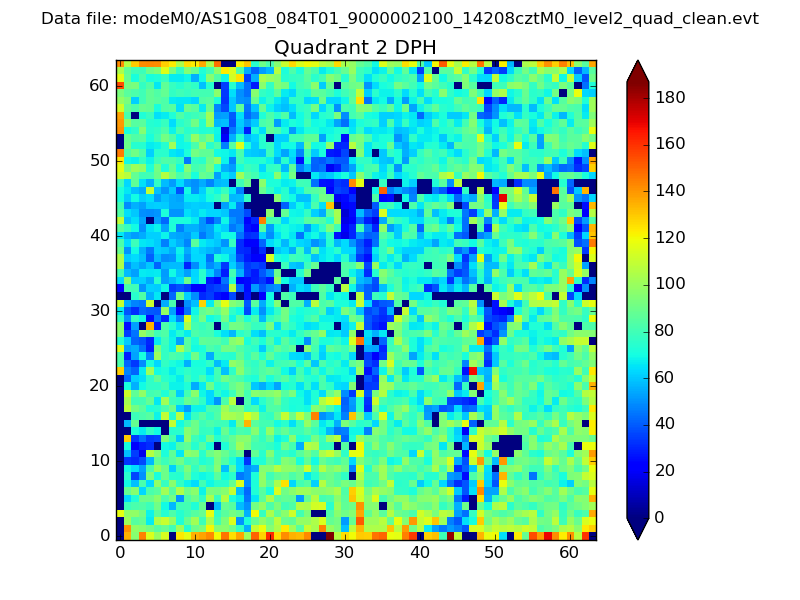 |
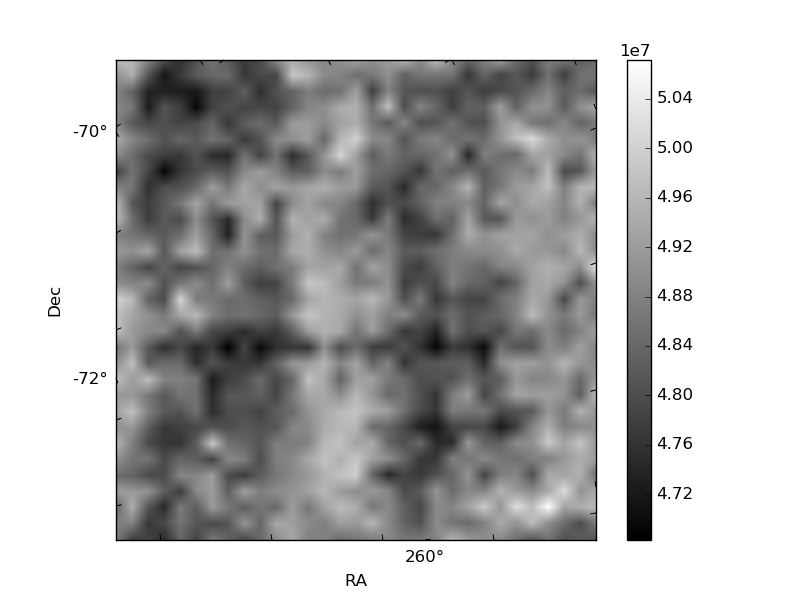
Quadrant C |
| Plot type | Count rate plots | Images |
|---|---|---|
| Comparison with Poisson distribution Blue bars denote a histogram of data divided into 1 sec bins. Red curve is a Poisson curve with rate = median count rate of data. |
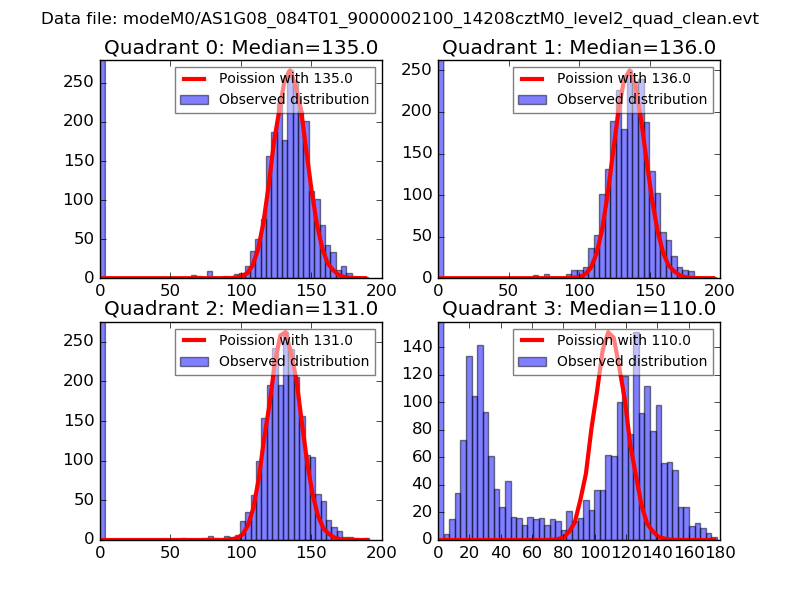 |
 |
| Quadrant-wise count rates Data is divided into 100 sec bins |
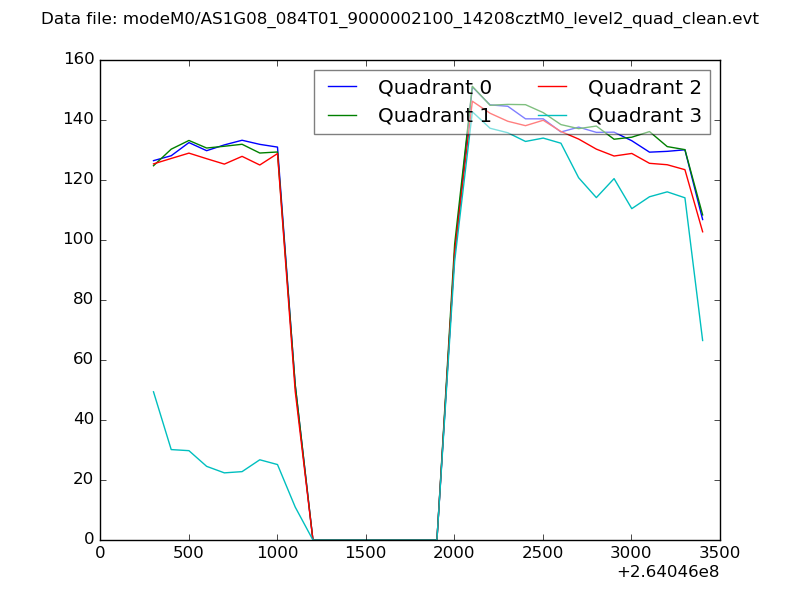 |
|
| Module-wise count rates for Quadrant A Data is divided into 100 sec bins |
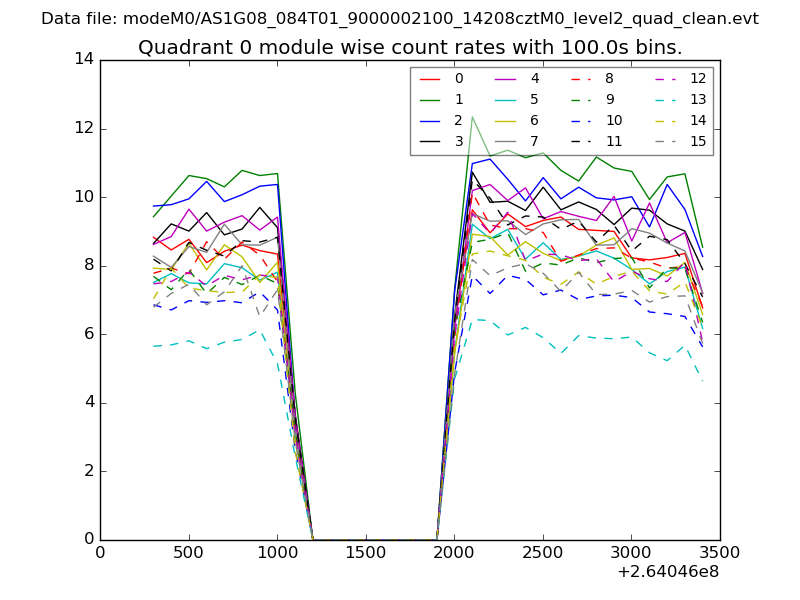 |
 |
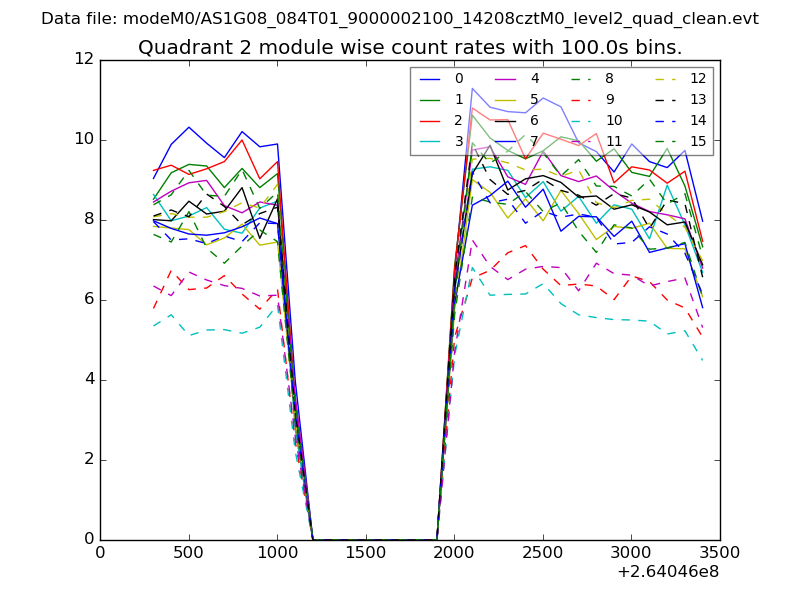
| Module-wise count rates for Quadrant B Data is divided into 100 sec bins |
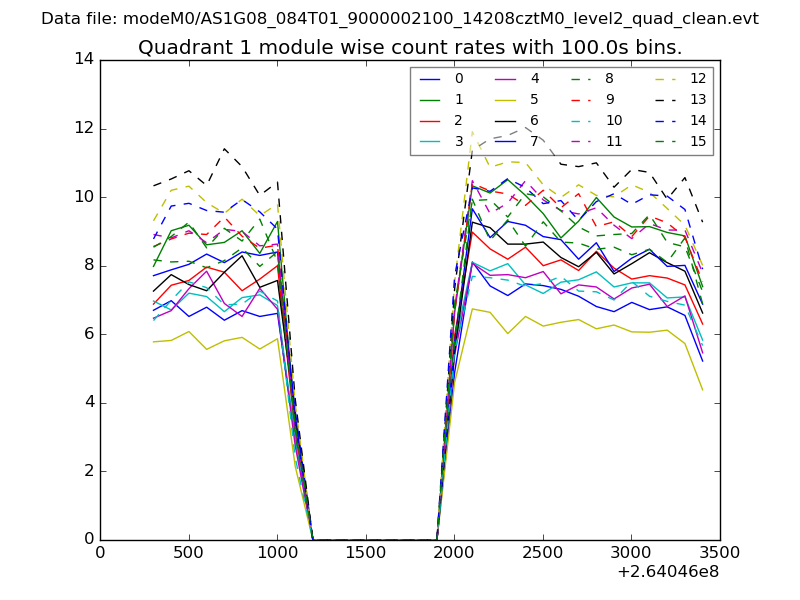 |
 |
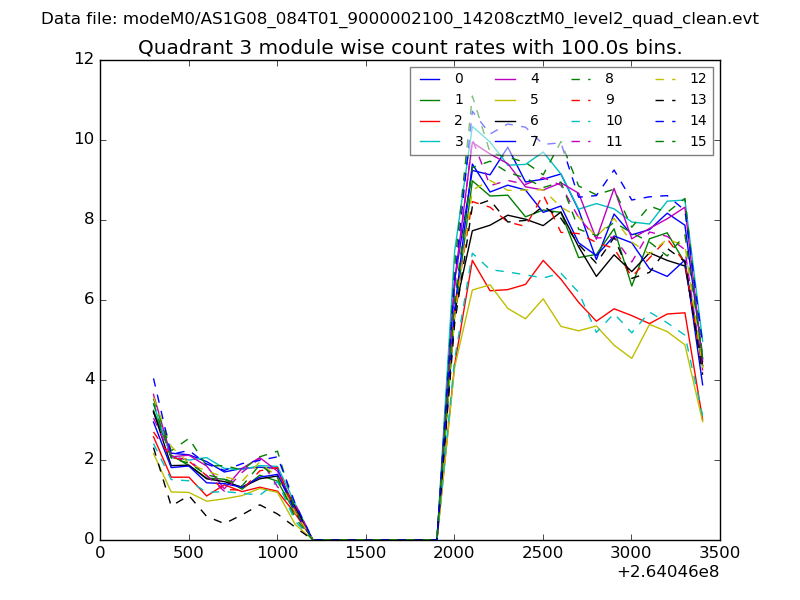
| Module-wise count rates for Quadrant C Data is divided into 100 sec bins |
 |
 |
| Module-wise count rates for Quadrant D Data is divided into 100 sec bins |
 |
 |
| Parameter | Plot |
|---|---|
| CZT HV Monitor | 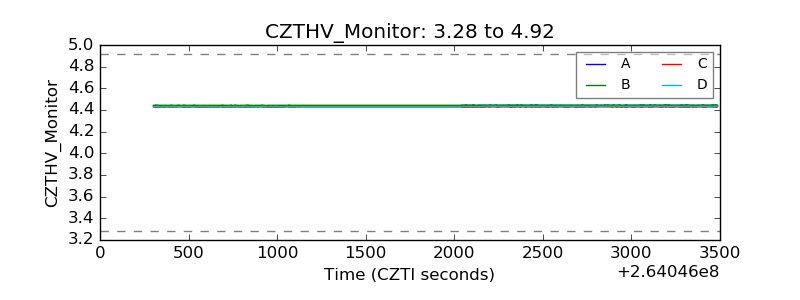 |
| D_VDD |  |
| Temperature 1 | 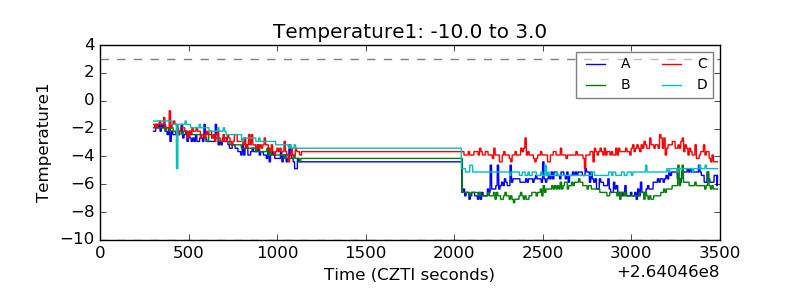 |
| Veto HV Monitor | 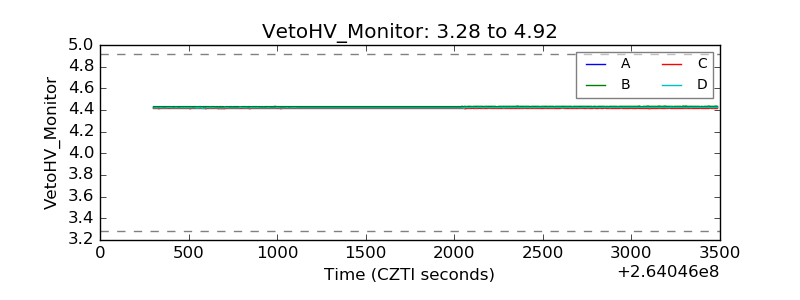 |
| Veto LLD | 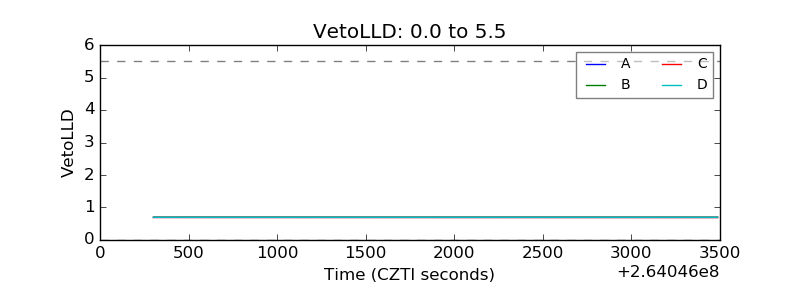 |
| Alpha Counter | 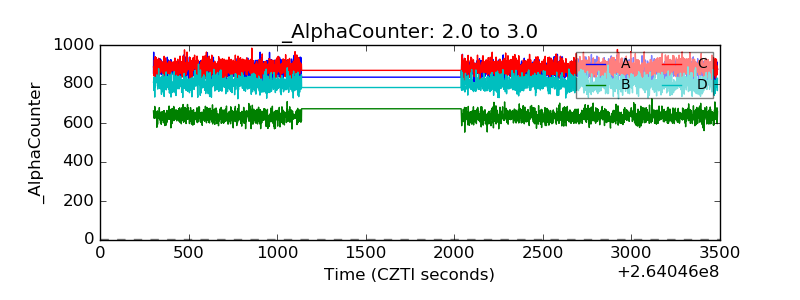 |
| _CPM_Rate | 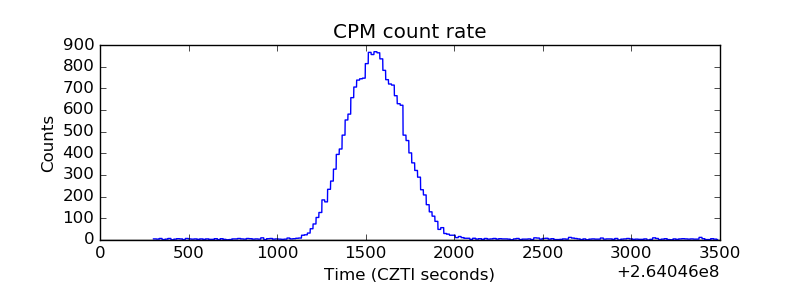 |
| CZT Counter | 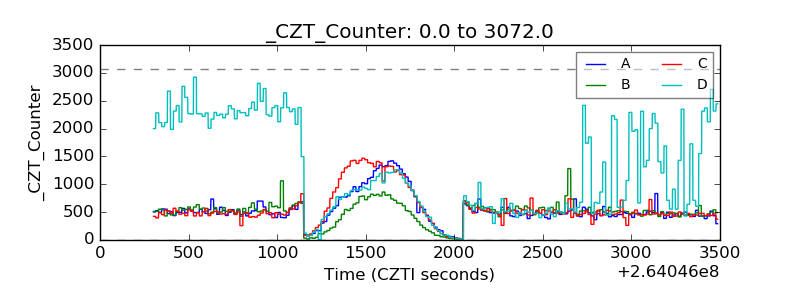 |
| +2.5 Volts monitor |  |
| +5 Volts monitor | 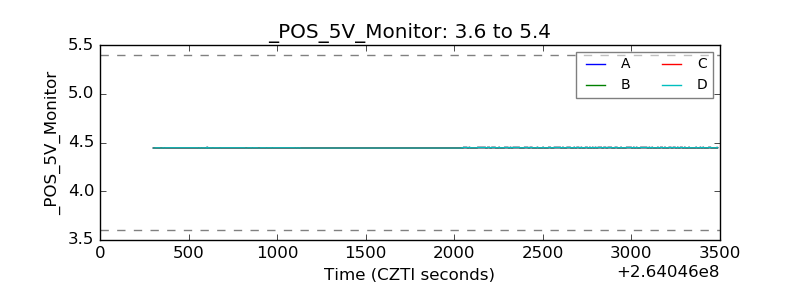 |
| _ROLL_ROT | 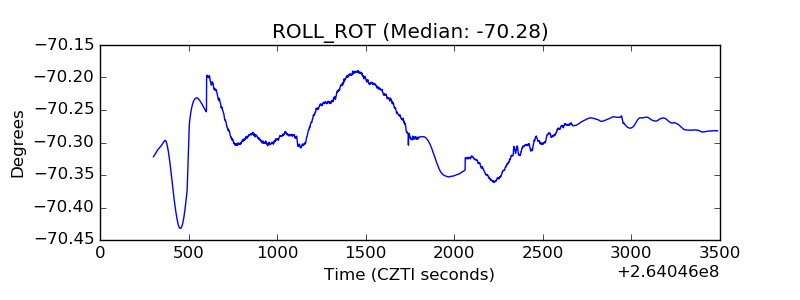 |
| _Roll_DEC | 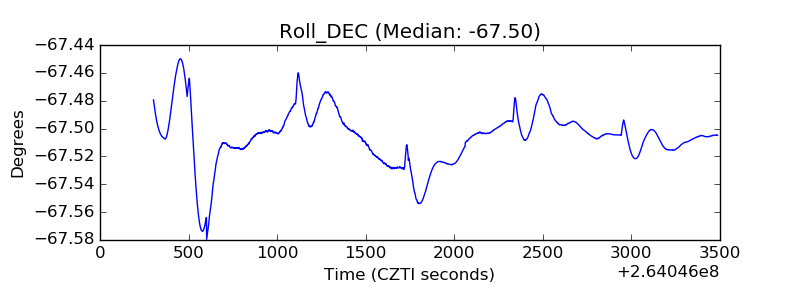 |
| _Roll_RA | 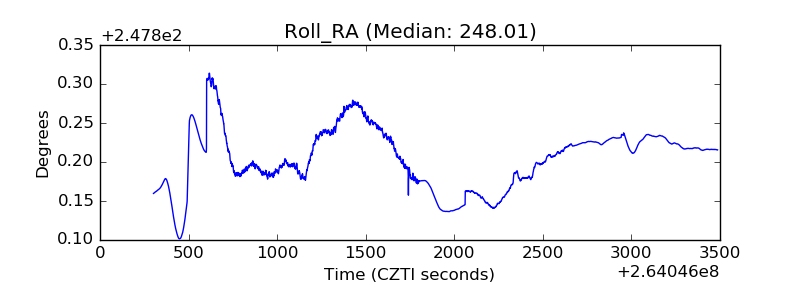 |
| Veto Counter | 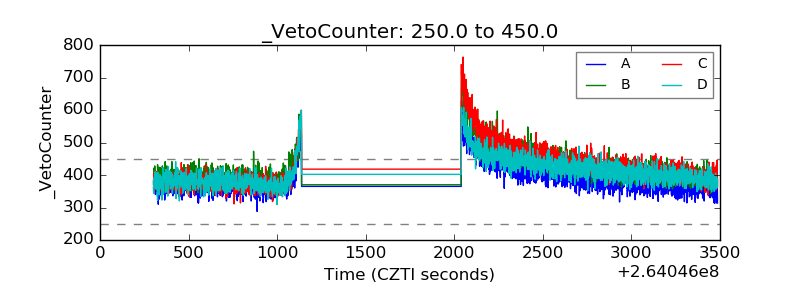 |