| Param | Original file | Final file |
|---|---|---|
| Filename | modeM0/AS1G08_084T01_9000002100_14213cztM0_level2.evt | modeM0/AS1G08_084T01_9000002100_14213cztM0_level2_quad_clean.evt |
| Size (bytes) | 478,828,800 | 92,877,120 |
| Size | 456.6 MB | 88.6 MB |
| Events in quadrant A | 3,155,408 | 606,871 |
| Events in quadrant B | 3,306,761 | 615,838 |
| Events in quadrant C | 3,302,084 | 593,042 |
| Events in quadrant D | 4,323,066 | 570,774 |
| Mode SS | |||
|---|---|---|---|
| Quadrant | BADHDUFLAG | Total packets | Discarded packets |
| A | 0 | 126 | 0 |
| B | 0 | 126 | 0 |
| C | 0 | 126 | 0 |
| D | 0 | 126 | 0 |
| Mode M0 | |||
|---|---|---|---|
| Quadrant | BADHDUFLAG | Total packets | Discarded packets |
| A | 0 | 13077 | 2 |
| B | 0 | 13426 | 1 |
| C | 0 | 13405 | 1 |
| D | 0 | 17090 | 1 |
| Mode M9 | |||
|---|---|---|---|
| Quadrant | BADHDUFLAG | Total packets | Discarded packets |
| A | 0 | 12 | 0 |
| B | 0 | 12 | 0 |
| C | 0 | 12 | 0 |
| D | 0 | 12 | 0 |
| Quadrant | Total seconds | Saturated seconds | Saturation percentage |
|---|---|---|---|
| A | 6096 | 111 | 1.820866% |
| B | 6096 | 126 | 2.066929% |
| C | 6096 | 99 | 1.624016% |
| D | 6096 | 219 | 3.592520% |
Noise dominated data is calculated using 1-second bins in cleaned event files. If a bin has >2000 counts, and if more than 50% of those come from <1% of pixels, then it is considered to be noise-dominated and hence unusable.
| Quadrant | # 1 sec bins | Bins with >0 counts | Bins with >2000 counts | High rate bins dominated by noise | Noise dominated (total time) | Noise dominated (detector-on time) | Marked lightcurve |
|---|---|---|---|---|---|---|---|
| A | 7337 | 6097 | 1 | 1 | 0.01% | 0.02% | 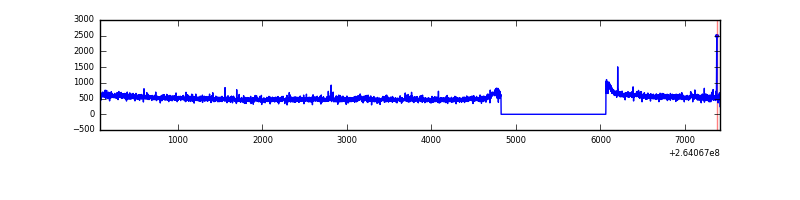 |
| B | 7337 | 6097 | 2 | 2 | 0.03% | 0.03% | 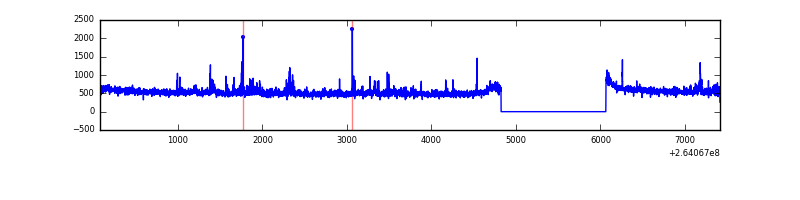 |
| C | 7337 | 6098 | 1 | 1 | 0.01% | 0.02% | 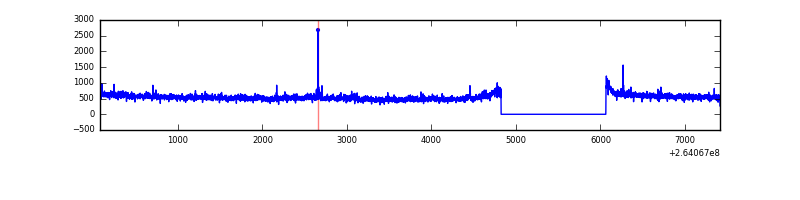 |
| D | 7337 | 6098 | 102 | 102 | 1.39% | 1.67% | 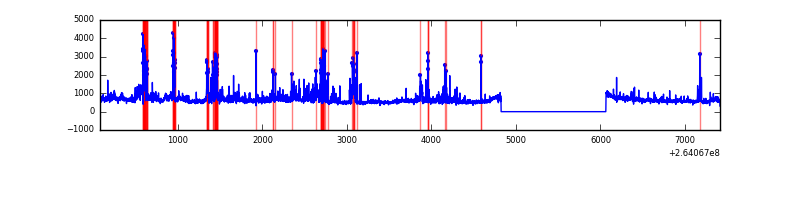 |
Top three noisy pixels from each quadrant. If the there are fewer than three noisy pixels in the level2.evt file, extra rows are filled as -1
| Pixel properties | Quadrant properties | ||||||
|---|---|---|---|---|---|---|---|
| Quadrant | DetID | PixID | Counts | Sigma | Mean | Median | Sigma |
| A | 12 | 189 | 22901 | 139.26 | 804 | 788 | 158.8 |
| A | 8 | 15 | 22105 | 134.25 | 804 | 788 | 158.8 |
| A | 0 | 226 | 7192 | 40.33 | 804 | 788 | 158.8 |
| B | 4 | 97 | 41059 | 273.24 | 797 | 778 | 147.4 |
| B | 0 | 189 | 30958 | 204.72 | 797 | 778 | 147.4 |
| B | 0 | 219 | 30135 | 199.14 | 797 | 778 | 147.4 |
| C | 3 | 233 | 263638 | 1490.03 | 779 | 785 | 176.4 |
| C | 13 | 61 | 5725 | 28.0 | 779 | 785 | 176.4 |
| C | 14 | 234 | 3301 | 14.26 | 779 | 785 | 176.4 |
| D | 5 | 222 | 692223 | 3785.06 | 774 | 755 | 182.7 |
| D | 8 | 195 | 418155 | 2284.82 | 774 | 755 | 182.7 |
| D | 10 | 199 | 227573 | 1241.59 | 774 | 755 | 182.7 |
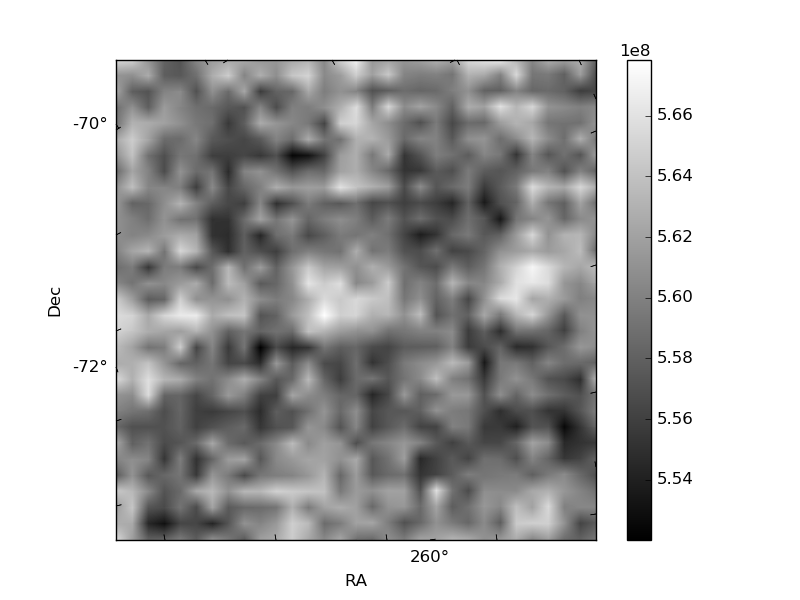
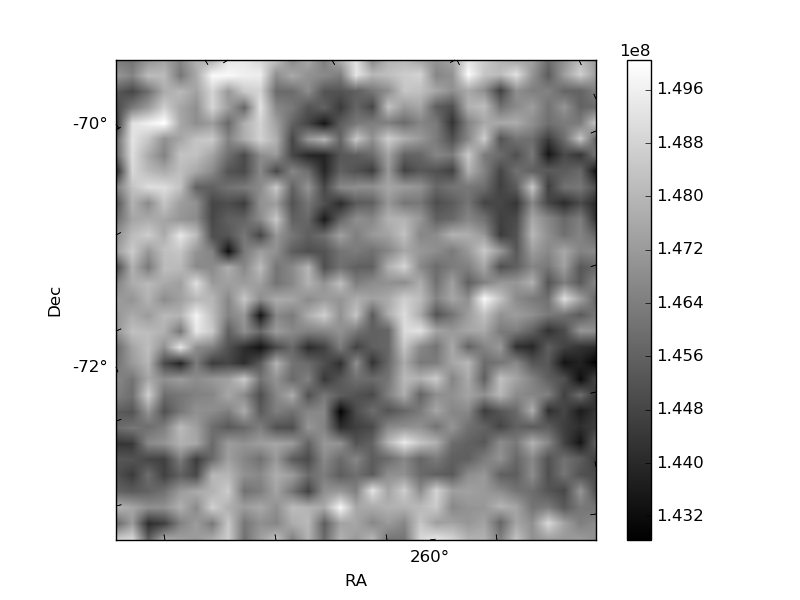
Histogram calculated using DETX and DETY for each event in the final _common_clean file
| Quadrant A | 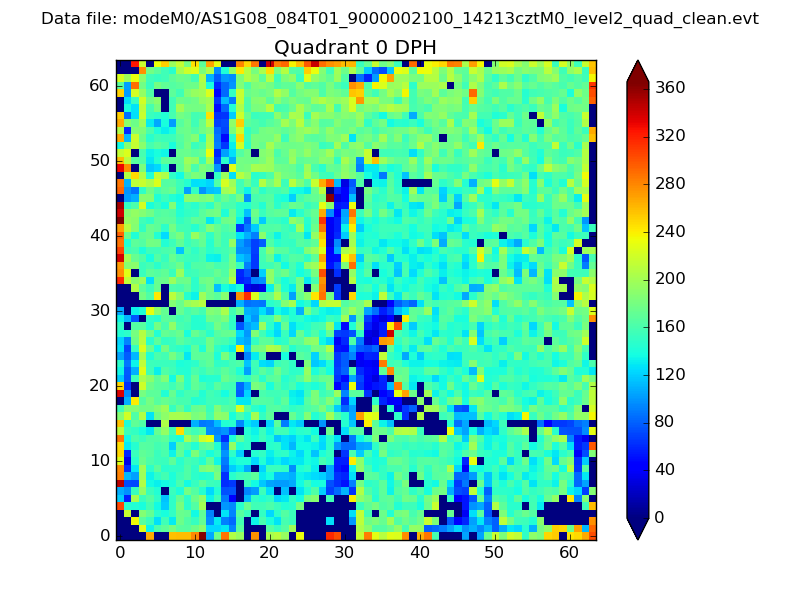 |
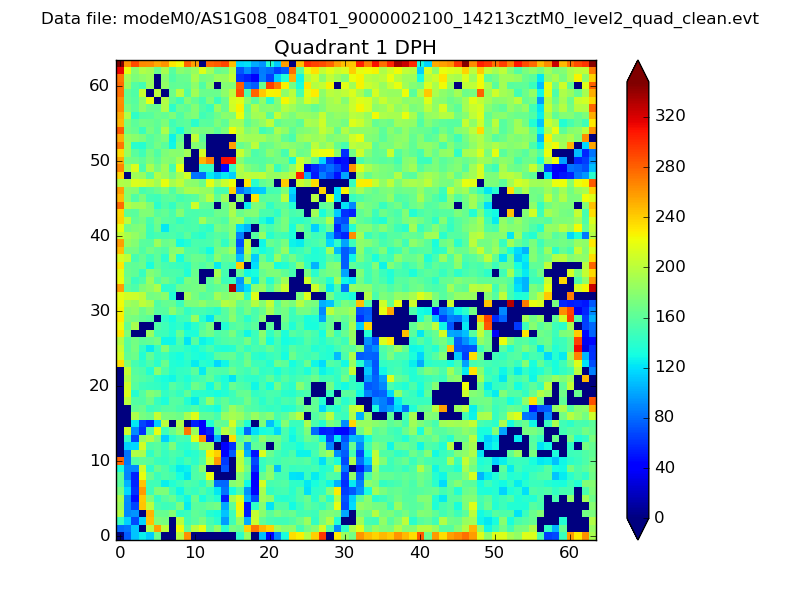 |
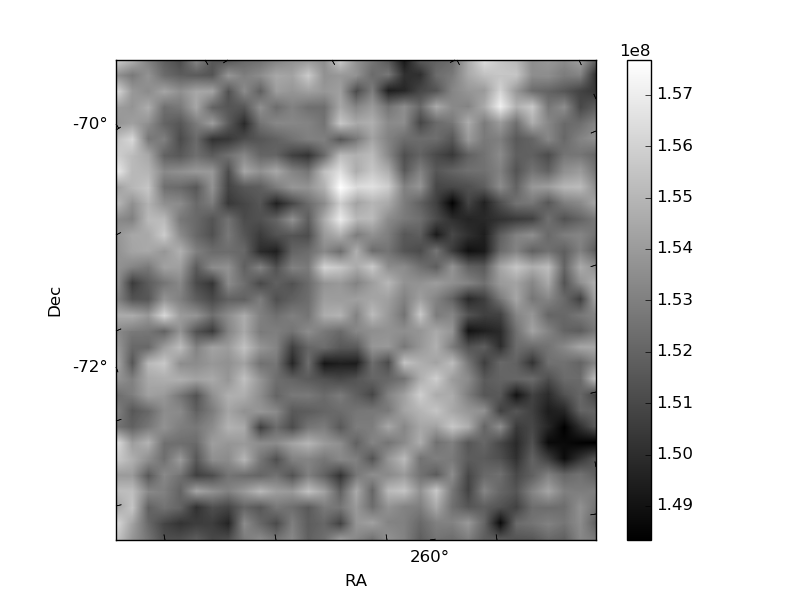
Quadrant B |
|---|---|---|---|
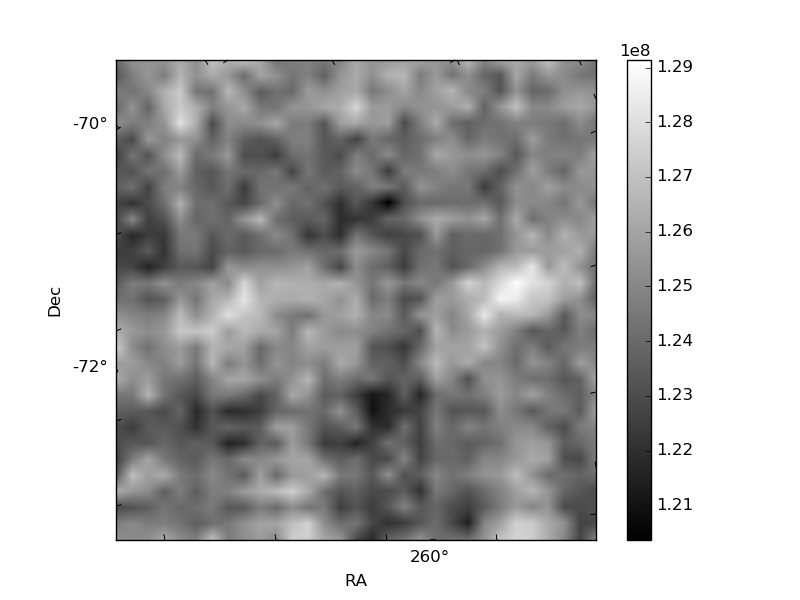
| Quadrant D | 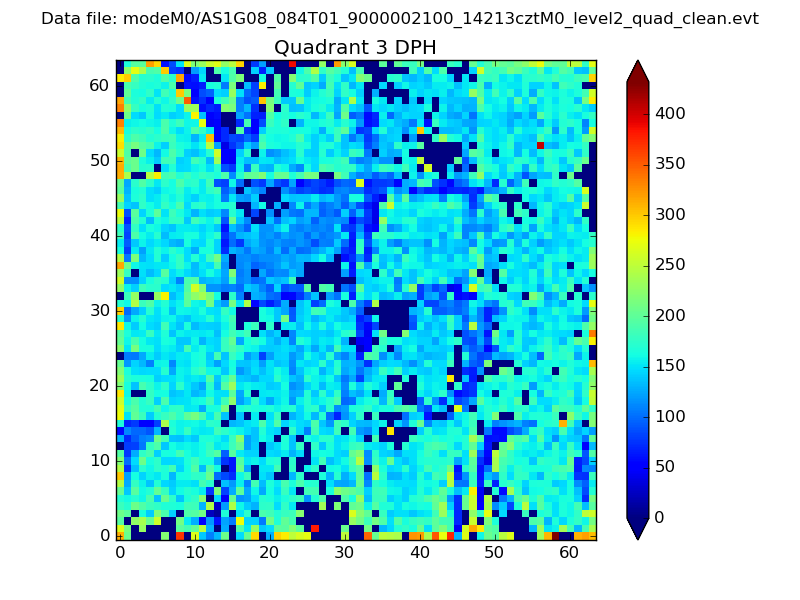 |
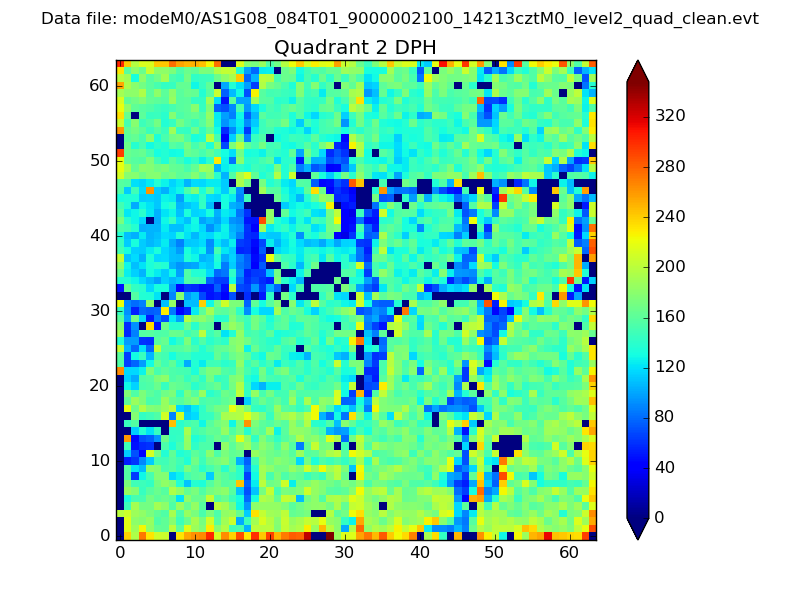 |
Quadrant C |
| Plot type | Count rate plots | Images |
|---|---|---|
| Comparison with Poisson distribution Blue bars denote a histogram of data divided into 1 sec bins. Red curve is a Poisson curve with rate = median count rate of data. |
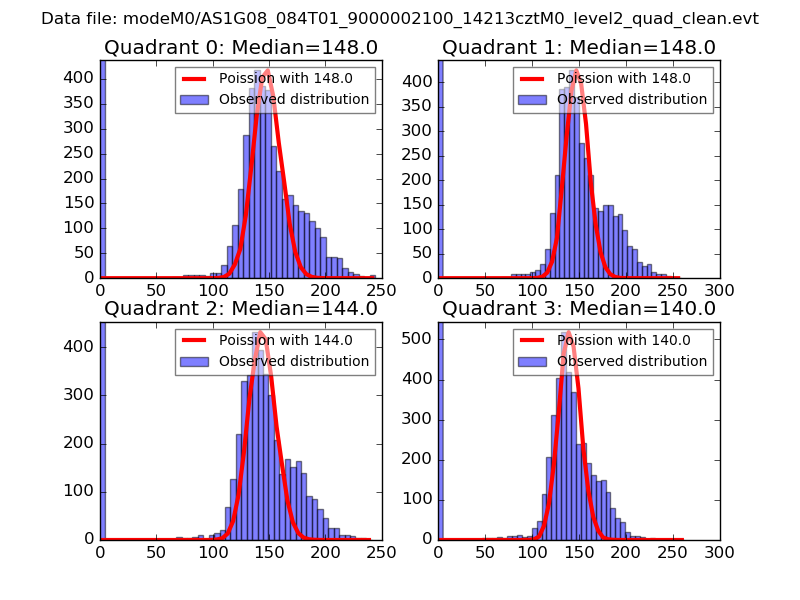 |
 |
| Quadrant-wise count rates Data is divided into 100 sec bins |
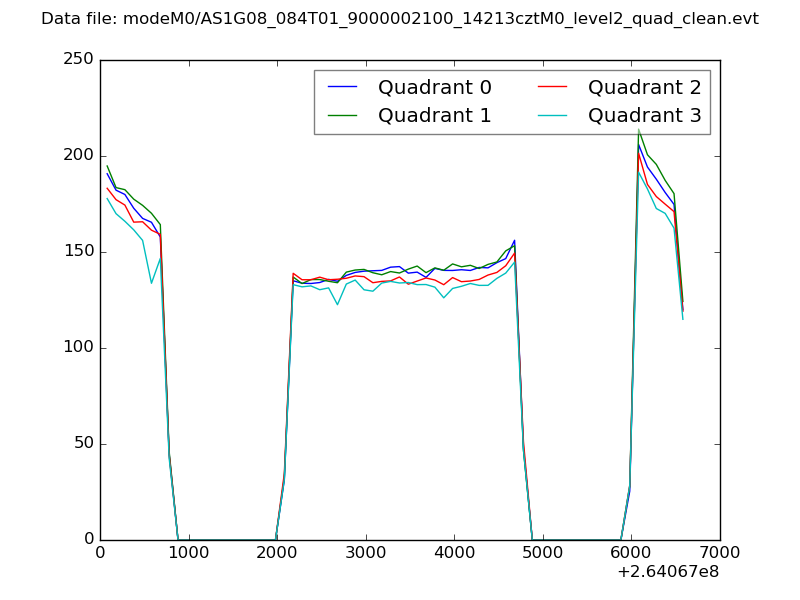 |
|
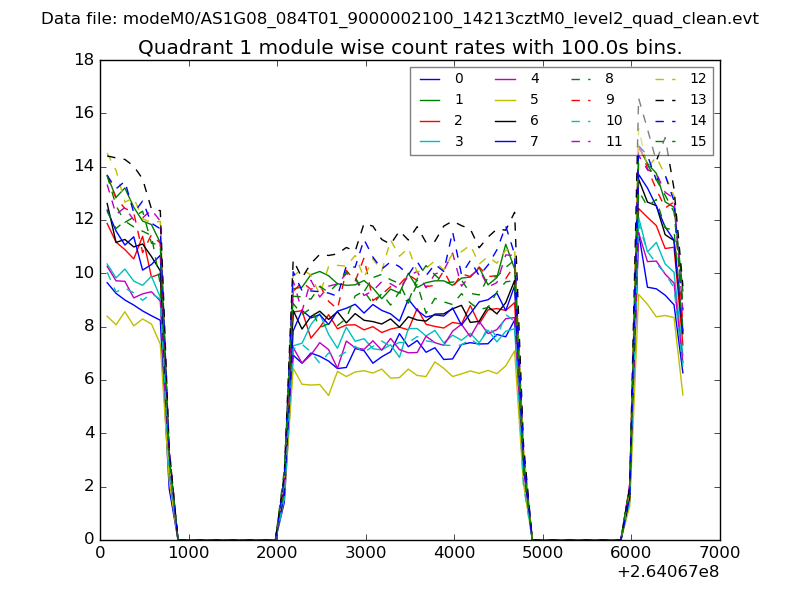
| Module-wise count rates for Quadrant A Data is divided into 100 sec bins |
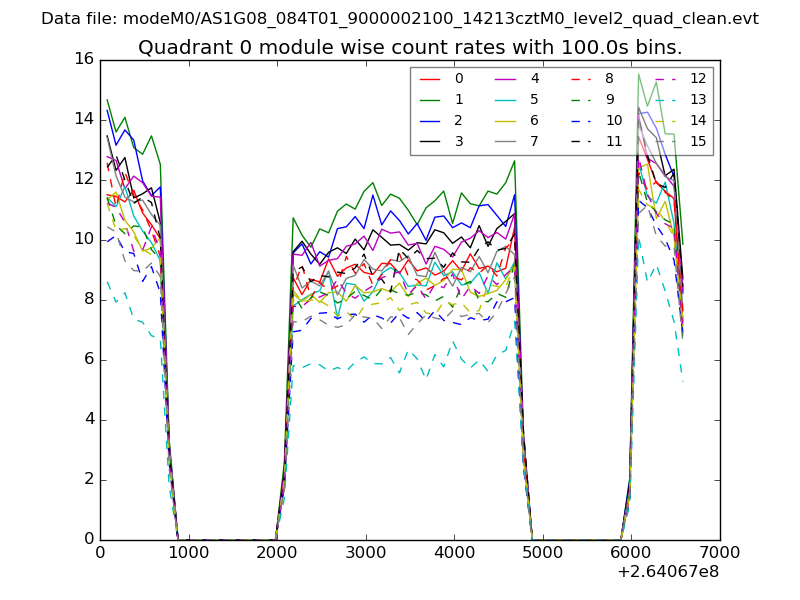 |
 |
| Module-wise count rates for Quadrant B Data is divided into 100 sec bins |
 |
 |
| Module-wise count rates for Quadrant C Data is divided into 100 sec bins |
 |
 |
| Module-wise count rates for Quadrant D Data is divided into 100 sec bins |
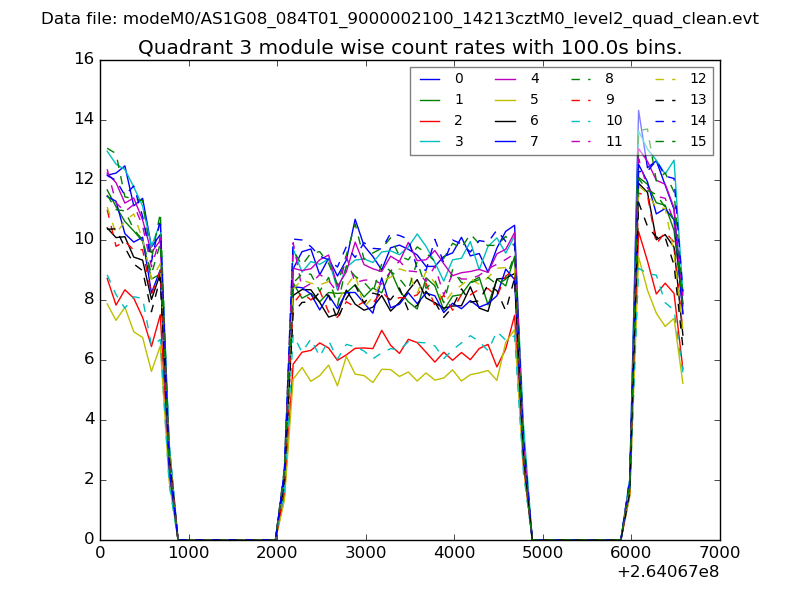 |
 |
| Parameter | Plot |
|---|---|
| CZT HV Monitor | 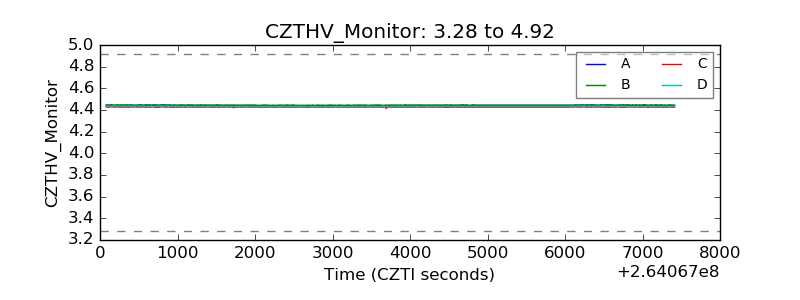 |
| D_VDD | 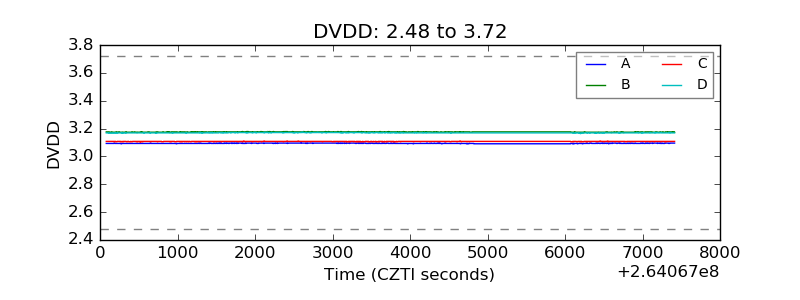 |
| Temperature 1 | 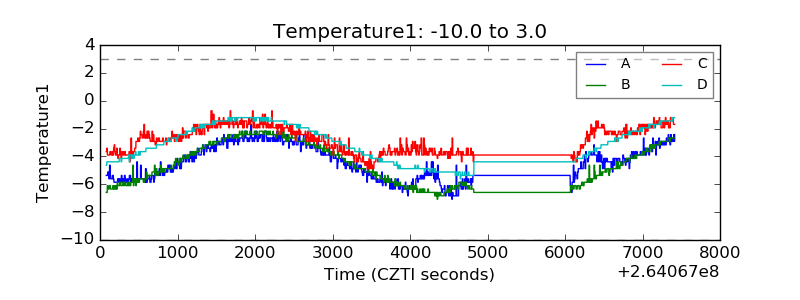 |
| Veto HV Monitor | 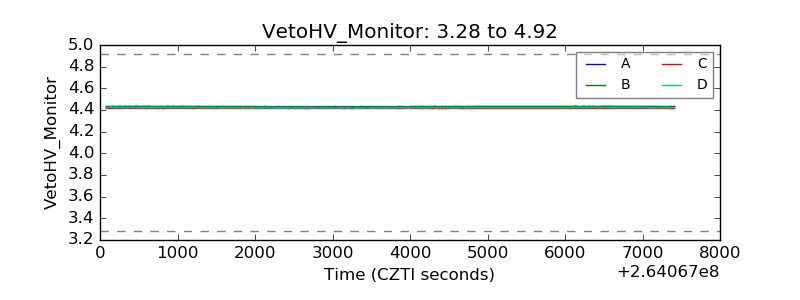 |
| Veto LLD | 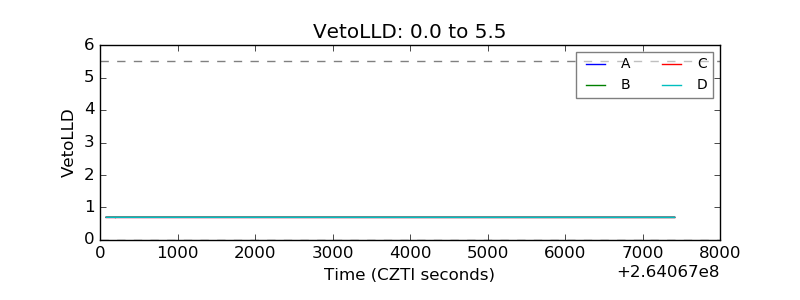 |
| Alpha Counter | 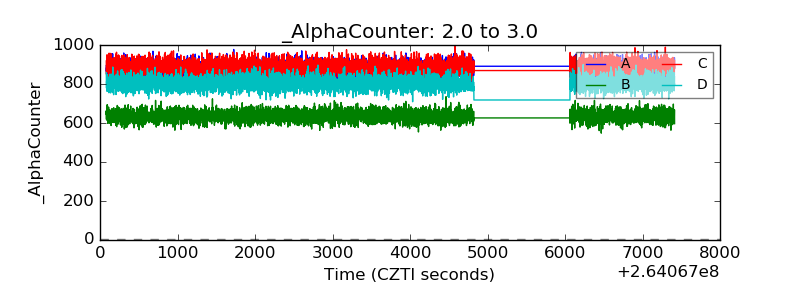 |
| _CPM_Rate | 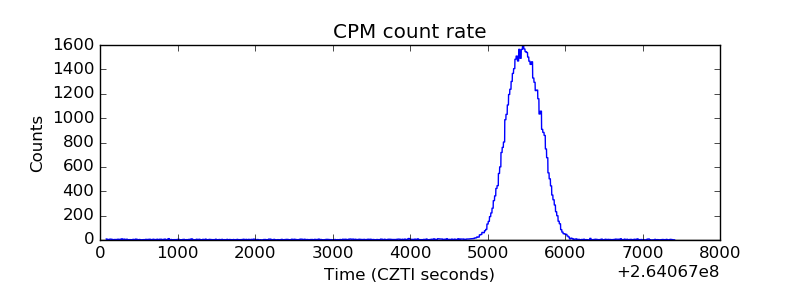 |
| CZT Counter | 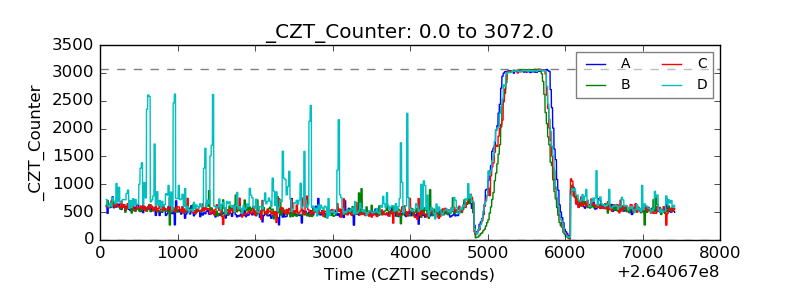 |
| +2.5 Volts monitor |  |
| +5 Volts monitor |  |
| _ROLL_ROT | 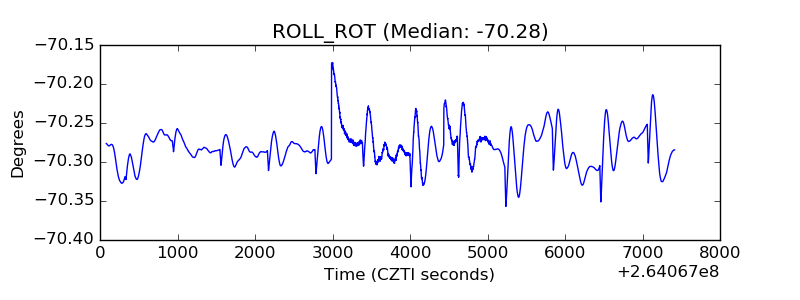 |
| _Roll_DEC | 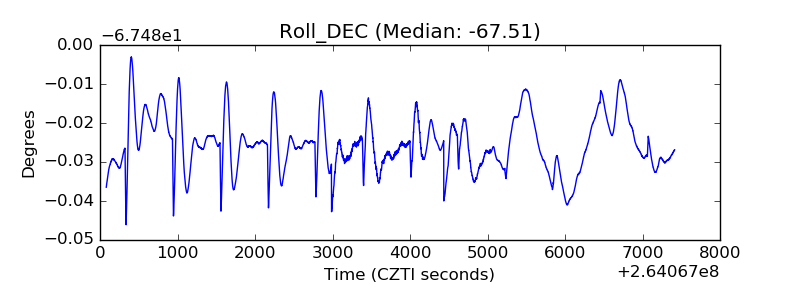 |
| _Roll_RA | 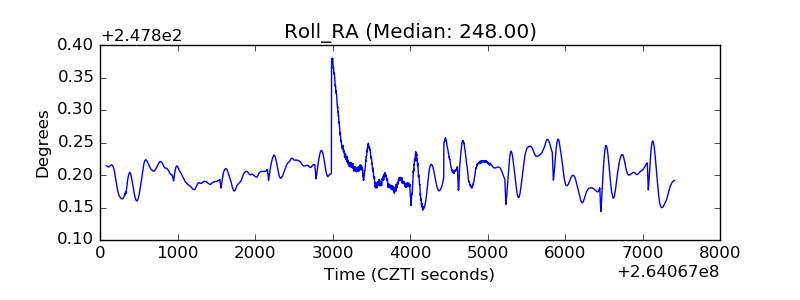 |
| Veto Counter | 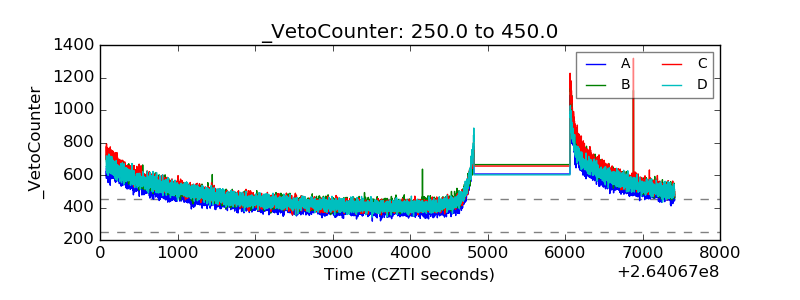 |