| Param | Original file | Final file |
|---|---|---|
| Filename | modeM0/AS1G08_084T01_9000002100_14214cztM0_level2.evt | modeM0/AS1G08_084T01_9000002100_14214cztM0_level2_quad_clean.evt |
| Size (bytes) | 568,186,560 | 91,837,440 |
| Size | 541.9 MB | 87.6 MB |
| Events in quadrant A | 3,619,823 | 594,232 |
| Events in quadrant B | 3,683,222 | 598,612 |
| Events in quadrant C | 3,594,936 | 579,553 |
| Events in quadrant D | 5,855,590 | 541,289 |
| Mode SS | |||
|---|---|---|---|
| Quadrant | BADHDUFLAG | Total packets | Discarded packets |
| A | 0 | 136 | 0 |
| B | 0 | 136 | 0 |
| C | 0 | 136 | 0 |
| D | 0 | 136 | 0 |
| Mode M0 | |||
|---|---|---|---|
| Quadrant | BADHDUFLAG | Total packets | Discarded packets |
| A | 0 | 14742 | 3 |
| B | 0 | 14956 | 2 |
| C | 0 | 14626 | 2 |
| D | 0 | 22105 | 2 |
| Mode M9 | |||
|---|---|---|---|
| Quadrant | BADHDUFLAG | Total packets | Discarded packets |
| A | 0 | 13 | 0 |
| B | 0 | 13 | 0 |
| C | 0 | 13 | 0 |
| D | 0 | 13 | 0 |
| Quadrant | Total seconds | Saturated seconds | Saturation percentage |
|---|---|---|---|
| A | 6702 | 127 | 1.894957% |
| B | 6702 | 152 | 2.267980% |
| C | 6702 | 94 | 1.402566% |
| D | 6703 | 460 | 6.862599% |
Noise dominated data is calculated using 1-second bins in cleaned event files. If a bin has >2000 counts, and if more than 50% of those come from <1% of pixels, then it is considered to be noise-dominated and hence unusable.
| Quadrant | # 1 sec bins | Bins with >0 counts | Bins with >2000 counts | High rate bins dominated by noise | Noise dominated (total time) | Noise dominated (detector-on time) | Marked lightcurve |
|---|---|---|---|---|---|---|---|
| A | 7993 | 6704 | 5 | 5 | 0.06% | 0.07% | 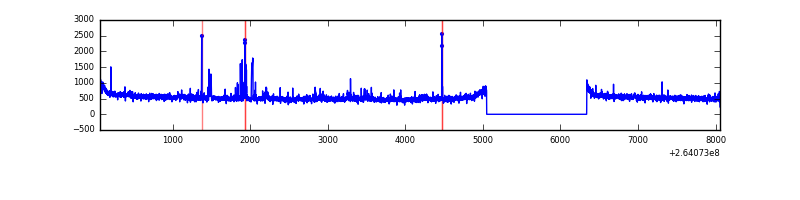 |
| B | 7993 | 6703 | 10 | 10 | 0.13% | 0.15% | 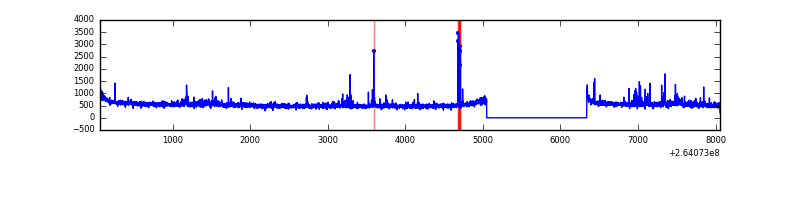 |
| C | 7993 | 6704 | 1 | 1 | 0.01% | 0.01% | 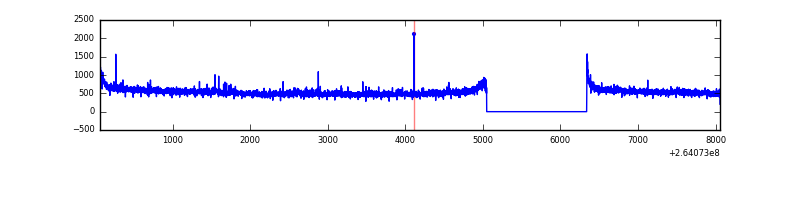 |
| D | 7994 | 6705 | 281 | 281 | 3.52% | 4.19% | 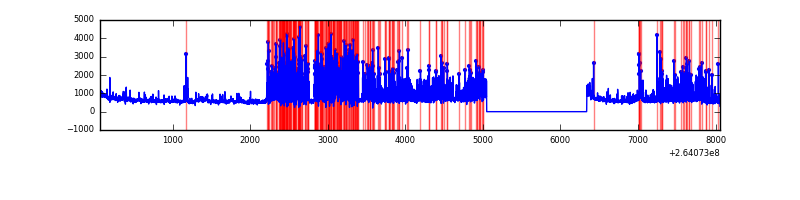 |
Top three noisy pixels from each quadrant. If the there are fewer than three noisy pixels in the level2.evt file, extra rows are filled as -1
| Pixel properties | Quadrant properties | ||||||
|---|---|---|---|---|---|---|---|
| Quadrant | DetID | PixID | Counts | Sigma | Mean | Median | Sigma |
| A | 12 | 189 | 78692 | 446.98 | 883 | 866 | 174.1 |
| A | 8 | 15 | 58633 | 331.77 | 883 | 866 | 174.1 |
| A | 9 | 143 | 53226 | 300.72 | 883 | 866 | 174.1 |
| B | 0 | 229 | 68807 | 423.7 | 874 | 855 | 160.4 |
| B | 4 | 97 | 49715 | 304.66 | 874 | 855 | 160.4 |
| B | 0 | 219 | 41869 | 255.73 | 874 | 855 | 160.4 |
| C | 3 | 233 | 280034 | 1466.71 | 849 | 855 | 190.3 |
| C | 13 | 61 | 6082 | 27.46 | 849 | 855 | 190.3 |
| C | 14 | 234 | 4252 | 17.85 | 849 | 855 | 190.3 |
| D | 5 | 222 | 1957399 | 9991.68 | 838 | 817 | 195.8 |
| D | 8 | 195 | 508471 | 2592.44 | 838 | 817 | 195.8 |
| D | 10 | 199 | 137670 | 698.87 | 838 | 817 | 195.8 |
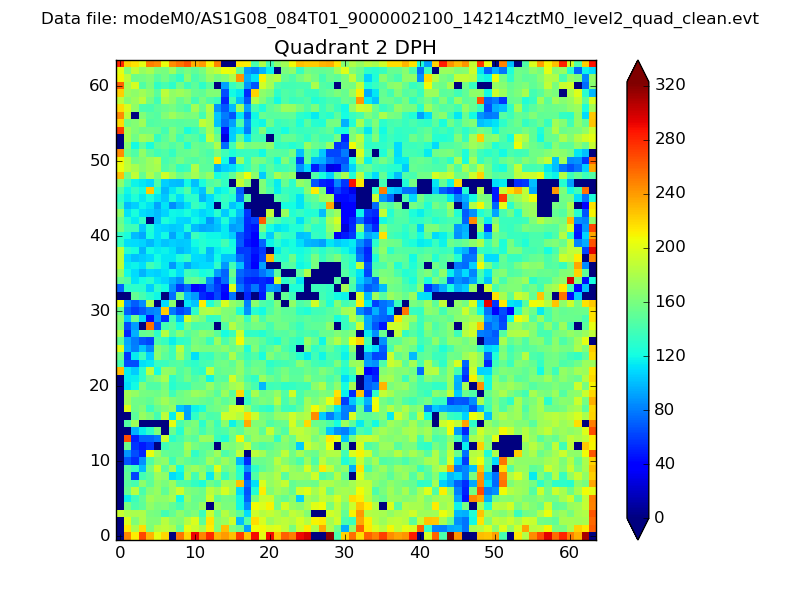
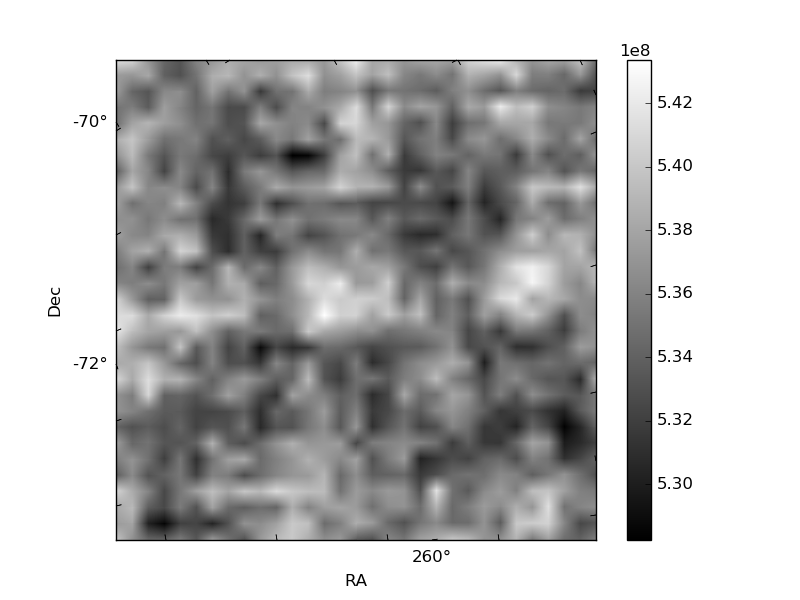
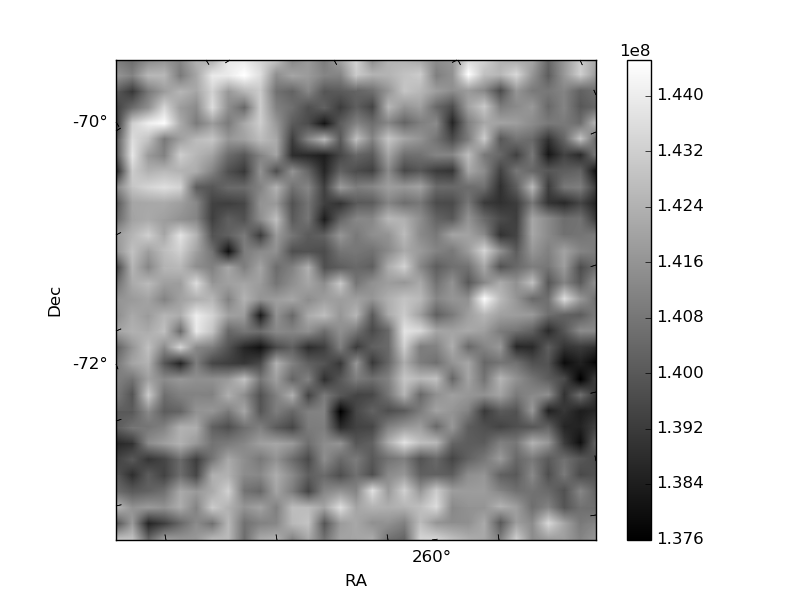
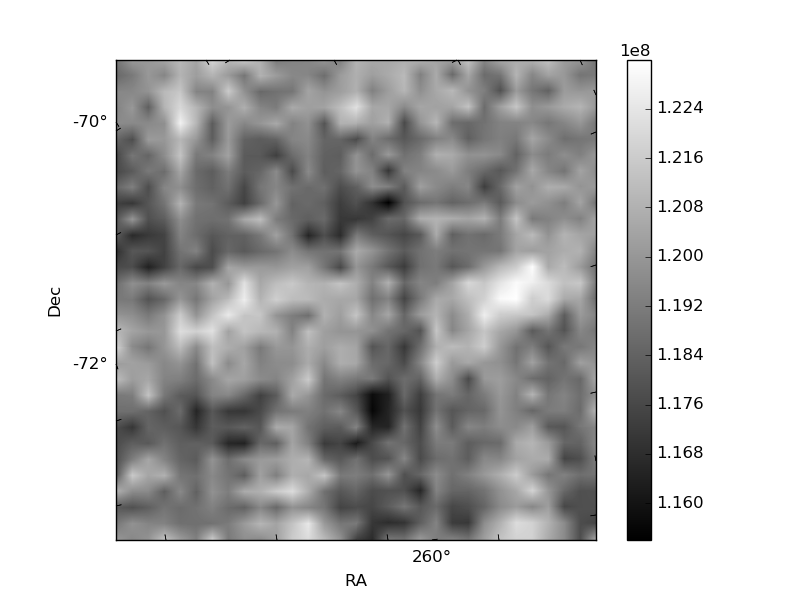
Histogram calculated using DETX and DETY for each event in the final _common_clean file
| Quadrant A | 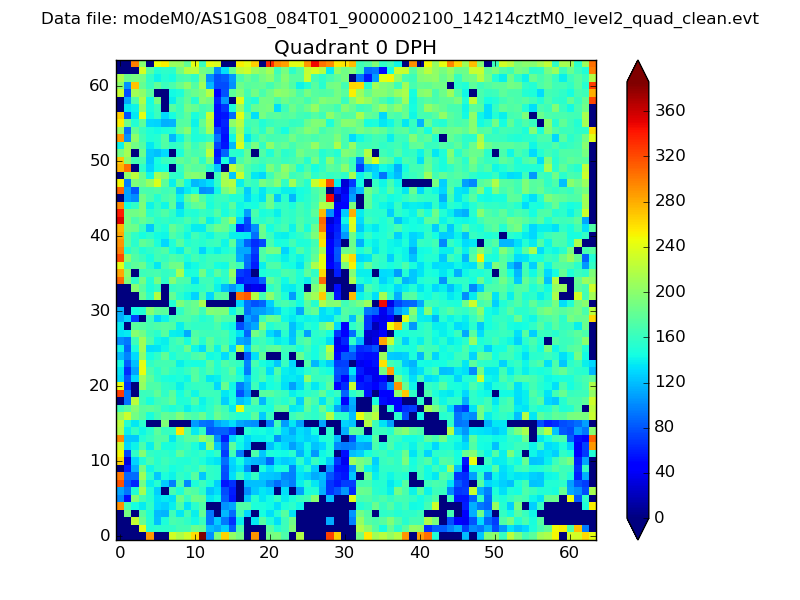 |
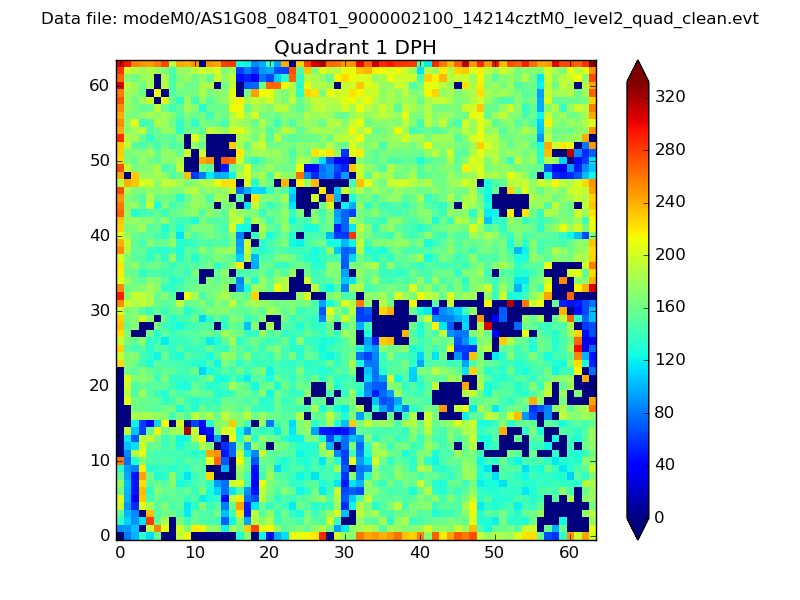 |
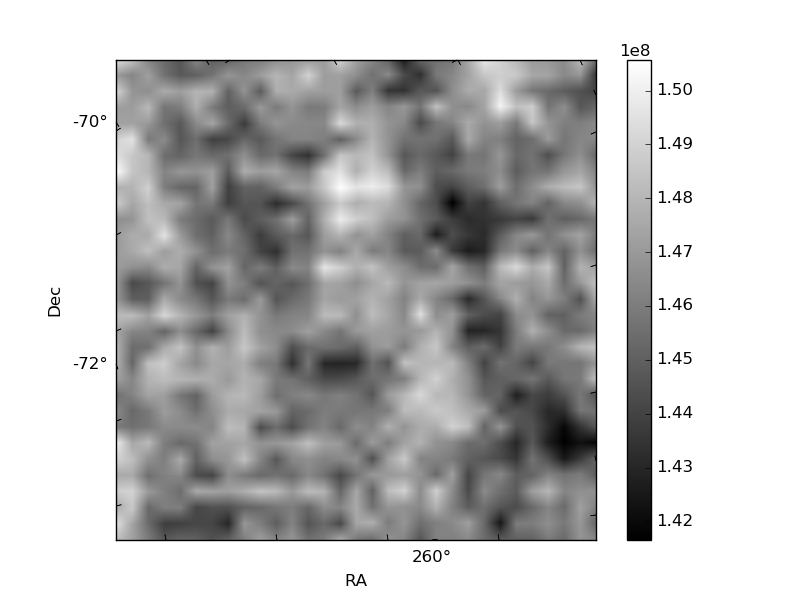
Quadrant B |
|---|---|---|---|
| Quadrant D | 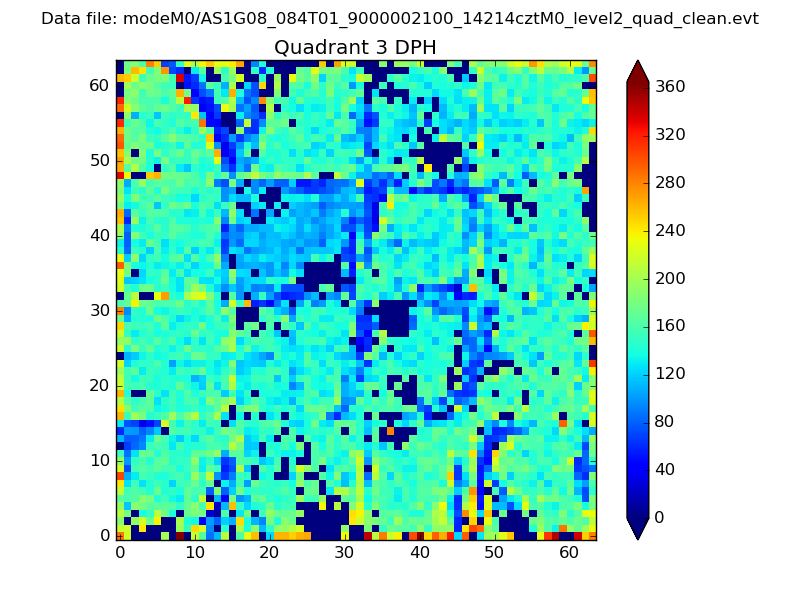 |
 |
Quadrant C |
| Plot type | Count rate plots | Images |
|---|---|---|
| Comparison with Poisson distribution Blue bars denote a histogram of data divided into 1 sec bins. Red curve is a Poisson curve with rate = median count rate of data. |
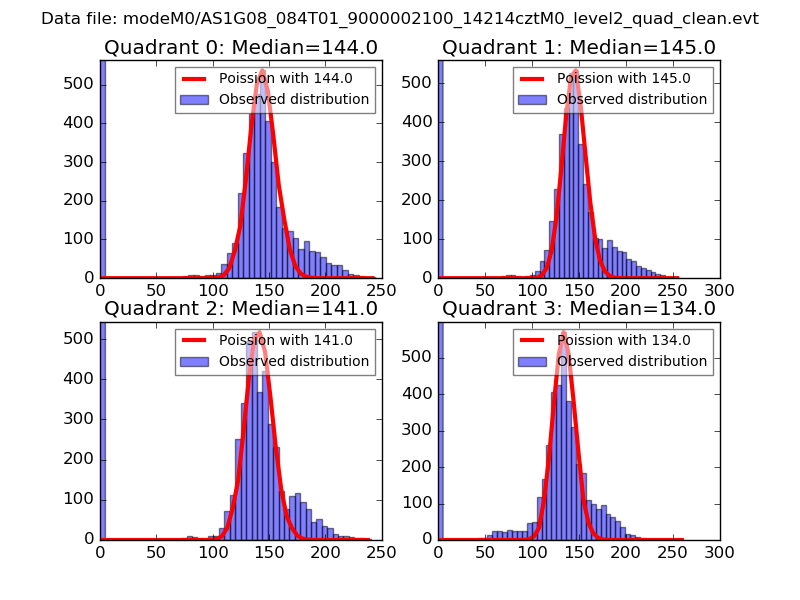 |
 |
| Quadrant-wise count rates Data is divided into 100 sec bins |
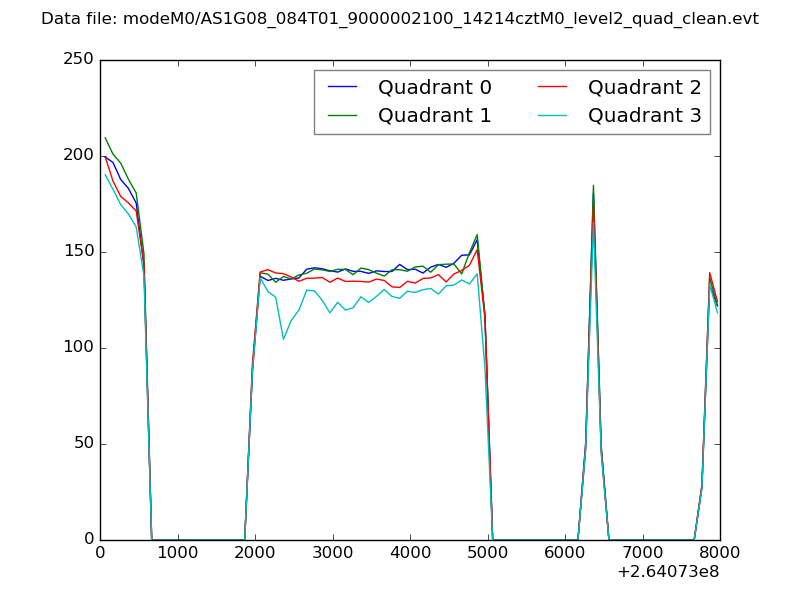 |
|
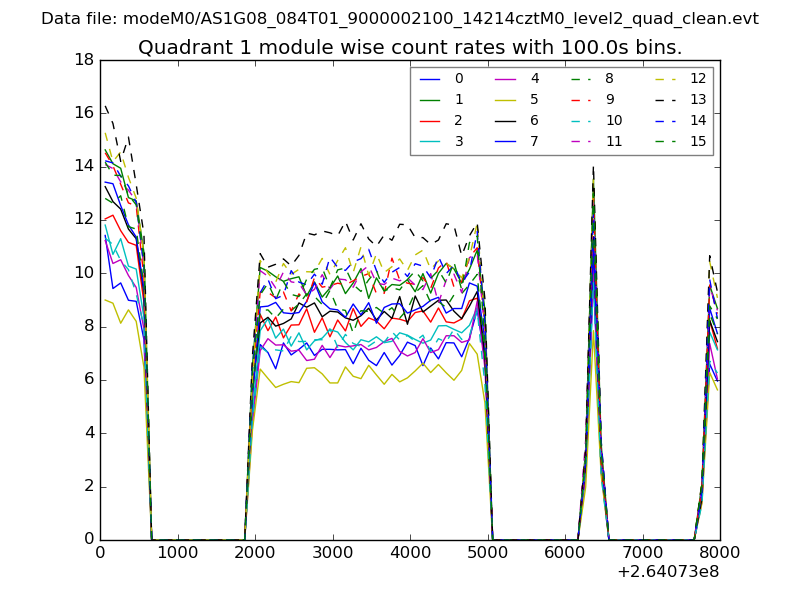
| Module-wise count rates for Quadrant A Data is divided into 100 sec bins |
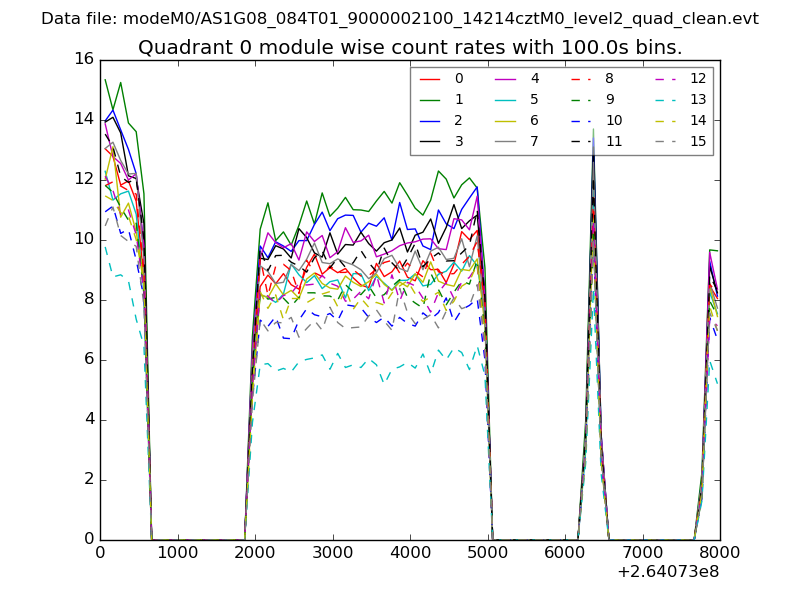 |
 |
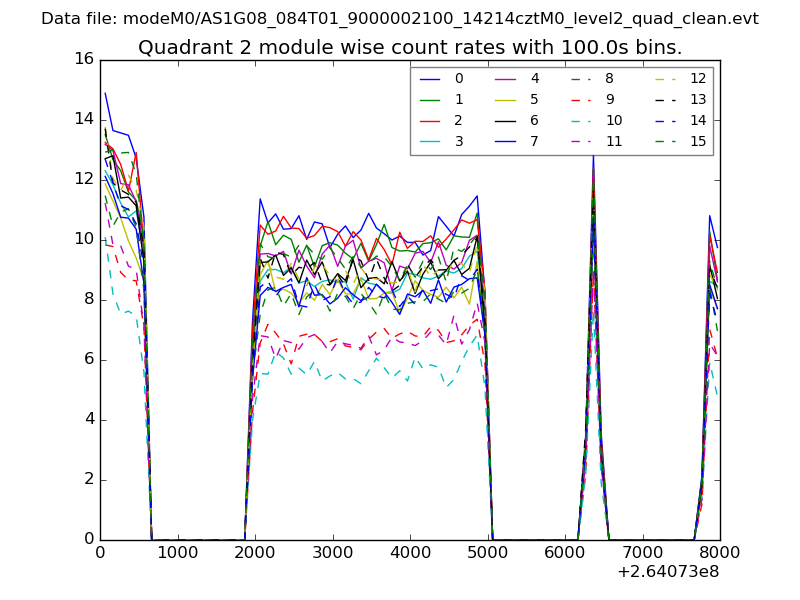
| Module-wise count rates for Quadrant B Data is divided into 100 sec bins |
 |
 |
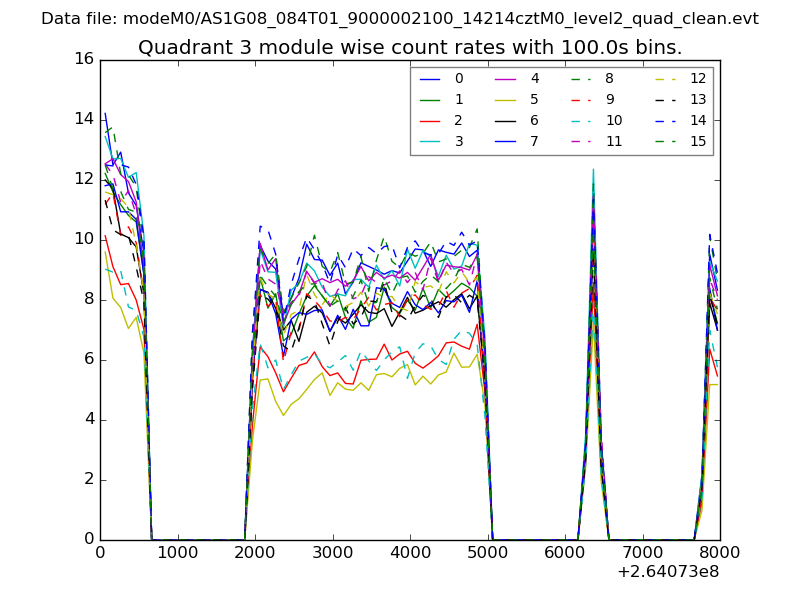
| Module-wise count rates for Quadrant C Data is divided into 100 sec bins |
 |
 |
| Module-wise count rates for Quadrant D Data is divided into 100 sec bins |
 |
 |
| Parameter | Plot |
|---|---|
| CZT HV Monitor | 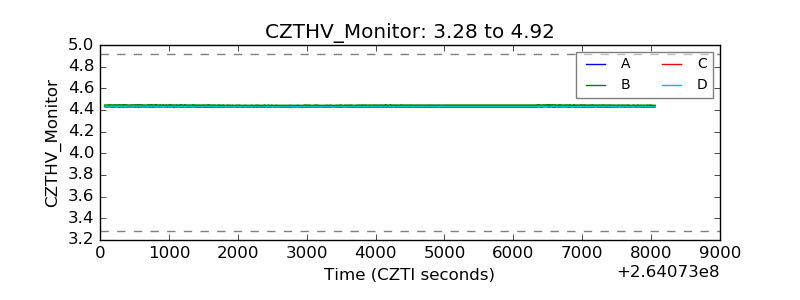 |
| D_VDD | 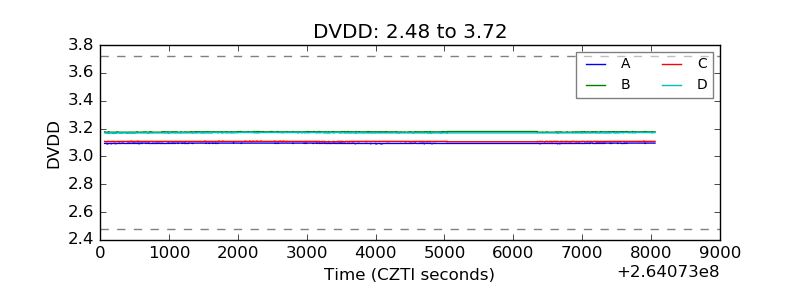 |
| Temperature 1 | 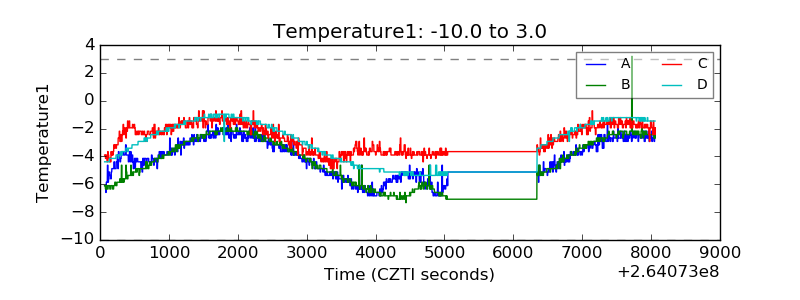 |
| Veto HV Monitor |  |
| Veto LLD | 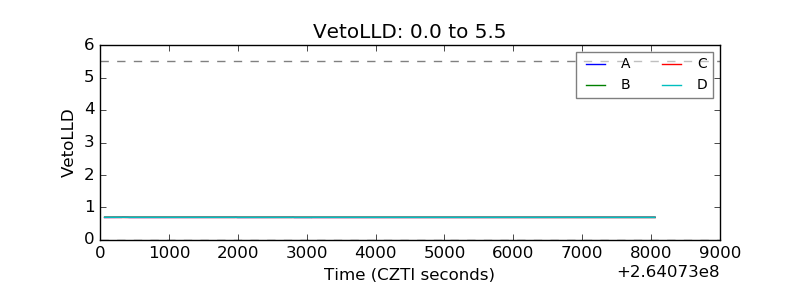 |
| Alpha Counter | 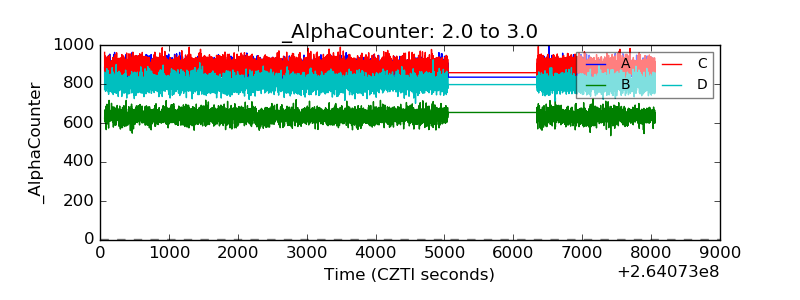 |
| _CPM_Rate | 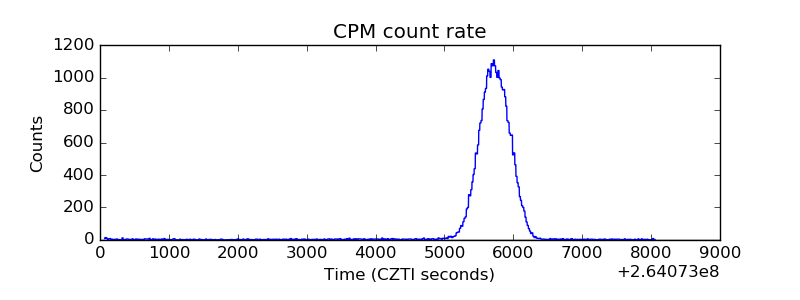 |
| CZT Counter | 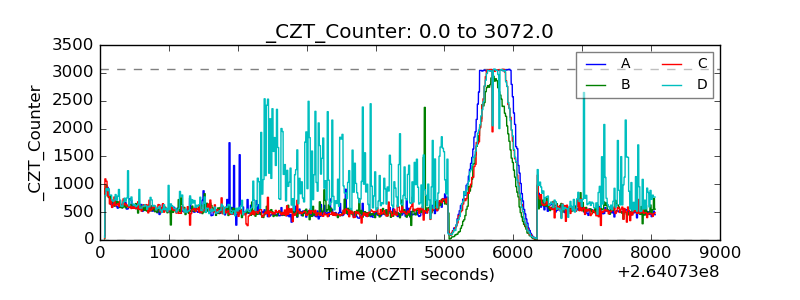 |
| +2.5 Volts monitor |  |
| +5 Volts monitor |  |
| _ROLL_ROT | 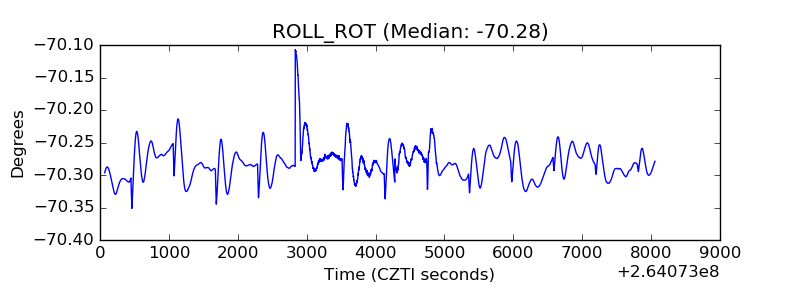 |
| _Roll_DEC | 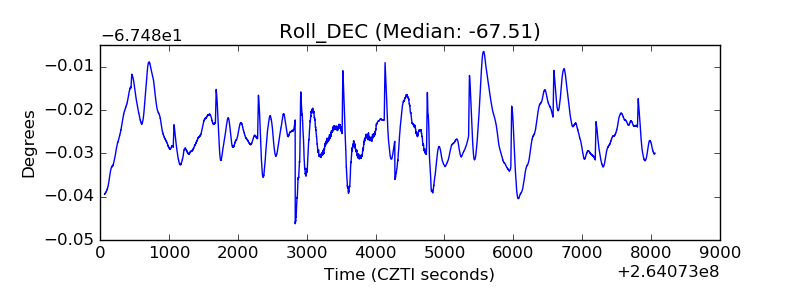 |
| _Roll_RA | 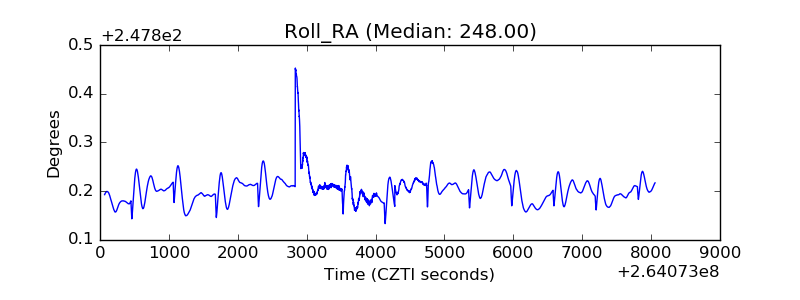 |
| Veto Counter | 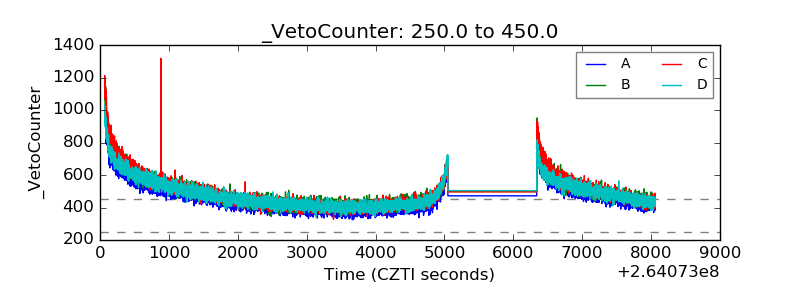 |