| Param | Original file | Final file |
|---|---|---|
| Filename | modeM0/AS1G08_084T01_9000002100_14216cztM0_level2.evt | modeM0/AS1G08_084T01_9000002100_14216cztM0_level2_quad_clean.evt |
| Size (bytes) | 504,236,160 | 103,982,400 |
| Size | 480.9 MB | 99.2 MB |
| Events in quadrant A | 3,035,978 | 695,015 |
| Events in quadrant B | 3,376,455 | 695,738 |
| Events in quadrant C | 3,331,186 | 673,480 |
| Events in quadrant D | 5,108,470 | 654,196 |
| Mode SS | |||
|---|---|---|---|
| Quadrant | BADHDUFLAG | Total packets | Discarded packets |
| A | 0 | 126 | 0 |
| B | 0 | 126 | 0 |
| C | 0 | 126 | 0 |
| D | 0 | 126 | 0 |
| Mode M0 | |||
|---|---|---|---|
| Quadrant | BADHDUFLAG | Total packets | Discarded packets |
| A | 0 | 12976 | 2 |
| B | 0 | 13884 | 1 |
| C | 0 | 13662 | 1 |
| D | 0 | 19672 | 1 |
| Mode M9 | |||
|---|---|---|---|
| Quadrant | BADHDUFLAG | Total packets | Discarded packets |
| A | 0 | 9 | 0 |
| B | 0 | 9 | 0 |
| C | 0 | 9 | 0 |
| D | 0 | 9 | 0 |
| Quadrant | Total seconds | Saturated seconds | Saturation percentage |
|---|---|---|---|
| A | 6171 | 125 | 2.025604% |
| B | 6171 | 186 | 3.014098% |
| C | 6171 | 86 | 1.393615% |
| D | 6171 | 459 | 7.438017% |
Noise dominated data is calculated using 1-second bins in cleaned event files. If a bin has >2000 counts, and if more than 50% of those come from <1% of pixels, then it is considered to be noise-dominated and hence unusable.
| Quadrant | # 1 sec bins | Bins with >0 counts | Bins with >2000 counts | High rate bins dominated by noise | Noise dominated (total time) | Noise dominated (detector-on time) | Marked lightcurve |
|---|---|---|---|---|---|---|---|
| A | 7032 | 6173 | 14 | 14 | 0.20% | 0.23% | 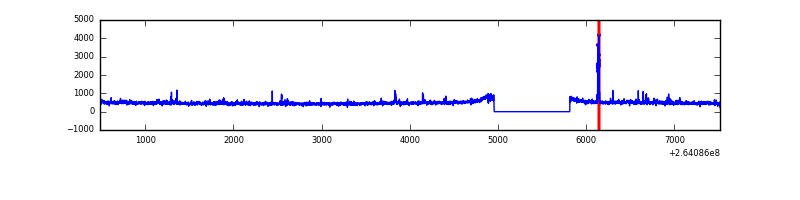 |
| B | 7032 | 6173 | 48 | 48 | 0.68% | 0.78% | 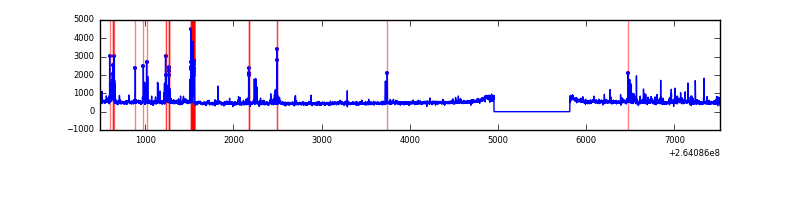 |
| C | 7032 | 6173 | 0 | 0 | 0.00% | 0.00% | 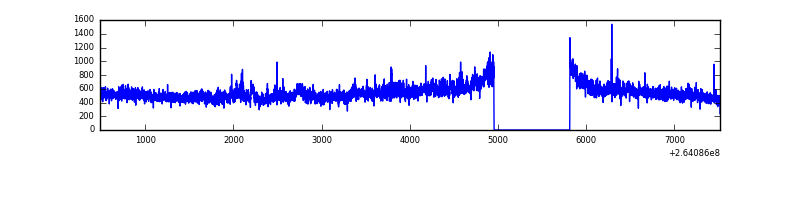 |
| D | 7032 | 6173 | 202 | 202 | 2.87% | 3.27% | 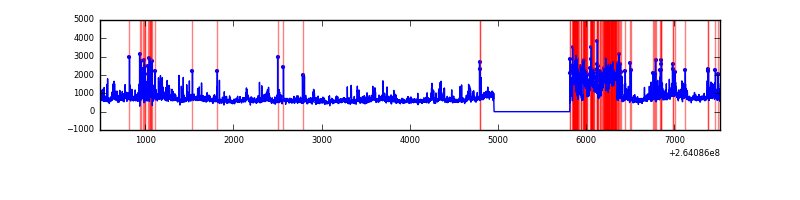 |
Top three noisy pixels from each quadrant. If the there are fewer than three noisy pixels in the level2.evt file, extra rows are filled as -1
| Pixel properties | Quadrant properties | ||||||
|---|---|---|---|---|---|---|---|
| Quadrant | DetID | PixID | Counts | Sigma | Mean | Median | Sigma |
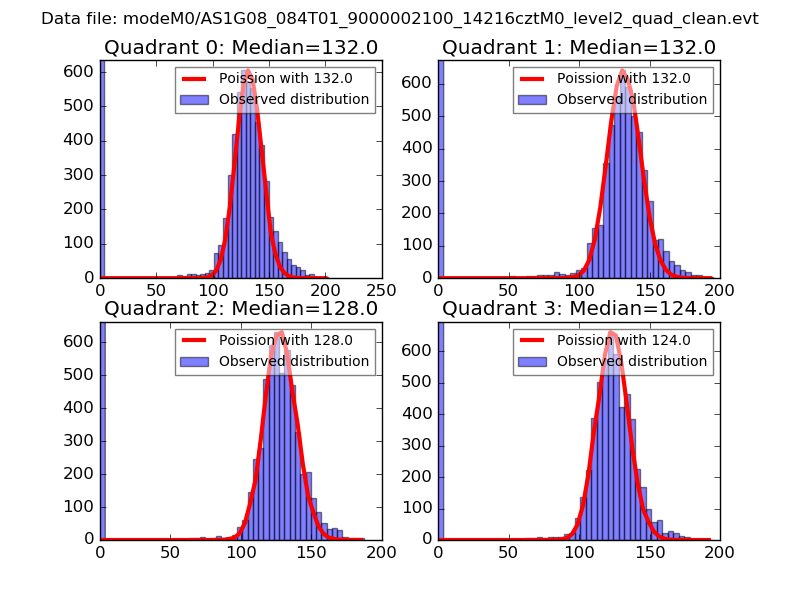
| A | 12 | 189 | 69238 | 455.32 | 740 | 725 | 150.5 |
| A | 15 | 222 | 49509 | 324.21 | 740 | 725 | 150.5 |
| A | 8 | 15 | 33205 | 215.86 | 740 | 725 | 150.5 |
| B | 0 | 229 | 233111 | 1667.2 | 736 | 717 | 139.4 |
| B | 4 | 97 | 78486 | 557.92 | 736 | 717 | 139.4 |
| B | 0 | 219 | 65961 | 468.06 | 736 | 717 | 139.4 |
| C | 3 | 233 | 540323 | 3312.56 | 712 | 716 | 162.9 |
| C | 0 | 207 | 9208 | 52.13 | 712 | 716 | 162.9 |
| C | 13 | 61 | 5217 | 27.63 | 712 | 716 | 162.9 |
| D | 5 | 222 | 782041 | 4649.86 | 695 | 677 | 168.0 |
| D | 13 | 122 | 725456 | 4313.13 | 695 | 677 | 168.0 |
| D | 8 | 195 | 707428 | 4205.84 | 695 | 677 | 168.0 |
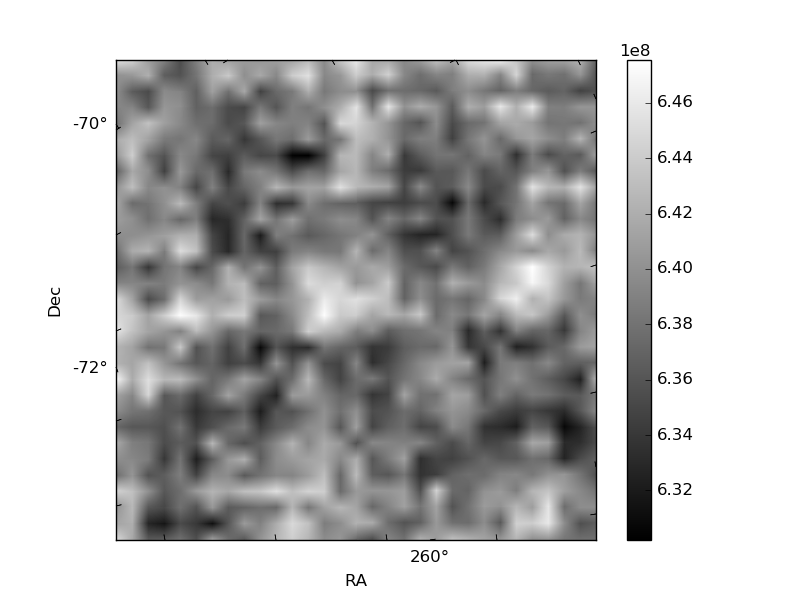
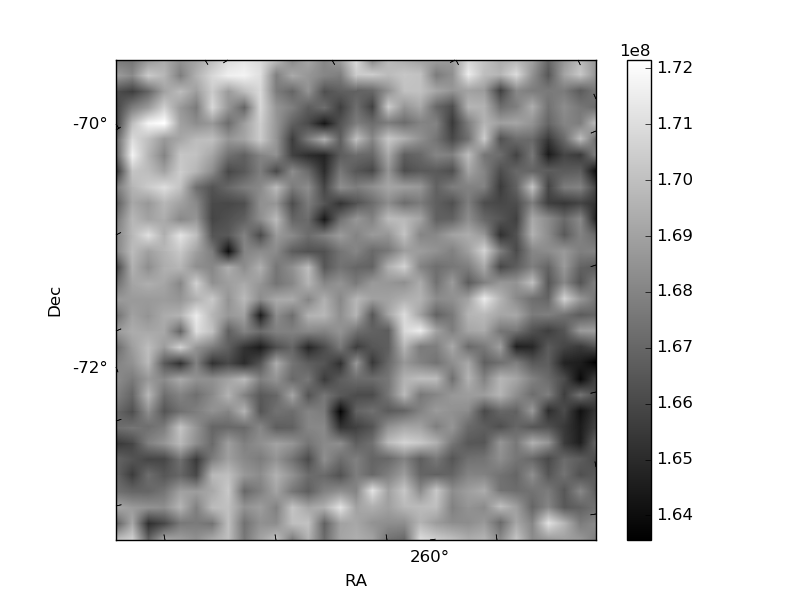
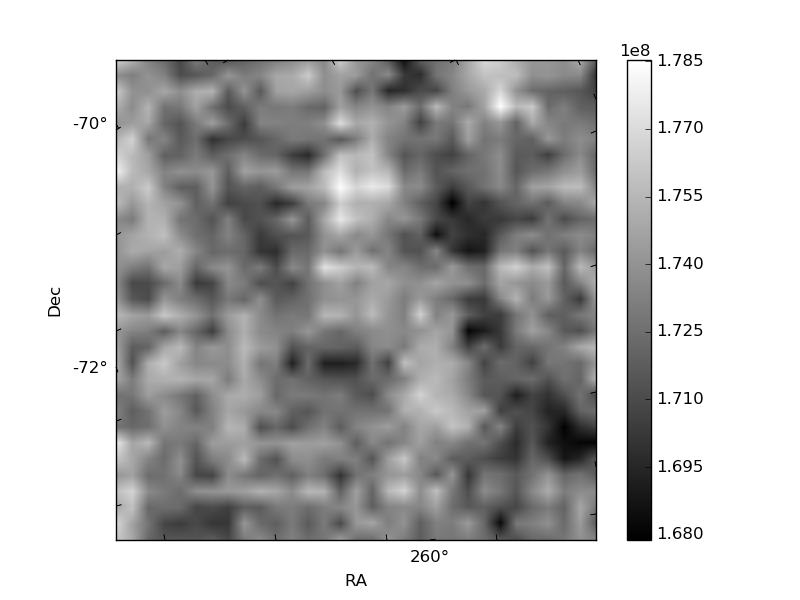
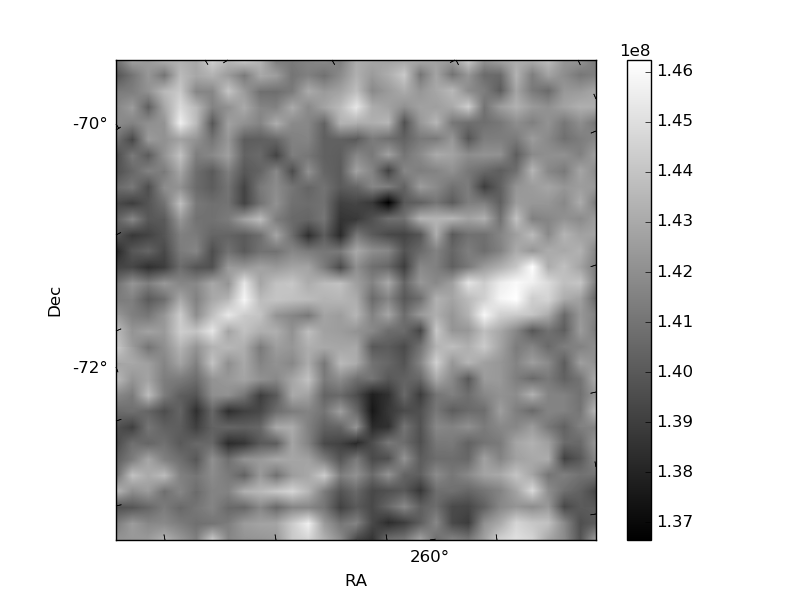
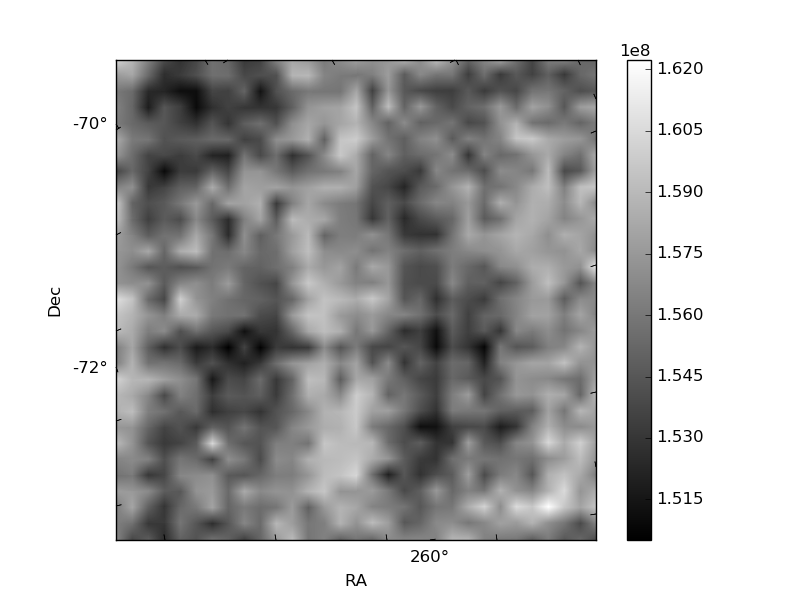
Histogram calculated using DETX and DETY for each event in the final _common_clean file
| Quadrant A | 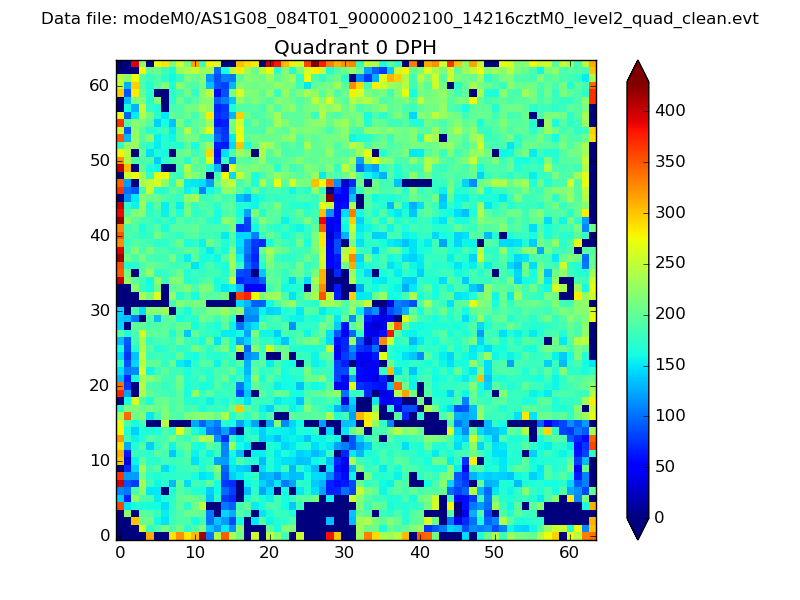 |
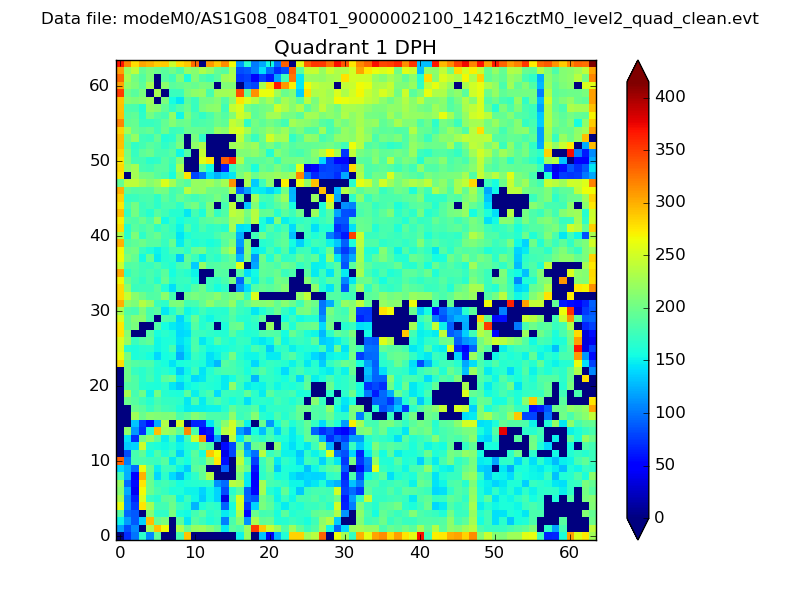 |
Quadrant B |
|---|---|---|---|
| Quadrant D | 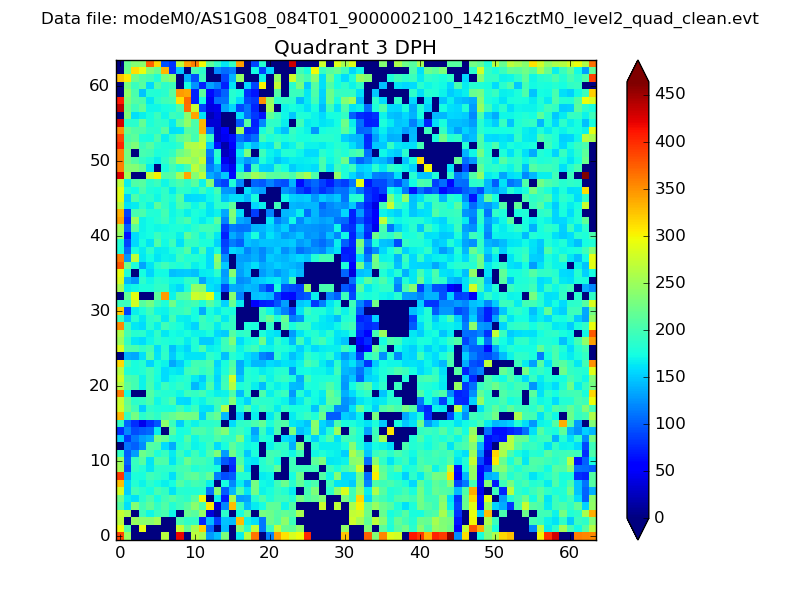 |
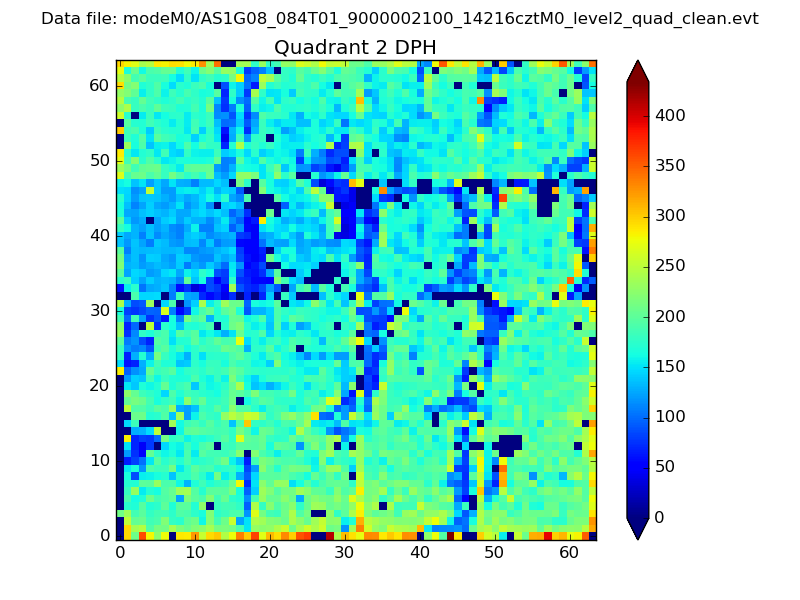 |
Quadrant C |
| Plot type | Count rate plots | Images |
|---|---|---|
| Comparison with Poisson distribution Blue bars denote a histogram of data divided into 1 sec bins. Red curve is a Poisson curve with rate = median count rate of data. |
 |
 |
| Quadrant-wise count rates Data is divided into 100 sec bins |
 |
|
| Module-wise count rates for Quadrant A Data is divided into 100 sec bins |
 |
 |
| Module-wise count rates for Quadrant B Data is divided into 100 sec bins |
 |
 |
| Module-wise count rates for Quadrant C Data is divided into 100 sec bins |
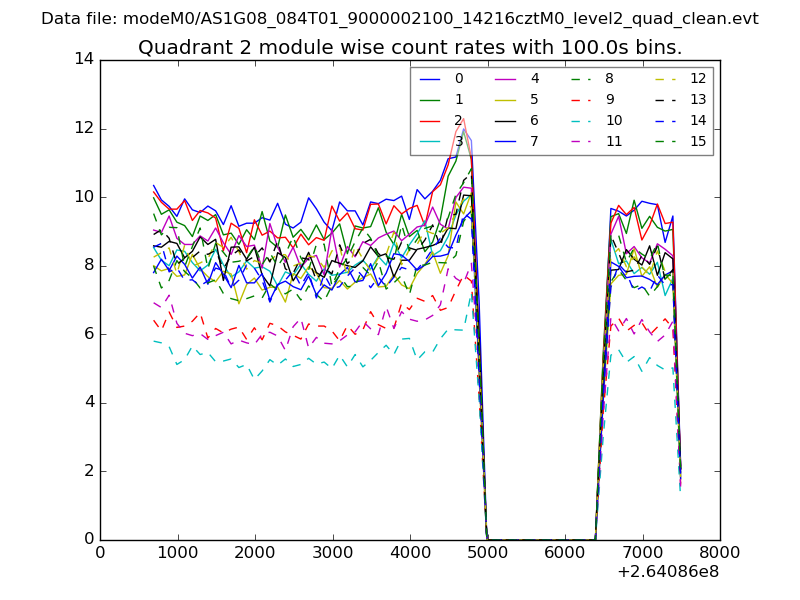 |
 |
| Module-wise count rates for Quadrant D Data is divided into 100 sec bins |
 |
 |
| Parameter | Plot |
|---|---|
| CZT HV Monitor |  |
| D_VDD | 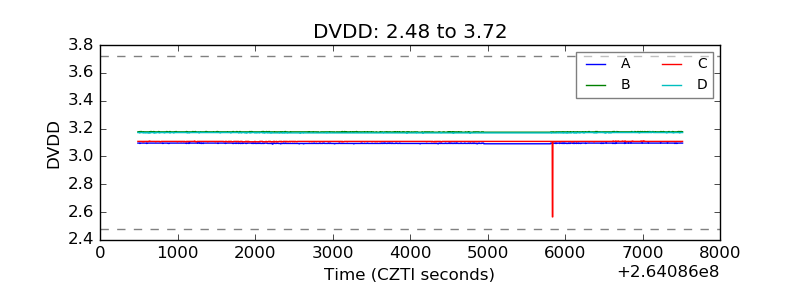 |
| Temperature 1 | 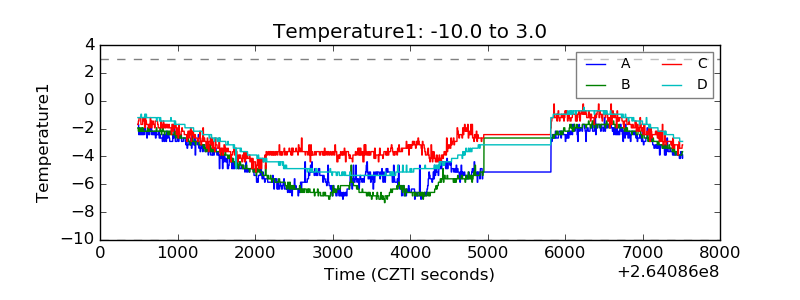 |
| Veto HV Monitor | 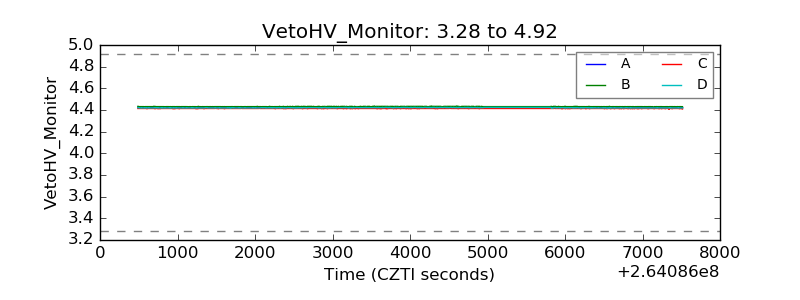 |
| Veto LLD | 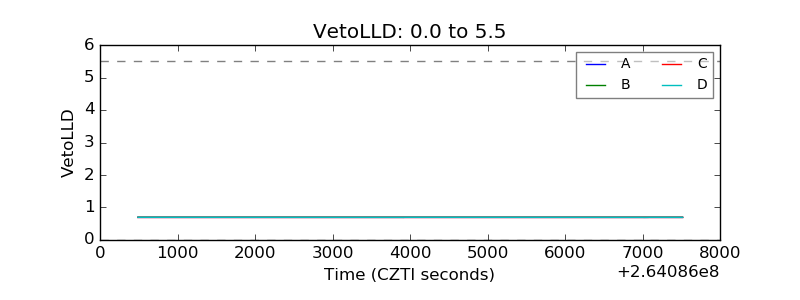 |
| Alpha Counter | 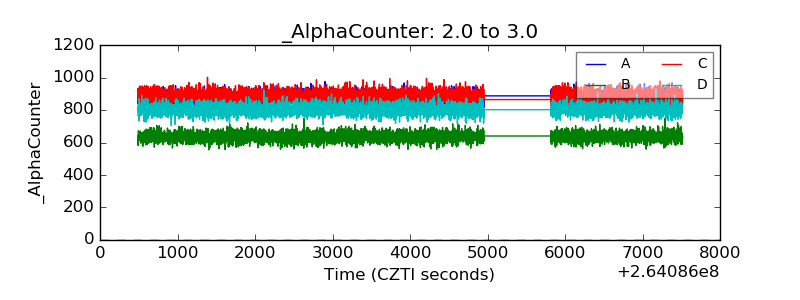 |
| _CPM_Rate |  |
| CZT Counter | 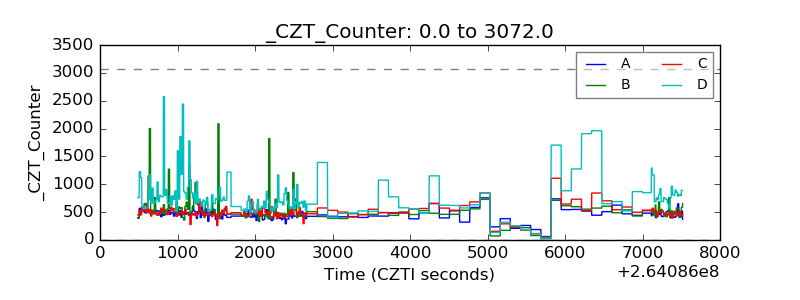 |
| +2.5 Volts monitor |  |
| +5 Volts monitor |  |
| _ROLL_ROT |  |
| _Roll_DEC | 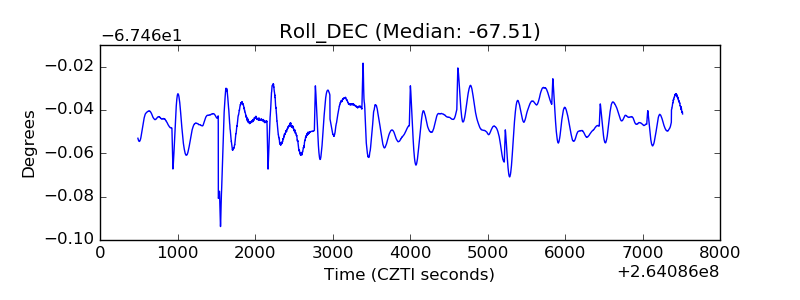 |
| _Roll_RA | 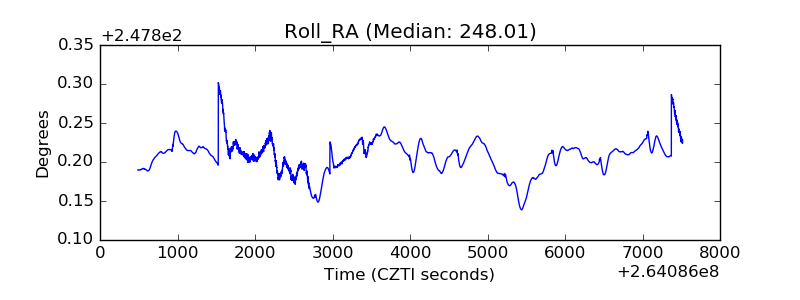 |
| Veto Counter |  |