| Param | Original file | Final file |
|---|---|---|
| Filename | modeM0/AS1G08_084T01_9000002100_14217cztM0_level2.evt | modeM0/AS1G08_084T01_9000002100_14217cztM0_level2_quad_clean.evt |
| Size (bytes) | 494,447,040 | 109,791,360 |
| Size | 471.5 MB | 104.7 MB |
| Events in quadrant A | 3,196,330 | 731,111 |
| Events in quadrant B | 3,382,928 | 735,207 |
| Events in quadrant C | 3,348,518 | 712,070 |
| Events in quadrant D | 4,598,715 | 686,508 |
| Mode SS | |||
|---|---|---|---|
| Quadrant | BADHDUFLAG | Total packets | Discarded packets |
| A | 0 | 134 | 0 |
| B | 0 | 134 | 0 |
| C | 0 | 134 | 0 |
| D | 0 | 134 | 0 |
| Mode M0 | |||
|---|---|---|---|
| Quadrant | BADHDUFLAG | Total packets | Discarded packets |
| A | 0 | 13768 | 6 |
| B | 0 | 14263 | 3 |
| C | 0 | 14095 | 6 |
| D | 0 | 18226 | 18 |
| Mode M9 | |||
|---|---|---|---|
| Quadrant | BADHDUFLAG | Total packets | Discarded packets |
| A | 0 | 5 | 0 |
| B | 0 | 5 | 0 |
| C | 0 | 5 | 0 |
| D | 0 | 5 | 0 |
| Quadrant | Total seconds | Saturated seconds | Saturation percentage |
|---|---|---|---|
| A | 6601 | 64 | 0.969550% |
| B | 6602 | 78 | 1.181460% |
| C | 6601 | 35 | 0.530223% |
| D | 6598 | 119 | 1.803577% |
Noise dominated data is calculated using 1-second bins in cleaned event files. If a bin has >2000 counts, and if more than 50% of those come from <1% of pixels, then it is considered to be noise-dominated and hence unusable.
| Quadrant | # 1 sec bins | Bins with >0 counts | Bins with >2000 counts | High rate bins dominated by noise | Noise dominated (total time) | Noise dominated (detector-on time) | Marked lightcurve |
|---|---|---|---|---|---|---|---|
| A | 7119 | 6604 | 2 | 2 | 0.03% | 0.03% | 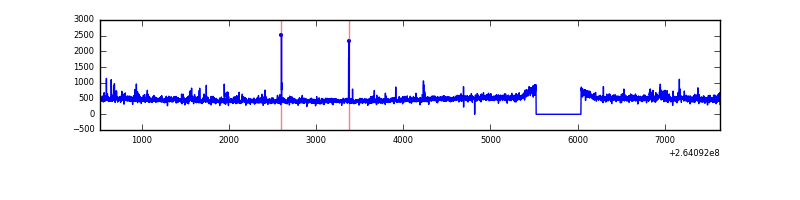 |
| B | 7119 | 6605 | 2 | 2 | 0.03% | 0.03% | 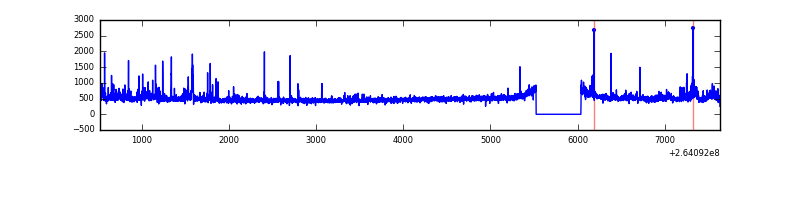 |
| C | 7119 | 6605 | 1 | 1 | 0.01% | 0.02% | 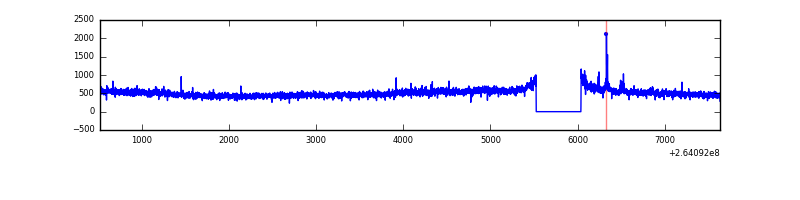 |
| D | 7119 | 6605 | 68 | 68 | 0.96% | 1.03% | 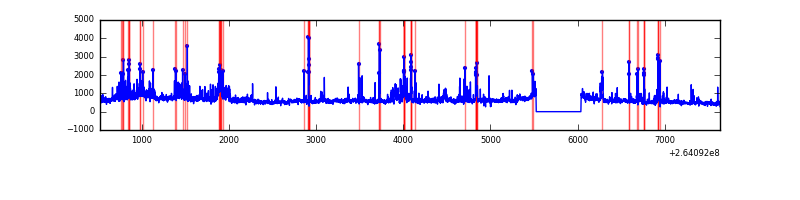 |
Top three noisy pixels from each quadrant. If the there are fewer than three noisy pixels in the level2.evt file, extra rows are filled as -1
| Pixel properties | Quadrant properties | ||||||
|---|---|---|---|---|---|---|---|
| Quadrant | DetID | PixID | Counts | Sigma | Mean | Median | Sigma |
| A | 12 | 189 | 87962 | 555.64 | 777 | 762 | 156.9 |
| A | 8 | 15 | 74257 | 468.31 | 777 | 762 | 156.9 |
| A | 2 | 79 | 12570 | 75.24 | 777 | 762 | 156.9 |
| B | 0 | 229 | 66400 | 445.14 | 779 | 760 | 147.5 |
| B | 4 | 97 | 65943 | 442.04 | 779 | 760 | 147.5 |
| B | 0 | 219 | 59724 | 399.87 | 779 | 760 | 147.5 |
| C | 3 | 233 | 392020 | 2257.16 | 750 | 754 | 173.3 |
| C | 0 | 207 | 26796 | 150.23 | 750 | 754 | 173.3 |
| C | 13 | 61 | 5515 | 27.46 | 750 | 754 | 173.3 |
| D | 8 | 195 | 745946 | 4071.82 | 741 | 721 | 183.0 |
| D | 5 | 222 | 512482 | 2796.2 | 741 | 721 | 183.0 |
| D | 13 | 122 | 223449 | 1216.96 | 741 | 721 | 183.0 |
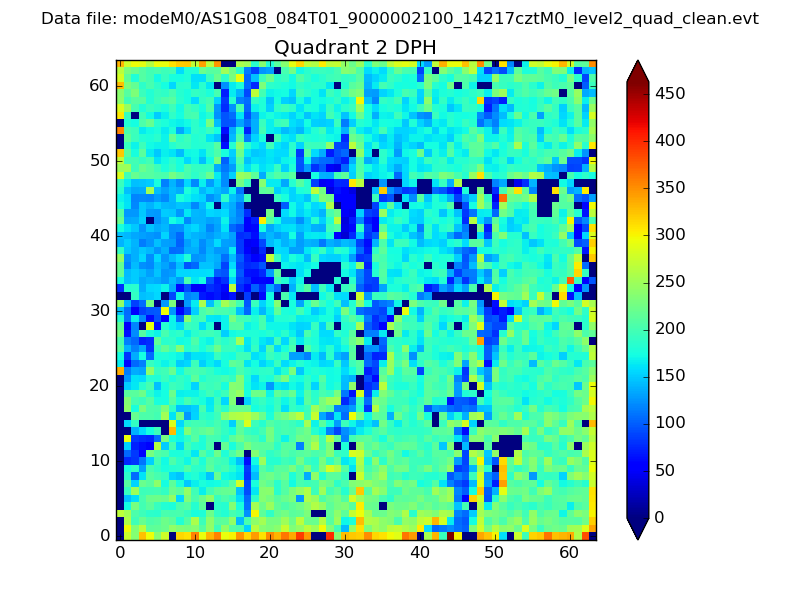
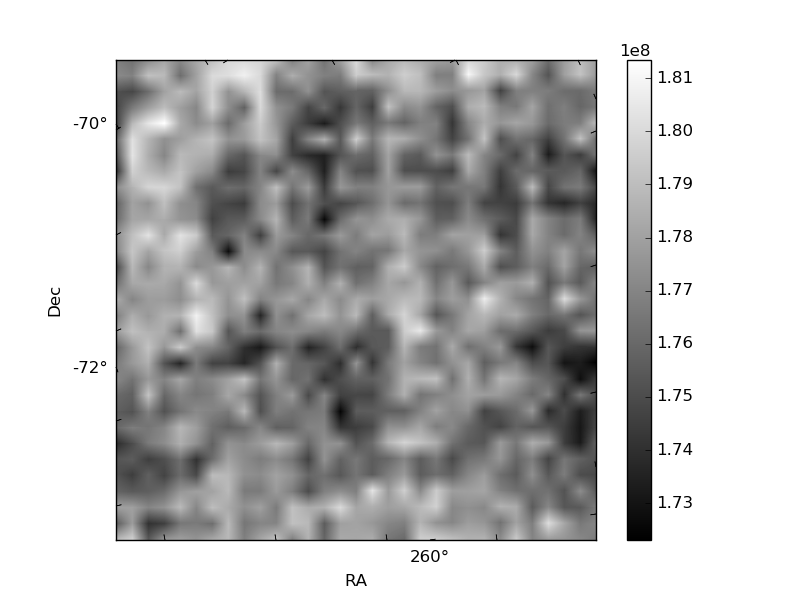
Histogram calculated using DETX and DETY for each event in the final _common_clean file
| Quadrant A | 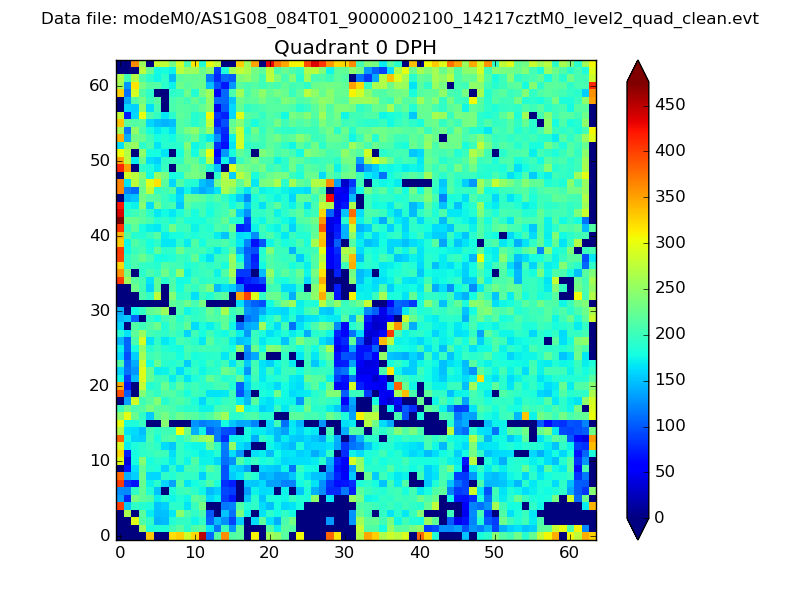 |
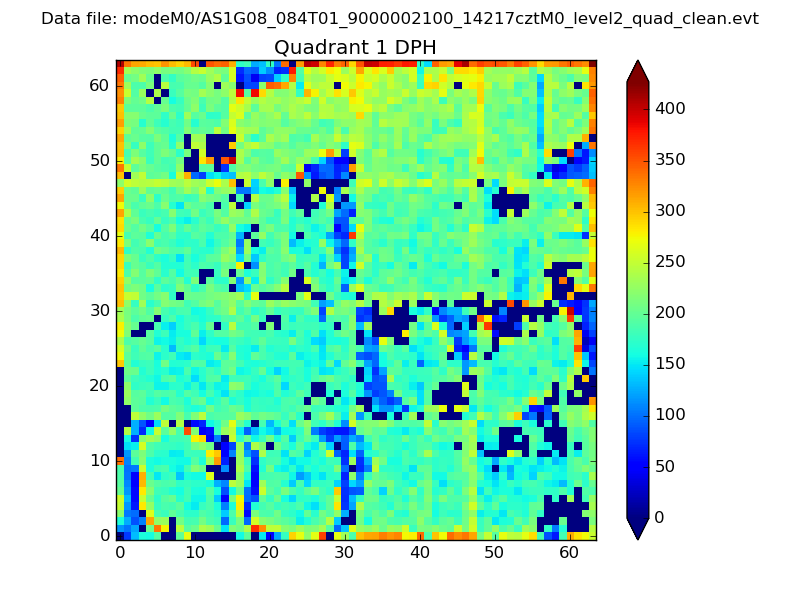 |
Quadrant B |
|---|---|---|---|
| Quadrant D | 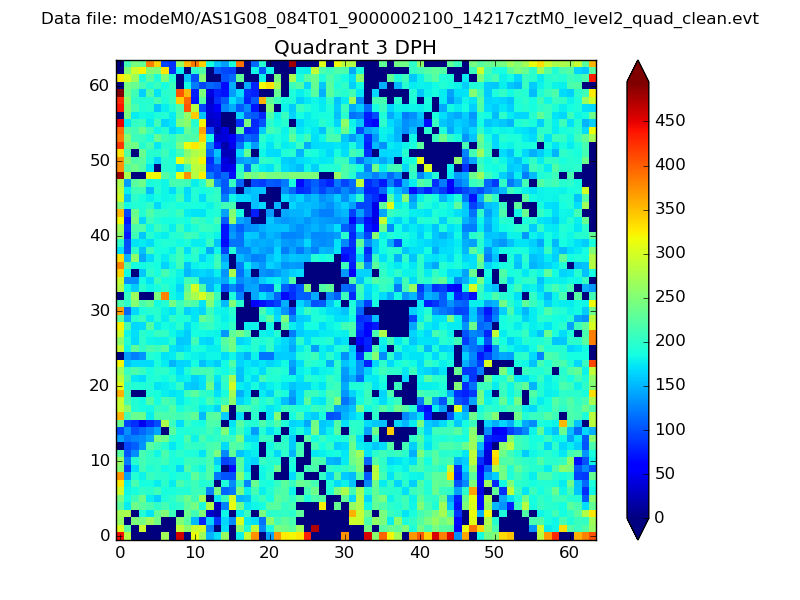 |
 |
Quadrant C |
| Plot type | Count rate plots | Images |
|---|---|---|
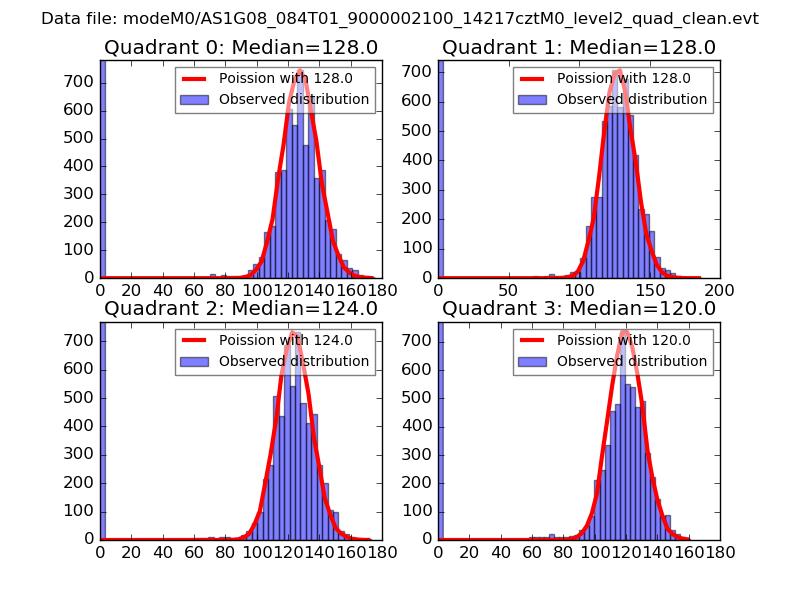
| Comparison with Poisson distribution Blue bars denote a histogram of data divided into 1 sec bins. Red curve is a Poisson curve with rate = median count rate of data. |
 |
 |
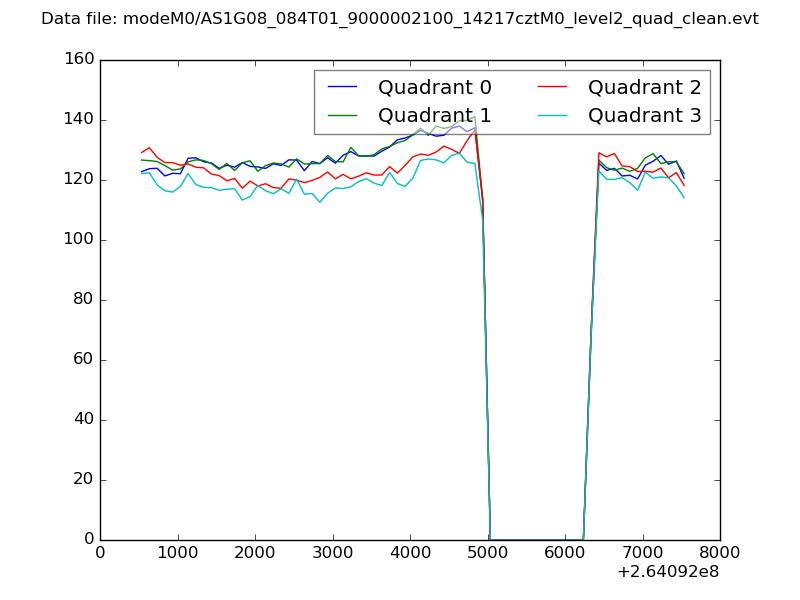
| Quadrant-wise count rates Data is divided into 100 sec bins |
 |
|
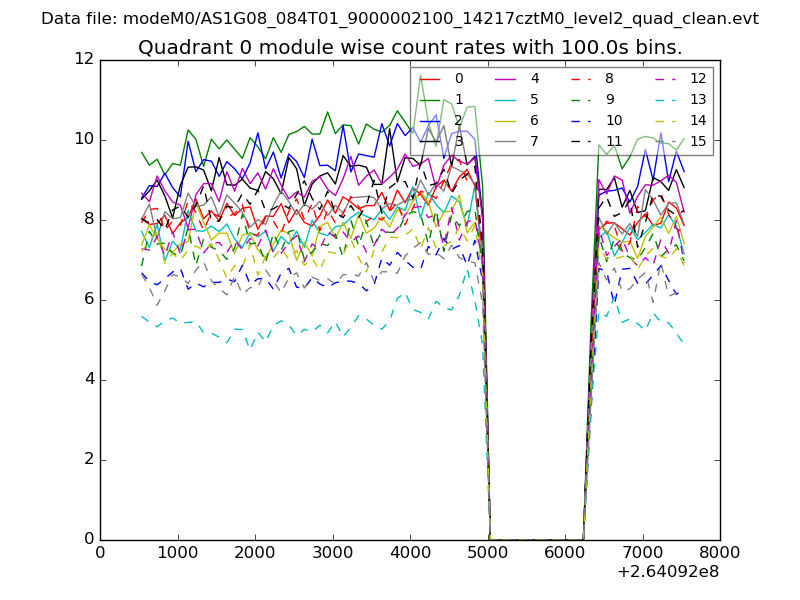
| Module-wise count rates for Quadrant A Data is divided into 100 sec bins |
 |
 |
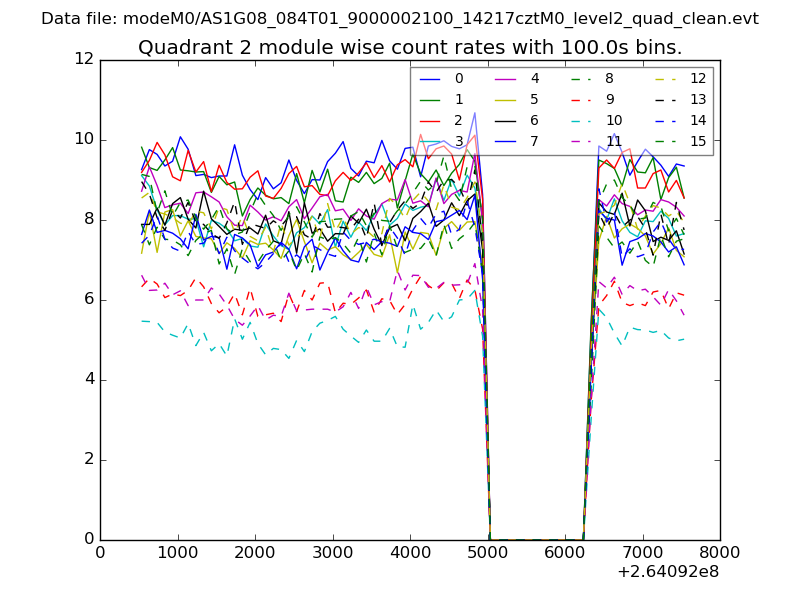
| Module-wise count rates for Quadrant B Data is divided into 100 sec bins |
 |
 |
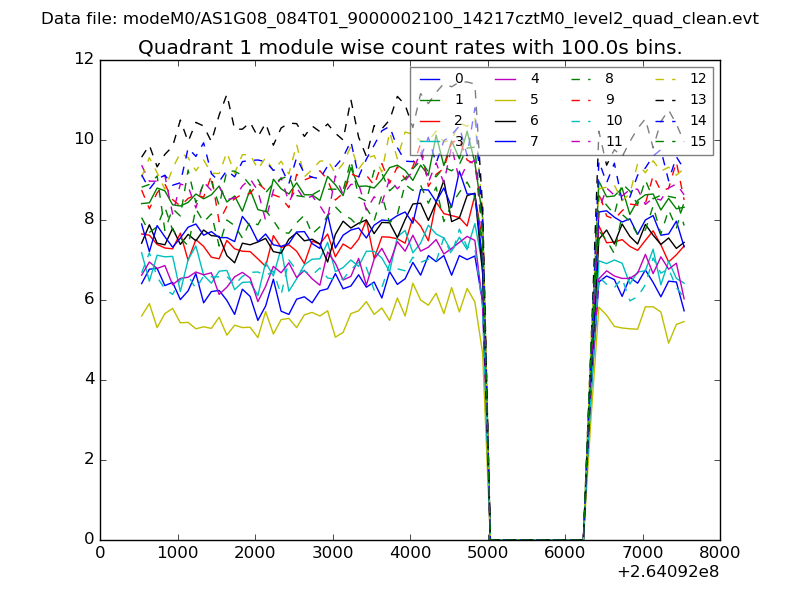
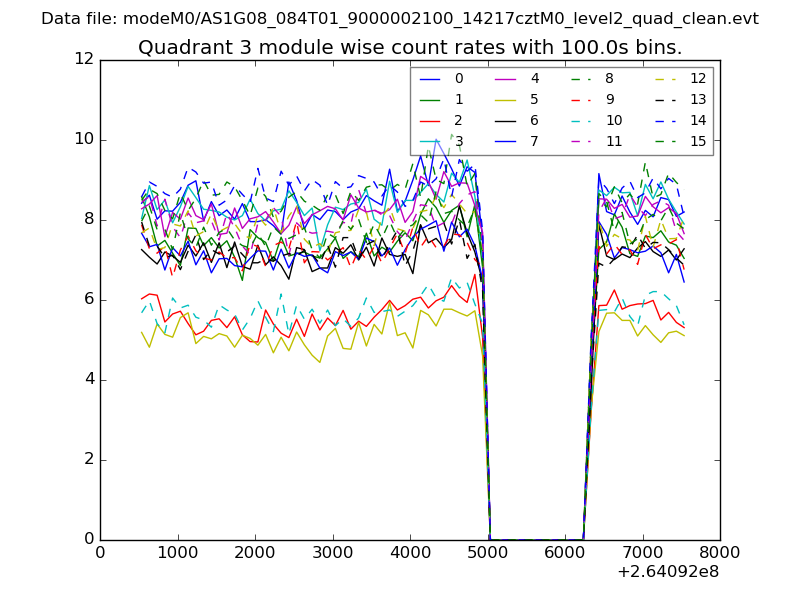
| Module-wise count rates for Quadrant C Data is divided into 100 sec bins |
 |
 |
| Module-wise count rates for Quadrant D Data is divided into 100 sec bins |
 |
 |
| Parameter | Plot |
|---|---|
| CZT HV Monitor | 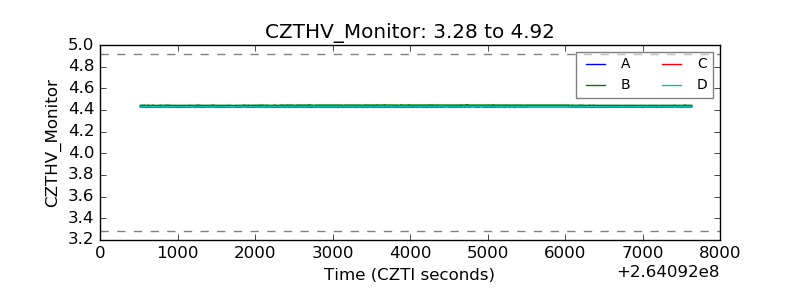 |
| D_VDD |  |
| Temperature 1 | 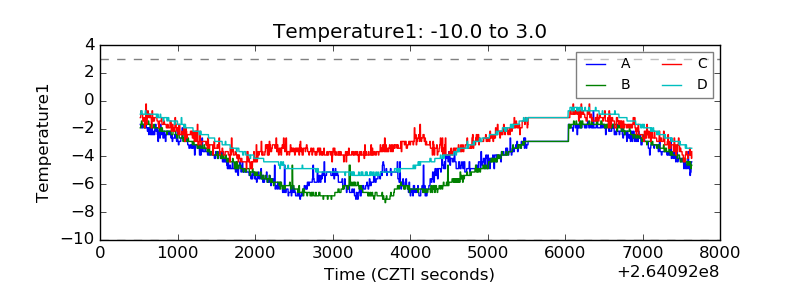 |
| Veto HV Monitor | 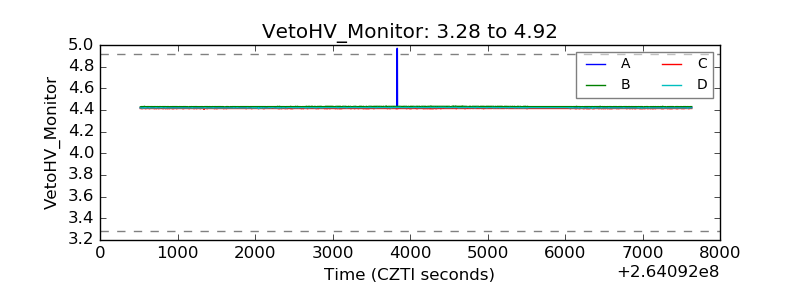 |
| Veto LLD | 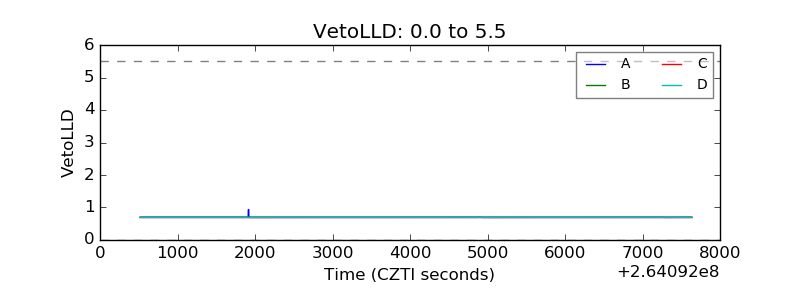 |
| Alpha Counter | 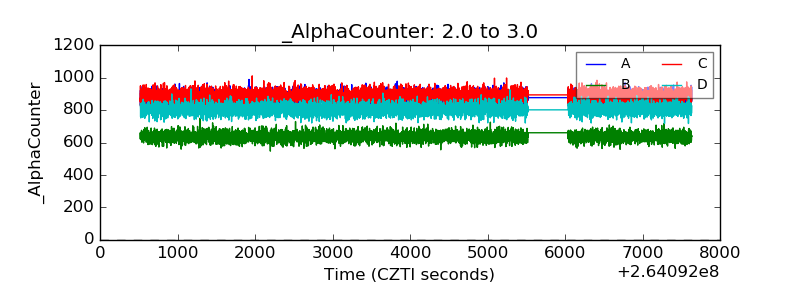 |
| _CPM_Rate | 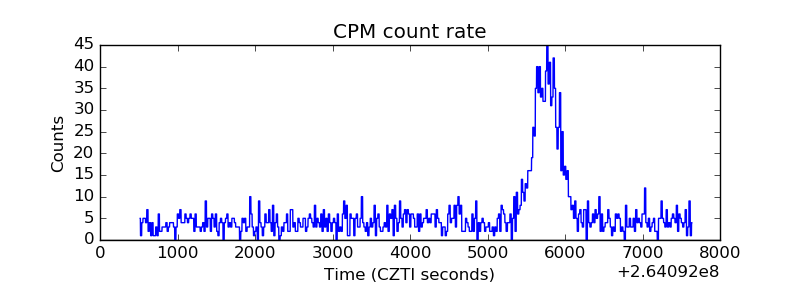 |
| CZT Counter | 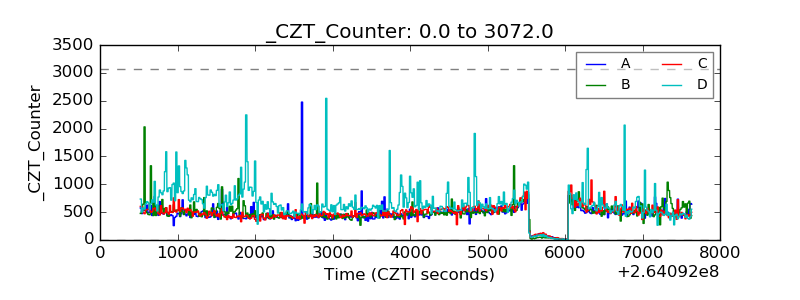 |
| +2.5 Volts monitor |  |
| +5 Volts monitor |  |
| _ROLL_ROT | 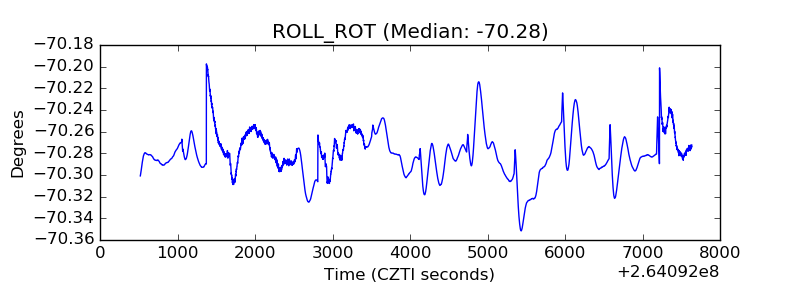 |
| _Roll_DEC | 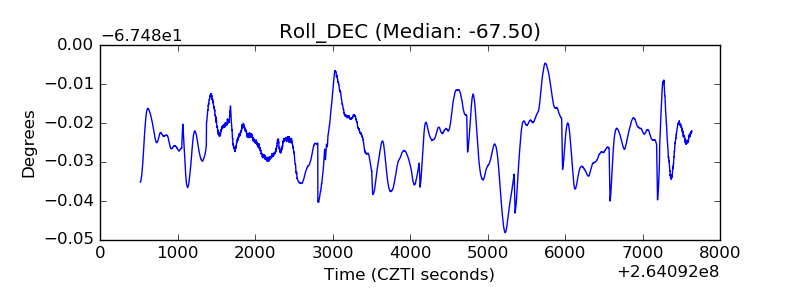 |
| _Roll_RA |  |
| Veto Counter | 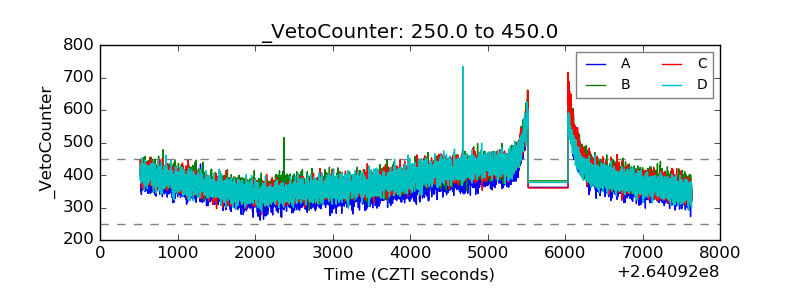 |