| Param | Original file | Final file |
|---|---|---|
| Filename | modeM0/AS1G08_084T01_9000002100_14218cztM0_level2.evt | modeM0/AS1G08_084T01_9000002100_14218cztM0_level2_quad_clean.evt |
| Size (bytes) | 481,524,480 | 111,300,480 |
| Size | 459.2 MB | 106.1 MB |
| Events in quadrant A | 3,426,400 | 735,822 |
| Events in quadrant B | 3,533,556 | 739,516 |
| Events in quadrant C | 3,385,216 | 715,044 |
| Events in quadrant D | 3,761,777 | 692,195 |
| Mode SS | |||
|---|---|---|---|
| Quadrant | BADHDUFLAG | Total packets | Discarded packets |
| A | 0 | 144 | 0 |
| B | 0 | 144 | 0 |
| C | 0 | 144 | 0 |
| D | 0 | 144 | 0 |
| Mode M0 | |||
|---|---|---|---|
| Quadrant | BADHDUFLAG | Total packets | Discarded packets |
| A | 0 | 14692 | 2 |
| B | 0 | 15003 | 1 |
| C | 0 | 14446 | 1 |
| D | 0 | 15643 | 1 |
| Mode M9 | |||
|---|---|---|---|
| Quadrant | BADHDUFLAG | Total packets | Discarded packets |
| A | 0 | 2 | 0 |
| B | 0 | 2 | 0 |
| C | 0 | 2 | 0 |
| D | 0 | 2 | 0 |
| Quadrant | Total seconds | Saturated seconds | Saturation percentage |
|---|---|---|---|
| A | 7005 | 57 | 0.813704% |
| B | 7005 | 94 | 1.341899% |
| C | 7005 | 27 | 0.385439% |
| D | 7005 | 54 | 0.770878% |
Noise dominated data is calculated using 1-second bins in cleaned event files. If a bin has >2000 counts, and if more than 50% of those come from <1% of pixels, then it is considered to be noise-dominated and hence unusable.
| Quadrant | # 1 sec bins | Bins with >0 counts | Bins with >2000 counts | High rate bins dominated by noise | Noise dominated (total time) | Noise dominated (detector-on time) | Marked lightcurve |
|---|---|---|---|---|---|---|---|
| A | 7256 | 7007 | 1 | 1 | 0.01% | 0.01% | 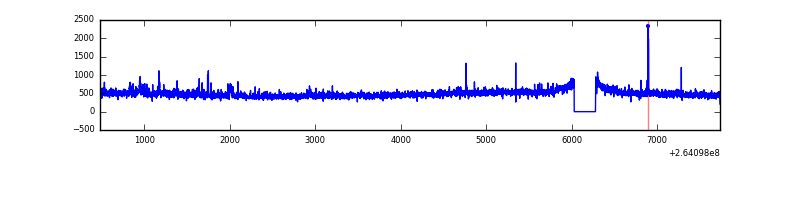 |
| B | 7256 | 7007 | 3 | 3 | 0.04% | 0.04% | 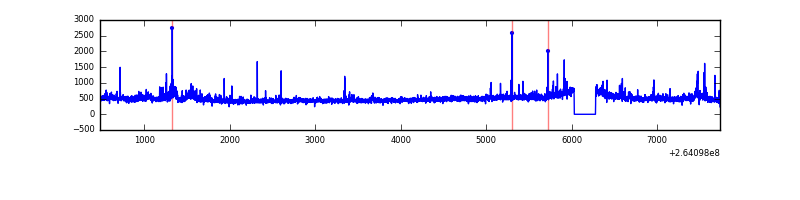 |
| C | 7256 | 7007 | 0 | 0 | 0.00% | 0.00% | 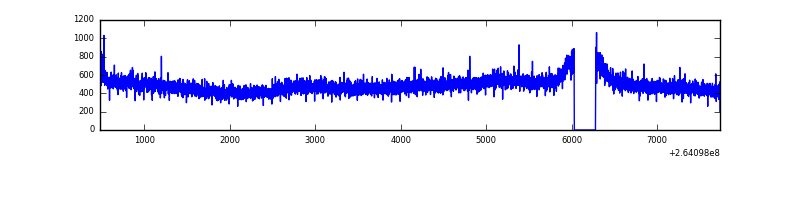 |
| D | 7256 | 7007 | 22 | 22 | 0.30% | 0.31% | 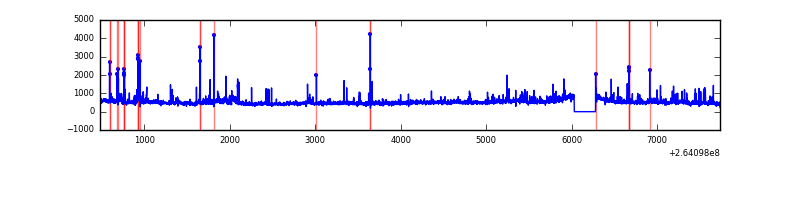 |
Top three noisy pixels from each quadrant. If the there are fewer than three noisy pixels in the level2.evt file, extra rows are filled as -1
| Pixel properties | Quadrant properties | ||||||
|---|---|---|---|---|---|---|---|
| Quadrant | DetID | PixID | Counts | Sigma | Mean | Median | Sigma |
| A | 8 | 15 | 109006 | 643.41 | 826 | 805 | 168.2 |
| A | 12 | 189 | 107786 | 636.16 | 826 | 805 | 168.2 |
| A | 9 | 143 | 17363 | 98.46 | 826 | 805 | 168.2 |
| B | 0 | 219 | 83347 | 528.56 | 826 | 807 | 156.2 |
| B | 4 | 97 | 64181 | 405.83 | 826 | 807 | 156.2 |
| B | 0 | 229 | 47258 | 297.46 | 826 | 807 | 156.2 |
| C | 3 | 233 | 276529 | 1503.09 | 795 | 799 | 183.4 |
| C | 0 | 207 | 6435 | 30.72 | 795 | 799 | 183.4 |
| C | 13 | 61 | 5734 | 26.9 | 795 | 799 | 183.4 |
| D | 8 | 195 | 328639 | 1568.4 | 787 | 770 | 209.0 |
| D | 5 | 222 | 169536 | 807.31 | 787 | 770 | 209.0 |
| D | 13 | 122 | 91421 | 433.64 | 787 | 770 | 209.0 |
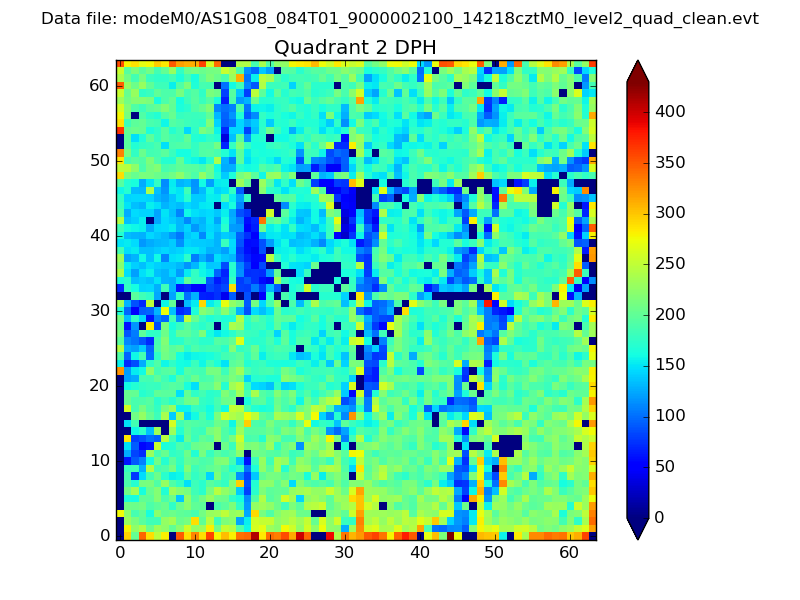
Histogram calculated using DETX and DETY for each event in the final _common_clean file
| Quadrant A | 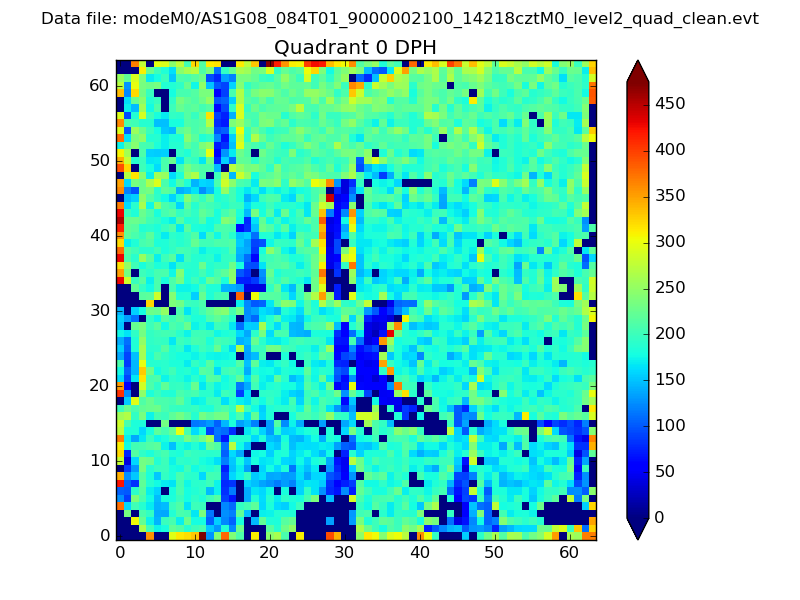 |
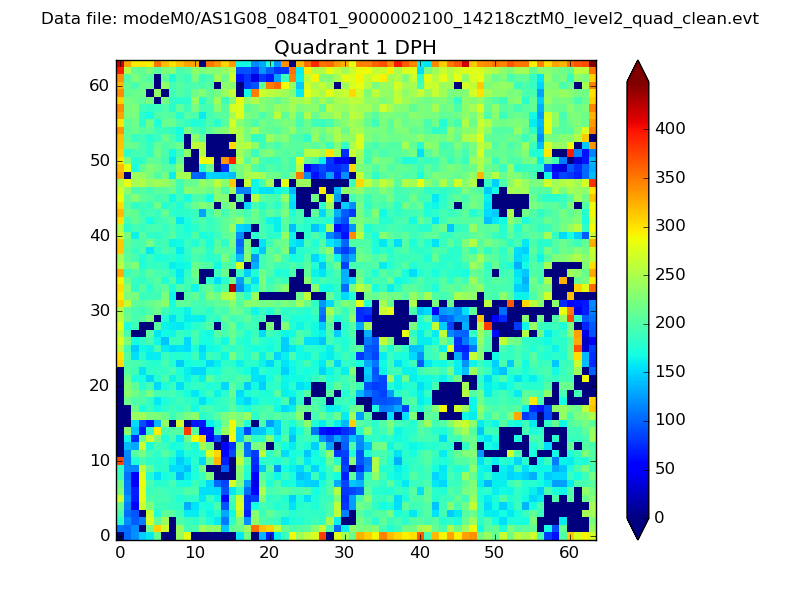 |
Quadrant B |
|---|---|---|---|
| Quadrant D | 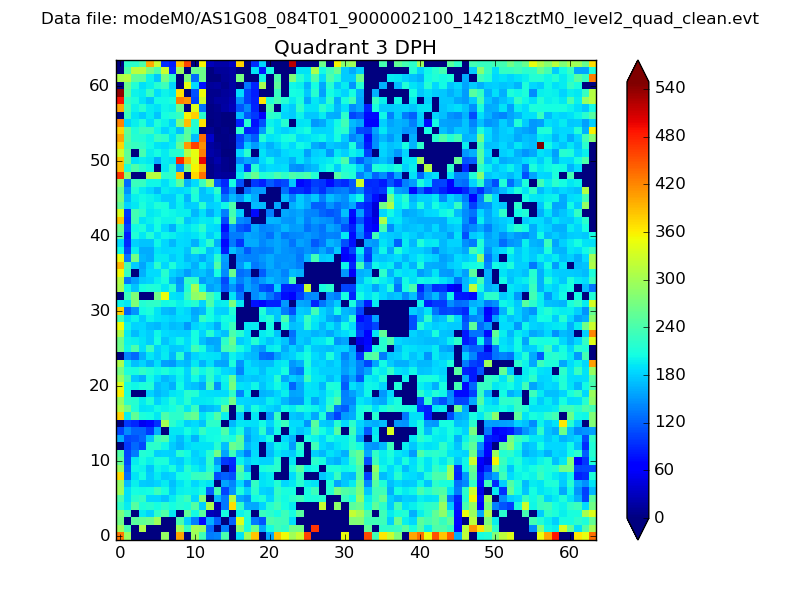 |
 |
Quadrant C |
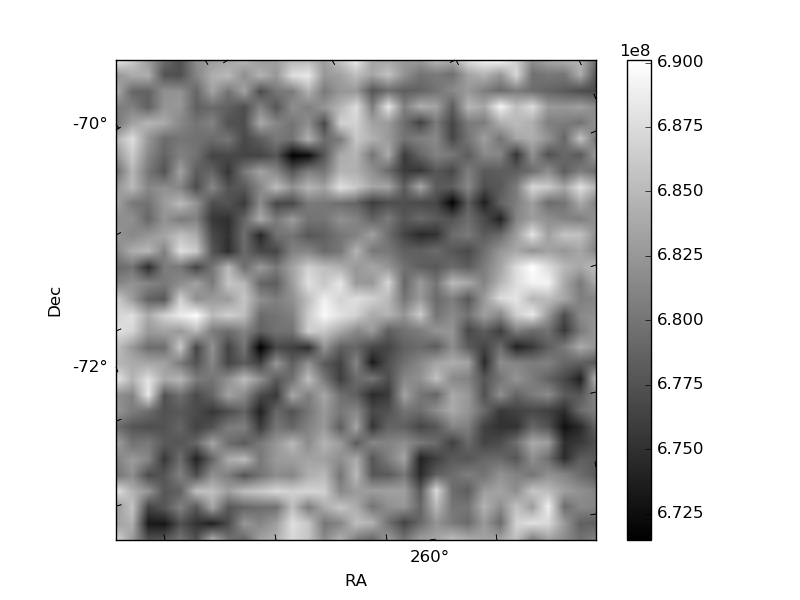
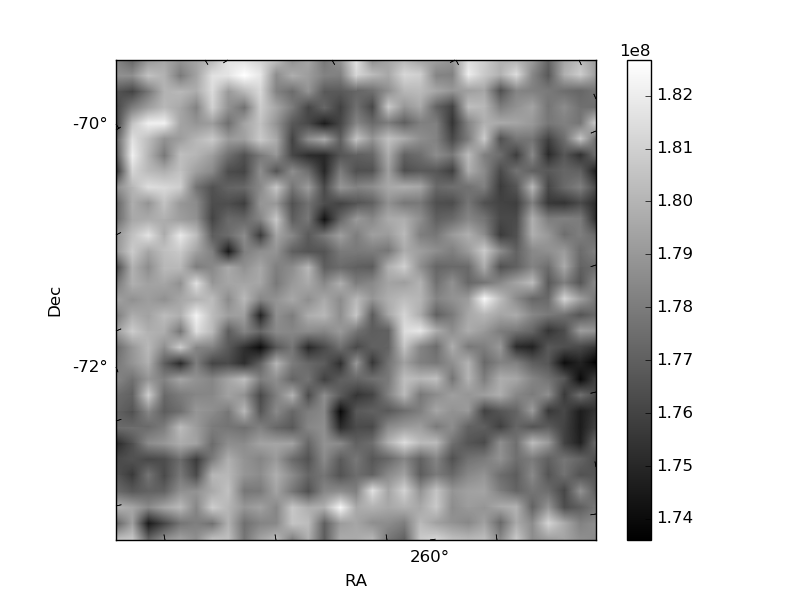
| Plot type | Count rate plots | Images |
|---|---|---|
| Comparison with Poisson distribution Blue bars denote a histogram of data divided into 1 sec bins. Red curve is a Poisson curve with rate = median count rate of data. |
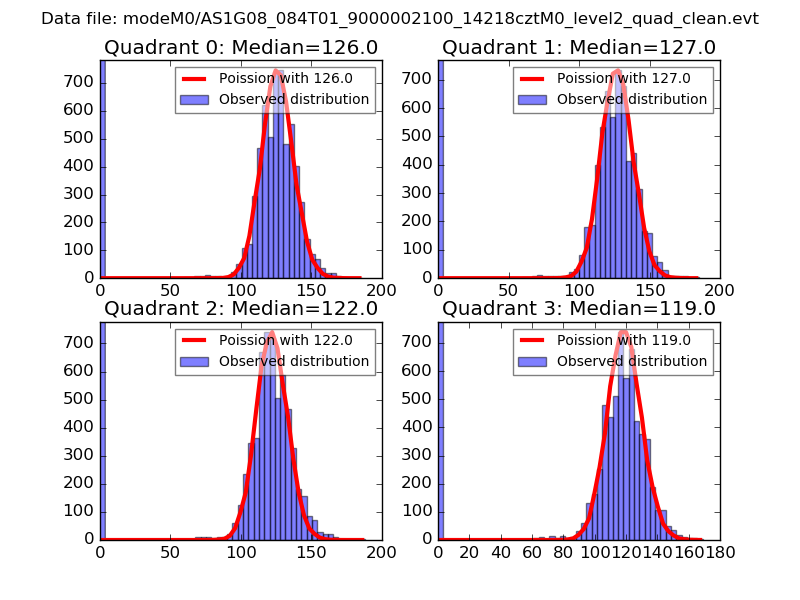 |
 |
| Quadrant-wise count rates Data is divided into 100 sec bins |
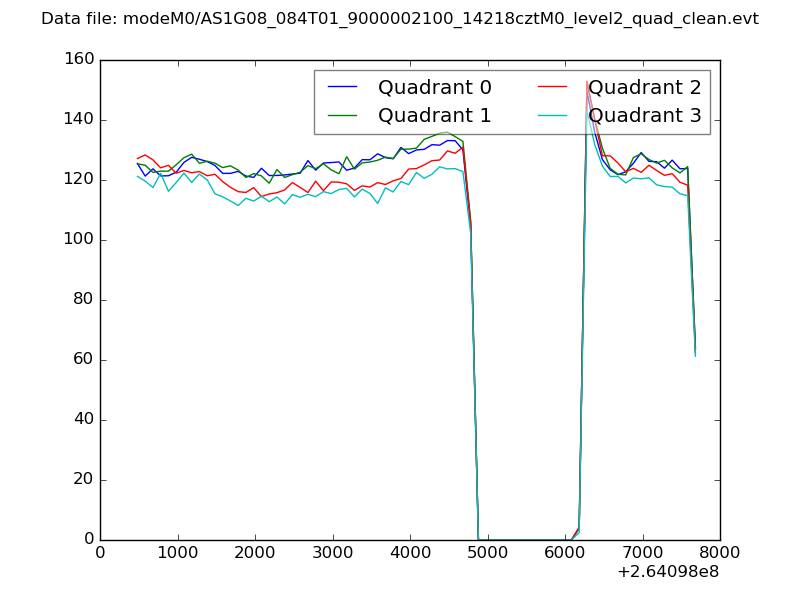 |
|
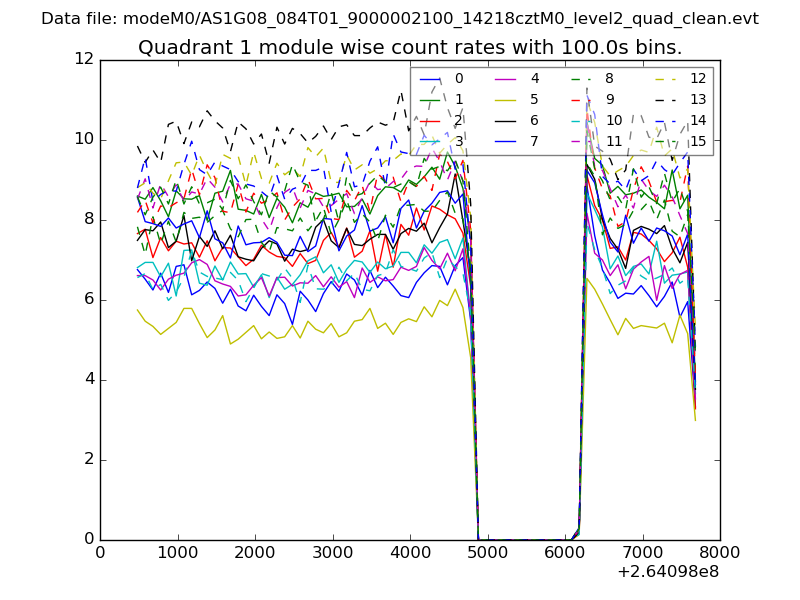
| Module-wise count rates for Quadrant A Data is divided into 100 sec bins |
 |
 |
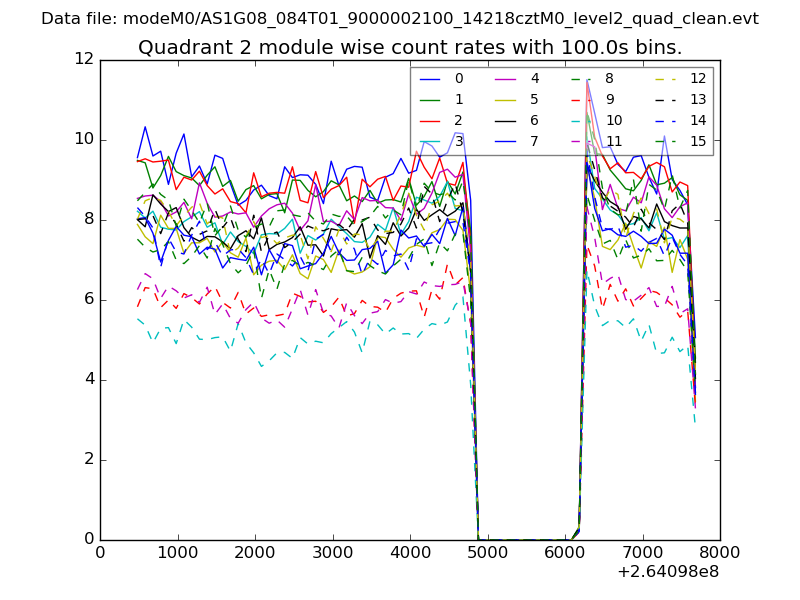
| Module-wise count rates for Quadrant B Data is divided into 100 sec bins |
 |
 |
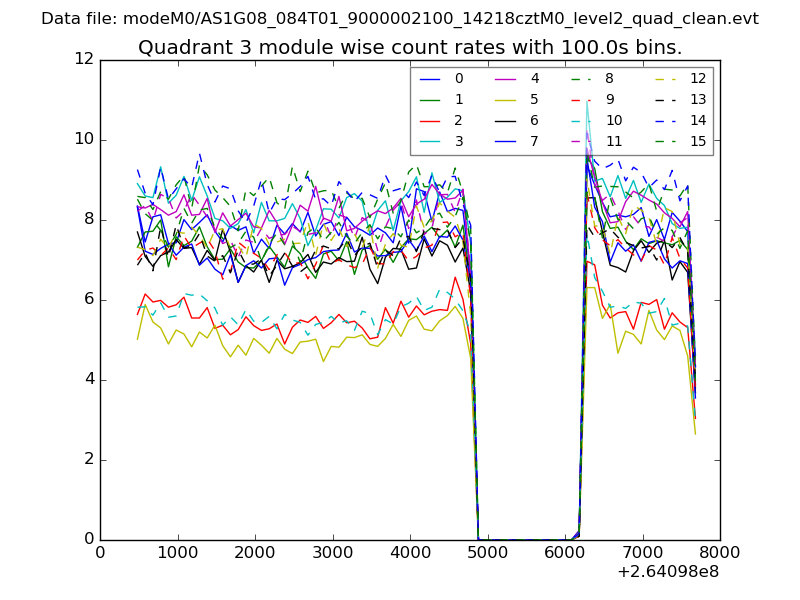
| Module-wise count rates for Quadrant C Data is divided into 100 sec bins |
 |
 |
| Module-wise count rates for Quadrant D Data is divided into 100 sec bins |
 |
 |
| Parameter | Plot |
|---|---|
| CZT HV Monitor | 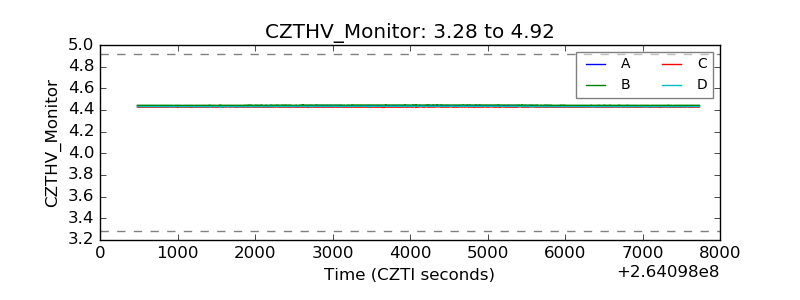 |
| D_VDD | 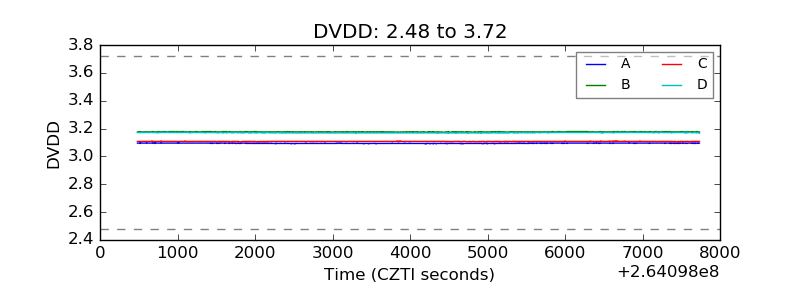 |
| Temperature 1 | 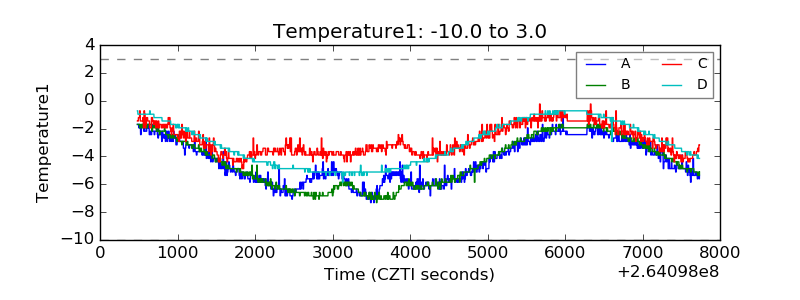 |
| Veto HV Monitor |  |
| Veto LLD | 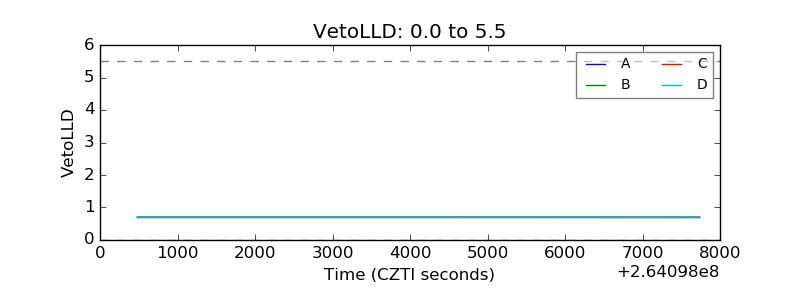 |
| Alpha Counter | 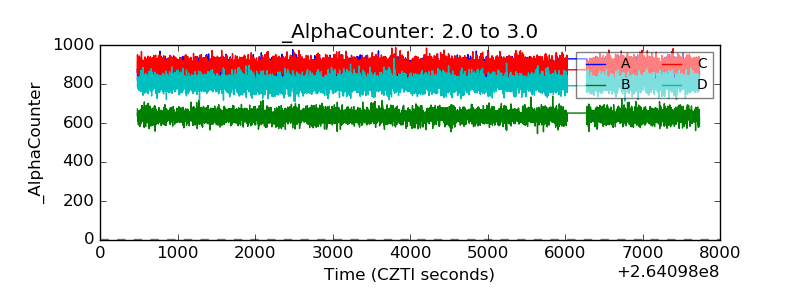 |
| _CPM_Rate | 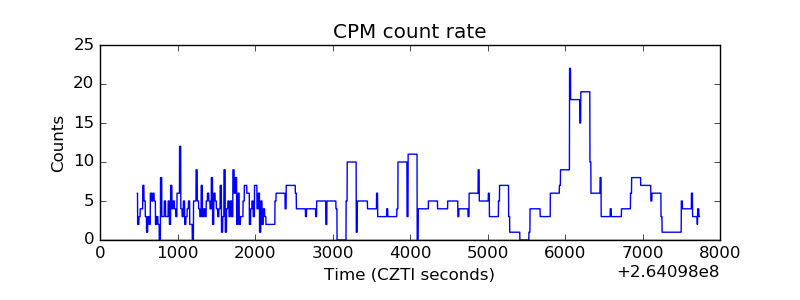 |
| CZT Counter | 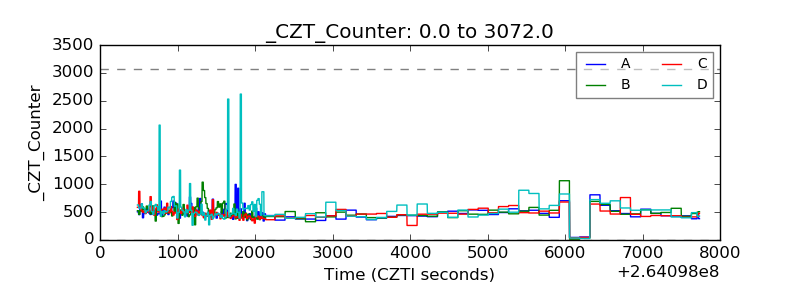 |
| +2.5 Volts monitor |  |
| +5 Volts monitor |  |
| _ROLL_ROT | 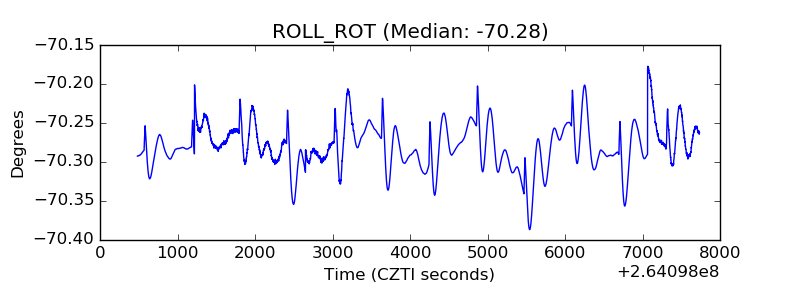 |
| _Roll_DEC | 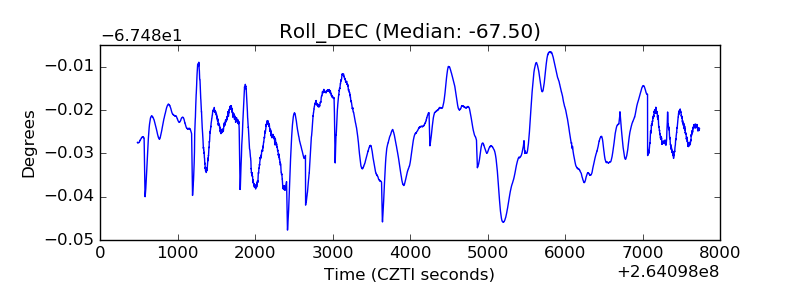 |
| _Roll_RA | 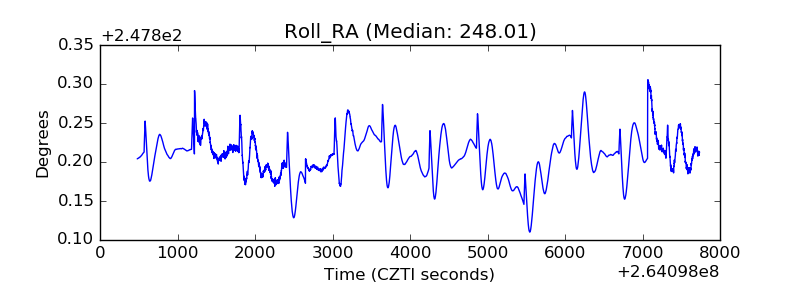 |
| Veto Counter | 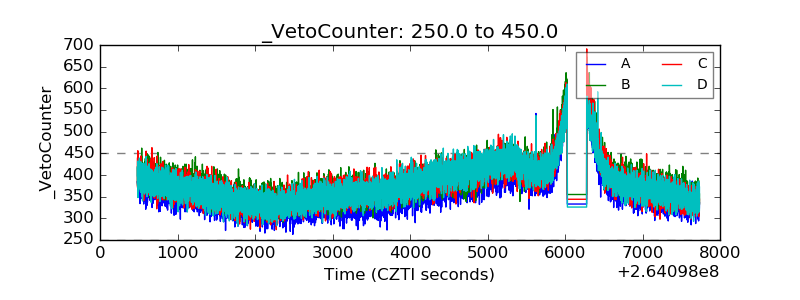 |