| Param | Original file | Final file |
|---|---|---|
| Filename | modeM0/AS1G08_084T01_9000002100_14219cztM0_level2.evt | modeM0/AS1G08_084T01_9000002100_14219cztM0_level2_quad_clean.evt |
| Size (bytes) | 521,945,280 | 115,715,520 |
| Size | 497.8 MB | 110.4 MB |
| Events in quadrant A | 3,588,852 | 764,381 |
| Events in quadrant B | 3,800,383 | 767,242 |
| Events in quadrant C | 3,662,351 | 737,166 |
| Events in quadrant D | 4,248,511 | 716,057 |
| Mode SS | |||
|---|---|---|---|
| Quadrant | BADHDUFLAG | Total packets | Discarded packets |
| A | 0 | 150 | 0 |
| B | 0 | 150 | 0 |
| C | 0 | 150 | 0 |
| D | 0 | 150 | 0 |
| Mode M0 | |||
|---|---|---|---|
| Quadrant | BADHDUFLAG | Total packets | Discarded packets |
| A | 0 | 15555 | 2 |
| B | 0 | 16152 | 1 |
| C | 0 | 15612 | 1 |
| D | 0 | 17516 | 1 |
| Quadrant | Total seconds | Saturated seconds | Saturation percentage |
|---|---|---|---|
| A | 7475 | 30 | 0.401338% |
| B | 7475 | 57 | 0.762542% |
| C | 7475 | 11 | 0.147157% |
| D | 7475 | 72 | 0.963211% |
Noise dominated data is calculated using 1-second bins in cleaned event files. If a bin has >2000 counts, and if more than 50% of those come from <1% of pixels, then it is considered to be noise-dominated and hence unusable.
| Quadrant | # 1 sec bins | Bins with >0 counts | Bins with >2000 counts | High rate bins dominated by noise | Noise dominated (total time) | Noise dominated (detector-on time) | Marked lightcurve |
|---|---|---|---|---|---|---|---|
| A | 7821 | 7477 | 1 | 1 | 0.01% | 0.01% | 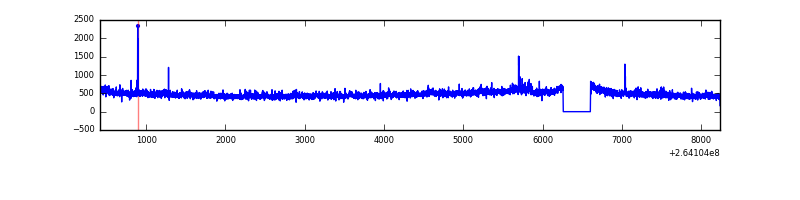 |
| B | 7821 | 7477 | 8 | 8 | 0.10% | 0.11% | 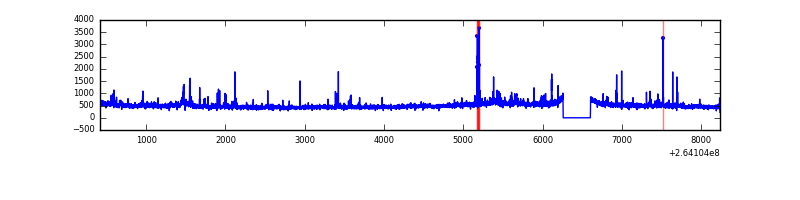 |
| C | 7821 | 7477 | 5 | 5 | 0.06% | 0.07% | 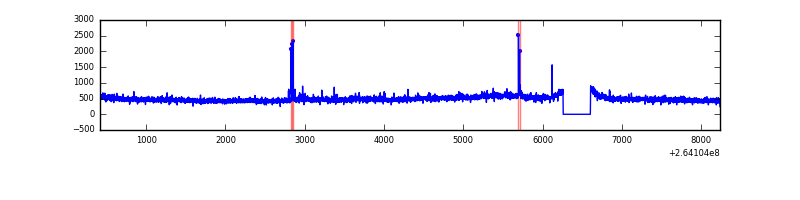 |
| D | 7821 | 7477 | 46 | 46 | 0.59% | 0.62% | 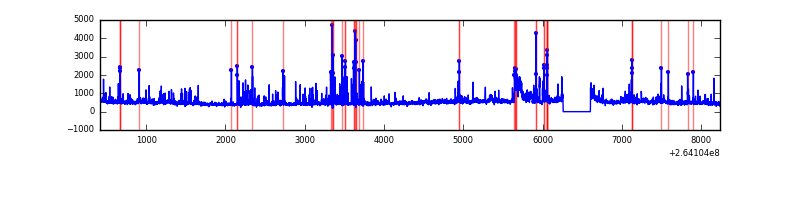 |
Top three noisy pixels from each quadrant. If the there are fewer than three noisy pixels in the level2.evt file, extra rows are filled as -1
| Pixel properties | Quadrant properties | ||||||
|---|---|---|---|---|---|---|---|
| Quadrant | DetID | PixID | Counts | Sigma | Mean | Median | Sigma |
| A | 8 | 15 | 93395 | 518.78 | 875 | 855 | 178.4 |
| A | 12 | 189 | 91862 | 510.19 | 875 | 855 | 178.4 |
| A | 8 | 6 | 20996 | 112.91 | 875 | 855 | 178.4 |
| B | 0 | 219 | 112757 | 664.93 | 876 | 853 | 168.3 |
| B | 4 | 97 | 73272 | 430.31 | 876 | 853 | 168.3 |
| B | 0 | 229 | 68201 | 400.18 | 876 | 853 | 168.3 |
| C | 3 | 233 | 364791 | 1866.65 | 839 | 844 | 195.0 |
| C | 14 | 234 | 26682 | 132.52 | 839 | 844 | 195.0 |
| C | 13 | 61 | 6112 | 27.02 | 839 | 844 | 195.0 |
| D | 5 | 222 | 548881 | 2443.3 | 829 | 810 | 224.3 |
| D | 8 | 195 | 301001 | 1338.25 | 829 | 810 | 224.3 |
| D | 2 | 33 | 63988 | 281.65 | 829 | 810 | 224.3 |
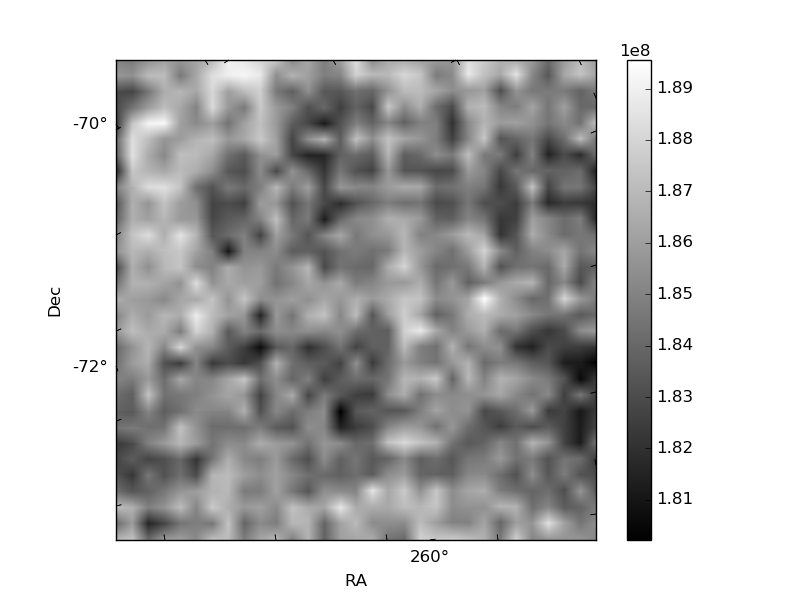
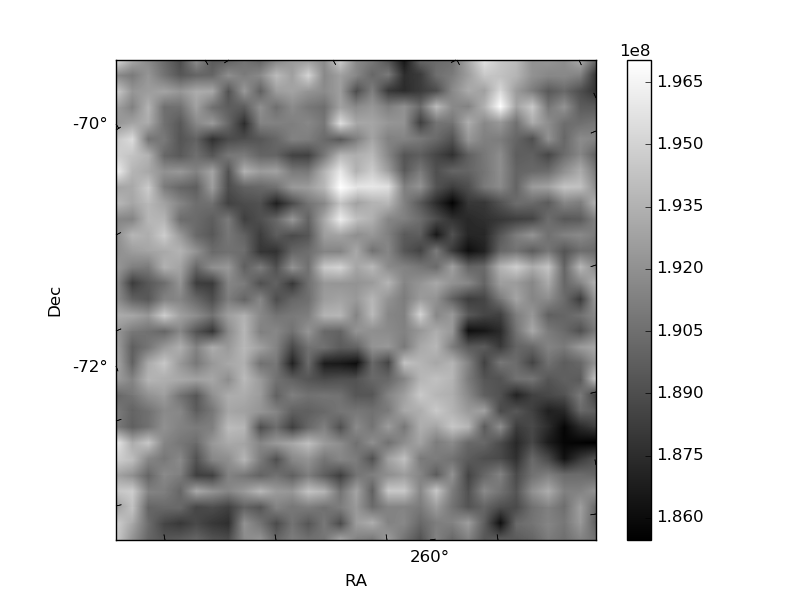
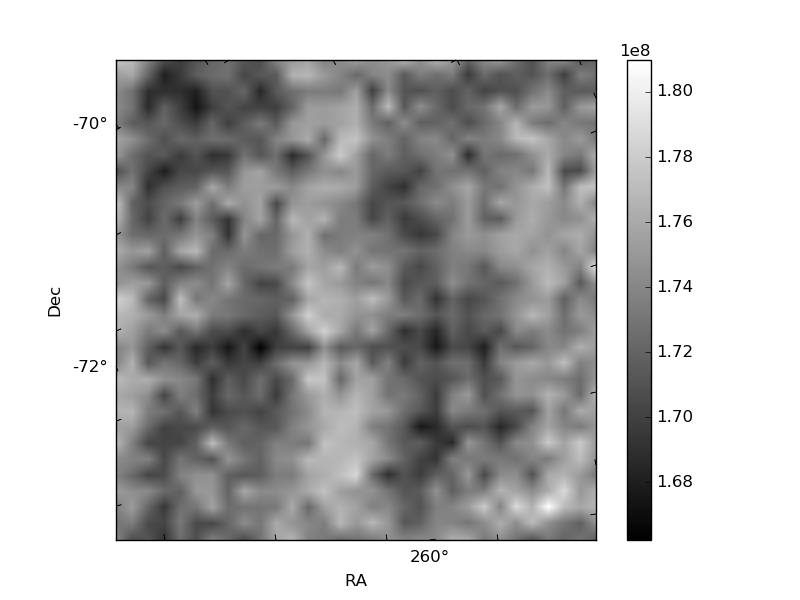
Histogram calculated using DETX and DETY for each event in the final _common_clean file
| Quadrant A | 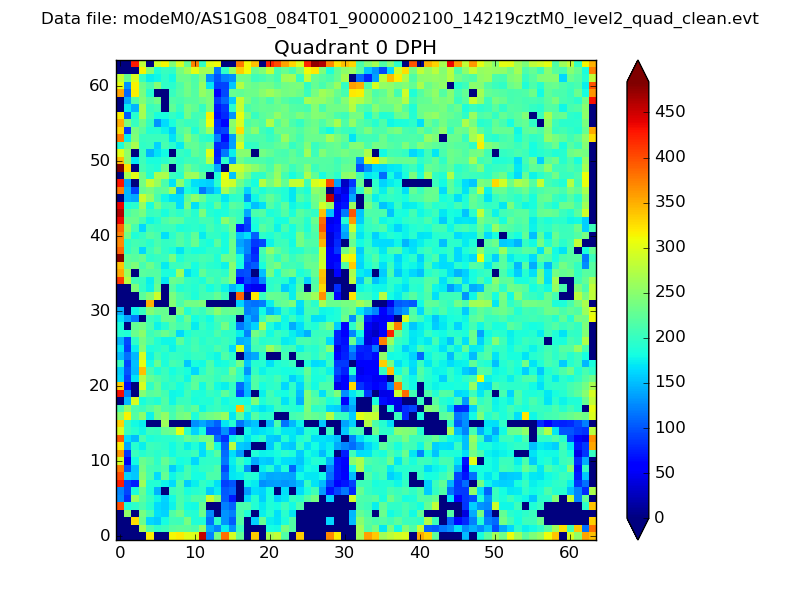 |
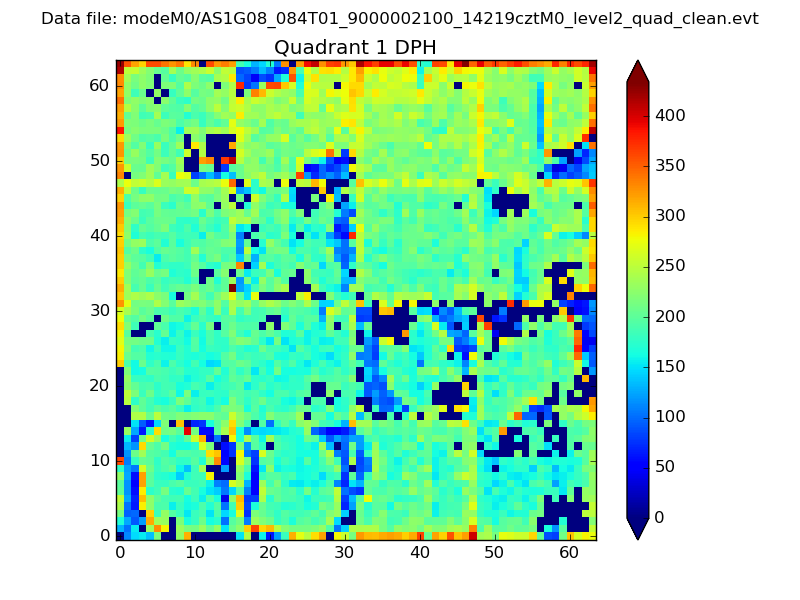 |
Quadrant B |
|---|---|---|---|
| Quadrant D | 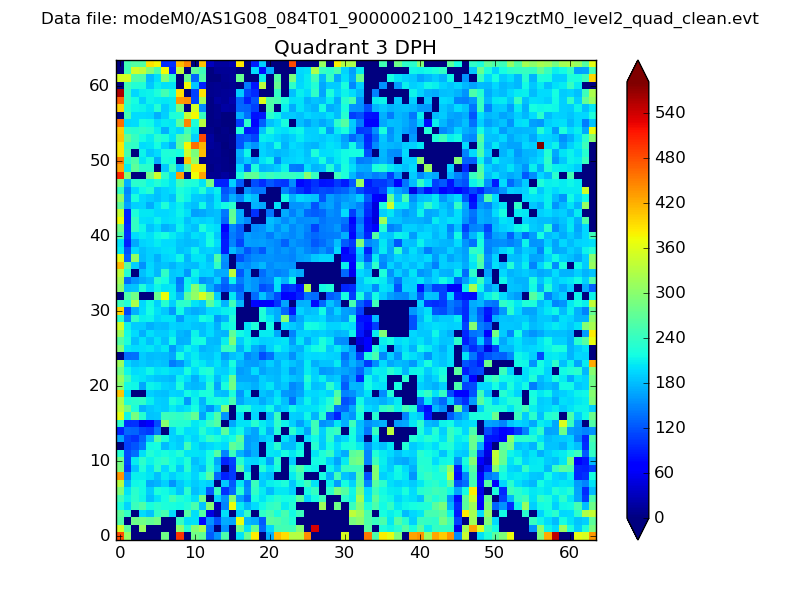 |
 |
Quadrant C |
| Plot type | Count rate plots | Images |
|---|---|---|
| Comparison with Poisson distribution Blue bars denote a histogram of data divided into 1 sec bins. Red curve is a Poisson curve with rate = median count rate of data. |
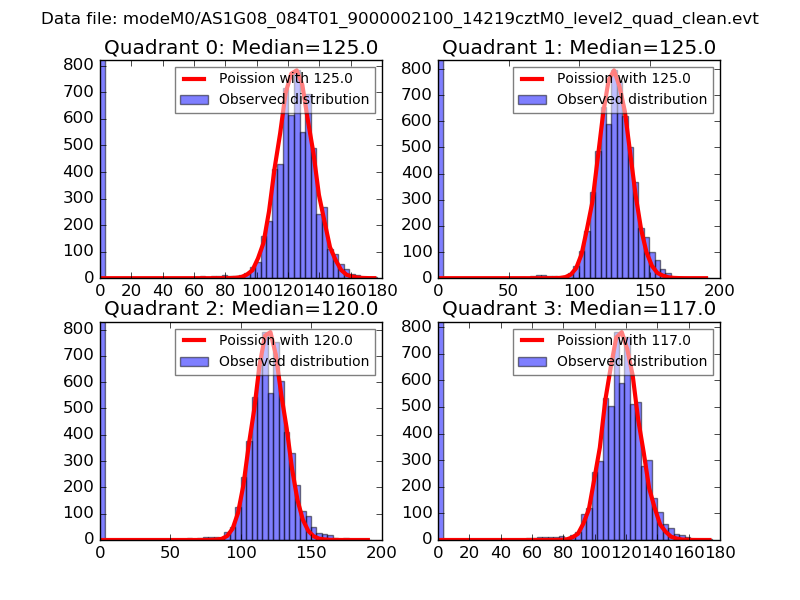 |
 |
| Quadrant-wise count rates Data is divided into 100 sec bins |
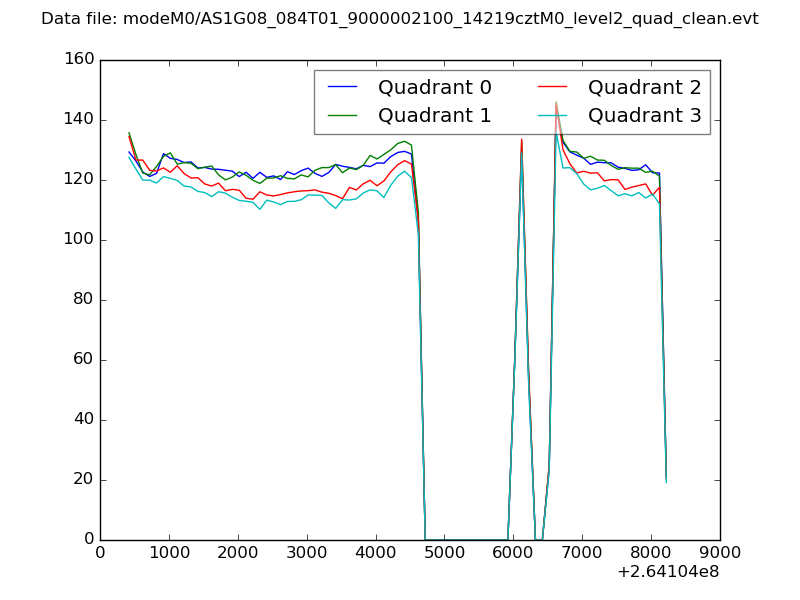 |
|
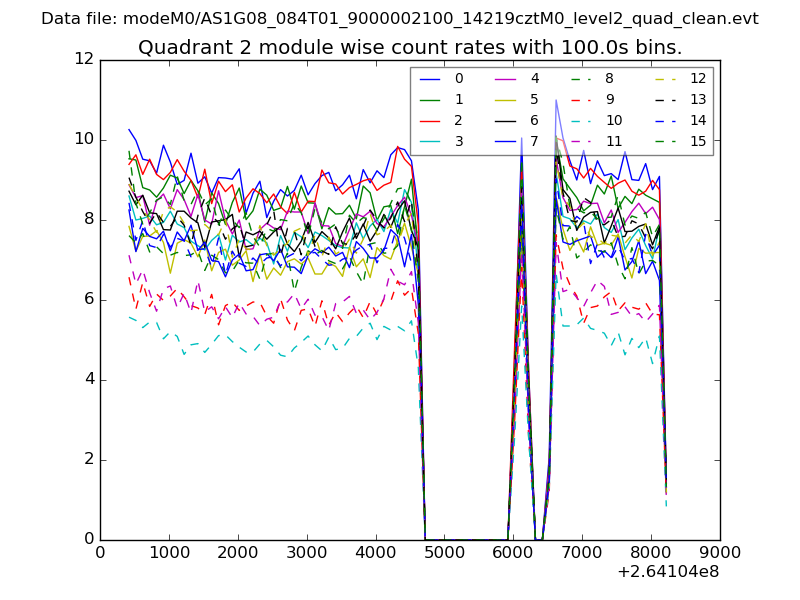
| Module-wise count rates for Quadrant A Data is divided into 100 sec bins |
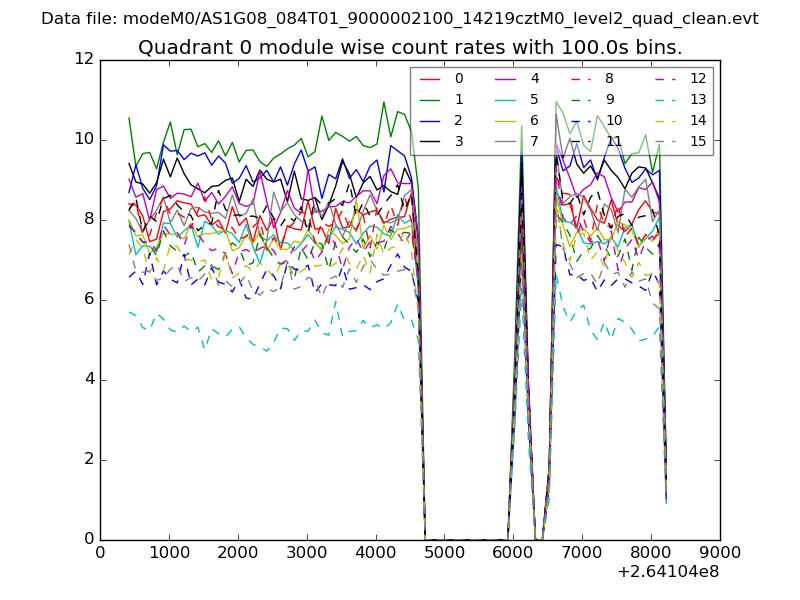 |
 |
| Module-wise count rates for Quadrant B Data is divided into 100 sec bins |
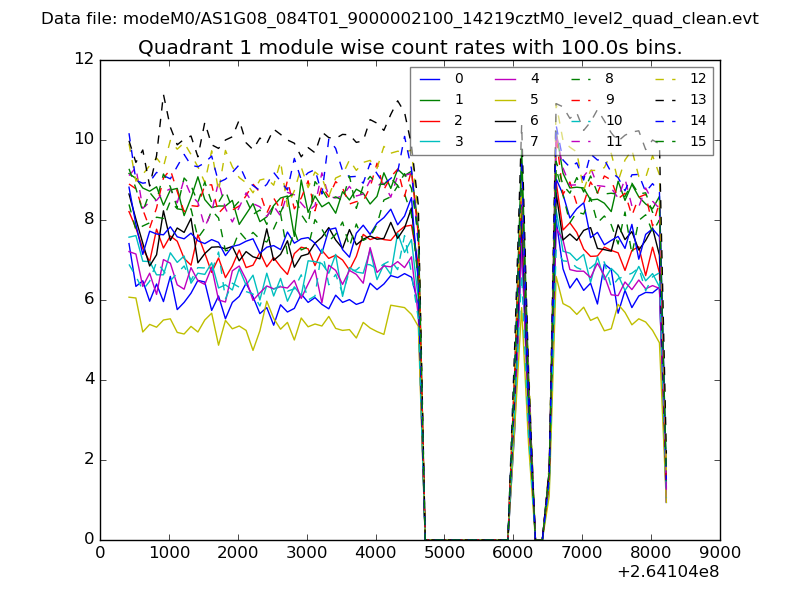 |
 |
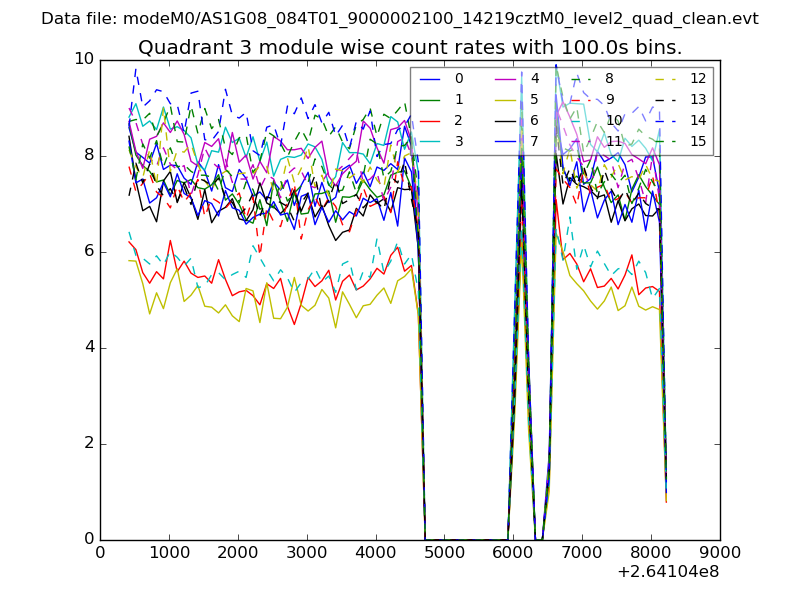
| Module-wise count rates for Quadrant C Data is divided into 100 sec bins |
 |
 |
| Module-wise count rates for Quadrant D Data is divided into 100 sec bins |
 |
 |
| Parameter | Plot |
|---|---|
| CZT HV Monitor | 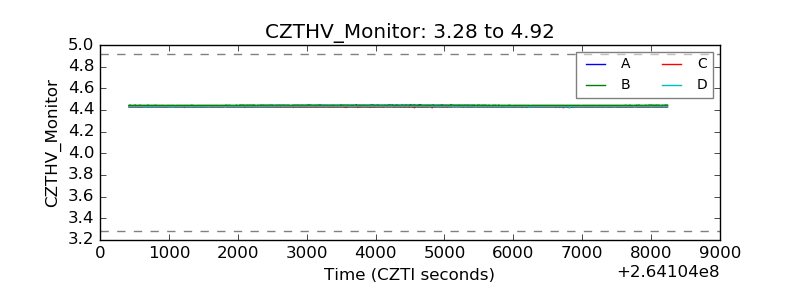 |
| D_VDD | 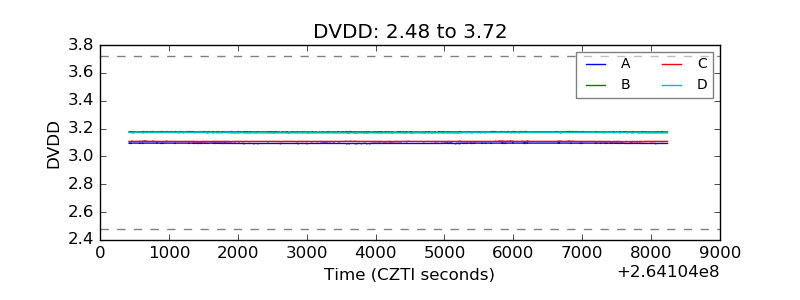 |
| Temperature 1 | 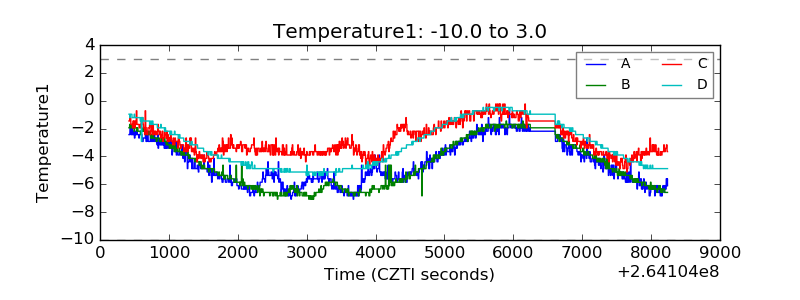 |
| Veto HV Monitor | 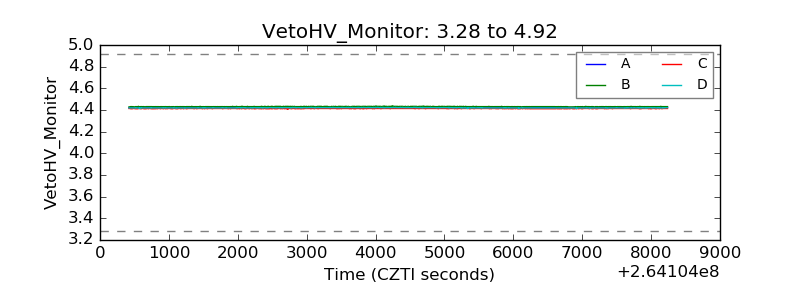 |
| Veto LLD | 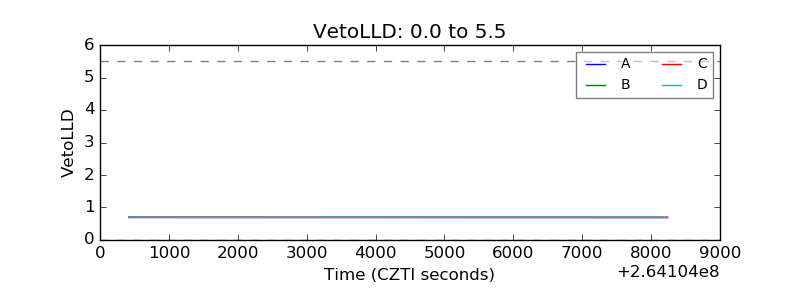 |
| Alpha Counter | 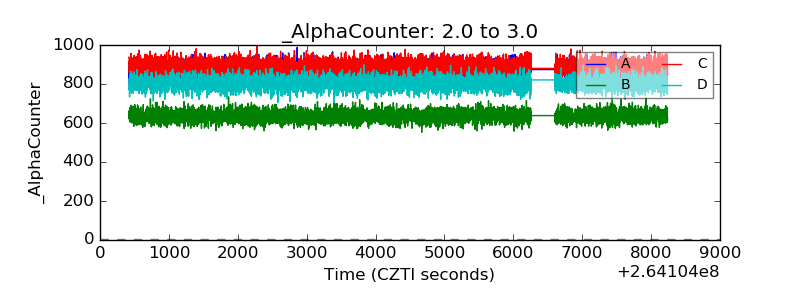 |
| _CPM_Rate | 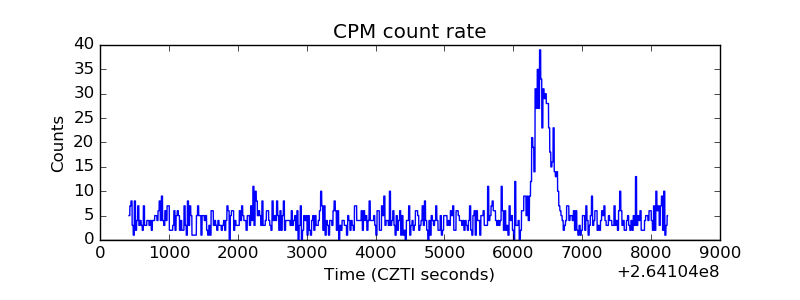 |
| CZT Counter |  |
| +2.5 Volts monitor |  |
| +5 Volts monitor |  |
| _ROLL_ROT | 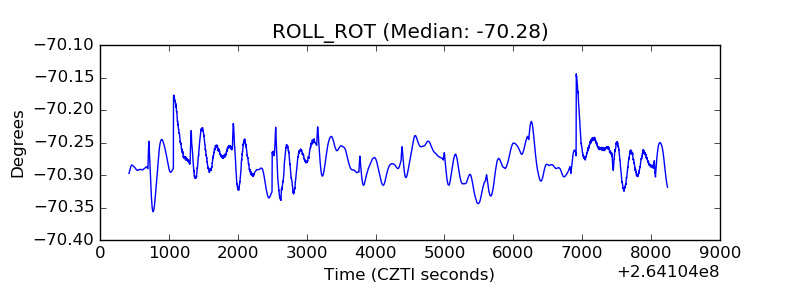 |
| _Roll_DEC | 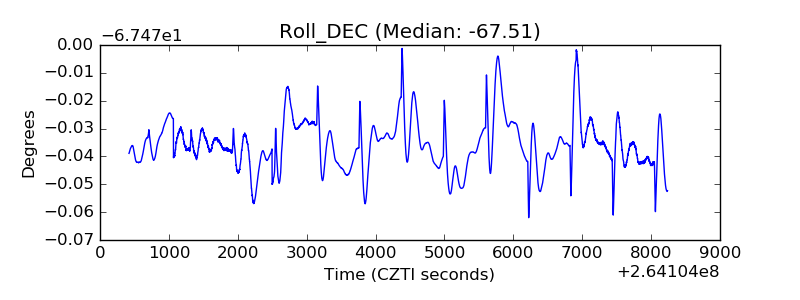 |
| _Roll_RA | 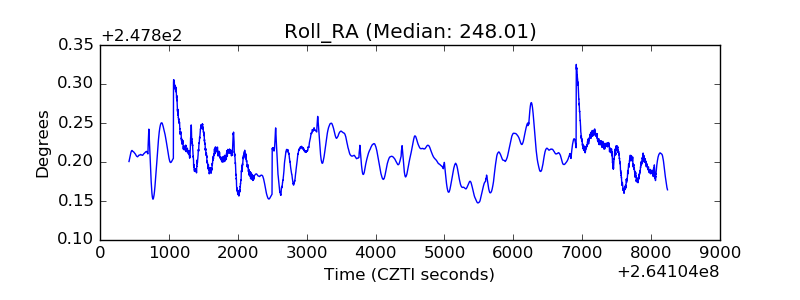 |
| Veto Counter | 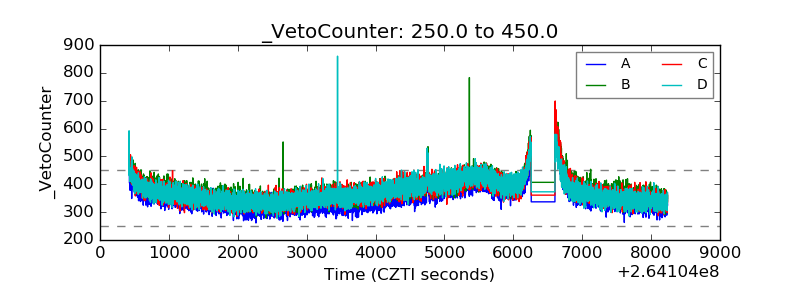 |