| Param | Original file | Final file |
|---|---|---|
| Filename | modeM0/AS1G08_084T01_9000002100_14222cztM0_level2.evt | modeM0/AS1G08_084T01_9000002100_14222cztM0_level2_quad_clean.evt |
| Size (bytes) | 1,306,909,440 | 270,642,240 |
| Size | 1.2 GB | 258.1 MB |
| Events in quadrant A | 8,767,138 | 1,776,997 |
| Events in quadrant B | 10,073,540 | 1,776,266 |
| Events in quadrant C | 9,138,436 | 1,714,040 |
| Events in quadrant D | 10,363,282 | 1,668,065 |
| Mode SS | |||
|---|---|---|---|
| Quadrant | BADHDUFLAG | Total packets | Discarded packets |
| A | 0 | 374 | 0 |
| B | 0 | 374 | 0 |
| C | 0 | 374 | 0 |
| D | 0 | 374 | 0 |
| Mode M0 | |||
|---|---|---|---|
| Quadrant | BADHDUFLAG | Total packets | Discarded packets |
| A | 0 | 37987 | 5 |
| B | 0 | 42096 | 4 |
| C | 0 | 38177 | 4 |
| D | 0 | 42992 | 4 |
| Mode M9 | |||
|---|---|---|---|
| Quadrant | BADHDUFLAG | Total packets | Discarded packets |
| A | 0 | 22 | 0 |
| B | 0 | 22 | 0 |
| C | 0 | 22 | 0 |
| D | 0 | 23 | 0 |
| Quadrant | Total seconds | Saturated seconds | Saturation percentage |
|---|---|---|---|
| A | 18308 | 50 | 0.273105% |
| B | 18308 | 508 | 2.774743% |
| C | 18308 | 34 | 0.185711% |
| D | 18308 | 208 | 1.136115% |
Noise dominated data is calculated using 1-second bins in cleaned event files. If a bin has >2000 counts, and if more than 50% of those come from <1% of pixels, then it is considered to be noise-dominated and hence unusable.
| Quadrant | # 1 sec bins | Bins with >0 counts | Bins with >2000 counts | High rate bins dominated by noise | Noise dominated (total time) | Noise dominated (detector-on time) | Marked lightcurve |
|---|---|---|---|---|---|---|---|
| A | 20419 | 18312 | 3 | 3 | 0.01% | 0.02% | 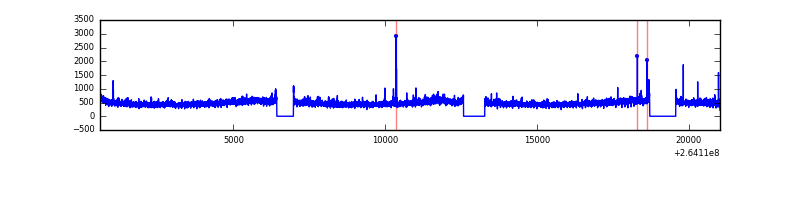 |
| B | 20419 | 18312 | 236 | 236 | 1.16% | 1.29% | 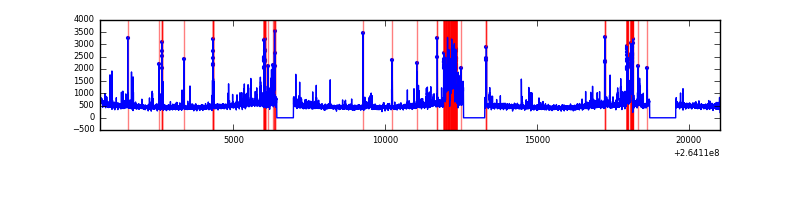 |
| C | 20419 | 18312 | 0 | 0 | 0.00% | 0.00% | 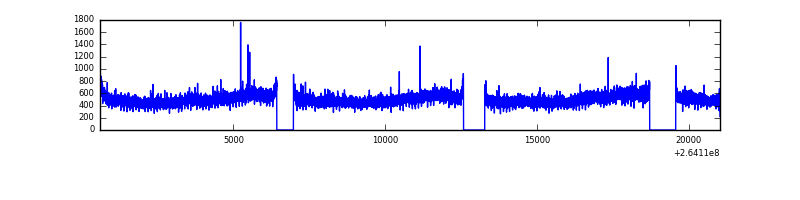 |
| D | 20419 | 18312 | 158 | 158 | 0.77% | 0.86% | 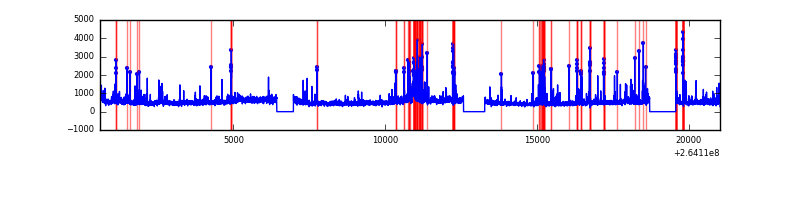 |
Top three noisy pixels from each quadrant. If the there are fewer than three noisy pixels in the level2.evt file, extra rows are filled as -1
| Pixel properties | Quadrant properties | ||||||
|---|---|---|---|---|---|---|---|
| Quadrant | DetID | PixID | Counts | Sigma | Mean | Median | Sigma |
| A | 8 | 15 | 270516 | 626.72 | 2134 | 2089 | 428.3 |
| A | 12 | 189 | 193976 | 448.02 | 2134 | 2089 | 428.3 |
| A | 9 | 143 | 51916 | 116.34 | 2134 | 2089 | 428.3 |
| B | 0 | 182 | 1017443 | 2520.02 | 2124 | 2067 | 402.9 |
| B | 0 | 229 | 360833 | 890.41 | 2124 | 2067 | 402.9 |
| B | 4 | 97 | 143368 | 350.69 | 2124 | 2067 | 402.9 |
| C | 3 | 233 | 1043660 | 2180.15 | 2070 | 2078 | 477.8 |
| C | 13 | 61 | 14988 | 27.02 | 2070 | 2078 | 477.8 |
| C | 14 | 234 | 12653 | 22.13 | 2070 | 2078 | 477.8 |
| D | 8 | 195 | 907744 | 1751.52 | 2044 | 1993 | 517.1 |
| D | 5 | 222 | 697341 | 1344.64 | 2044 | 1993 | 517.1 |
| D | 12 | 110 | 316169 | 607.54 | 2044 | 1993 | 517.1 |
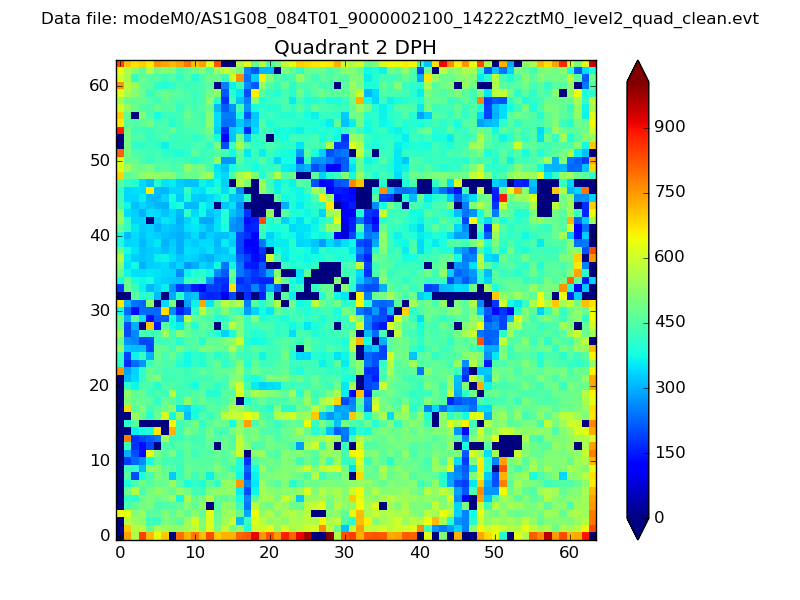
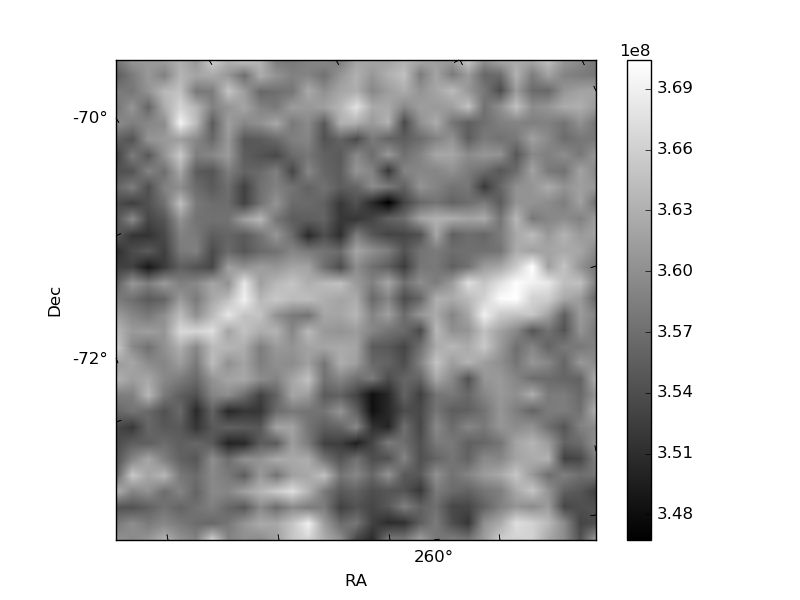
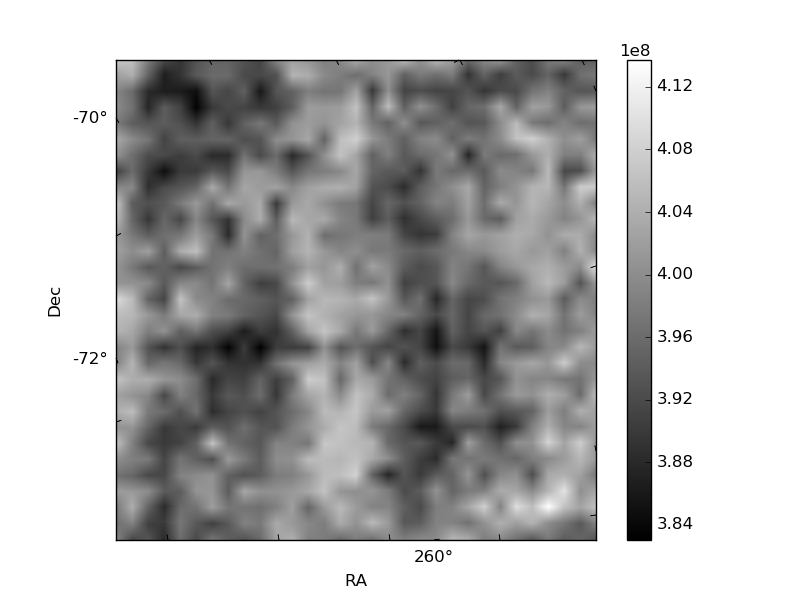
Histogram calculated using DETX and DETY for each event in the final _common_clean file
| Quadrant A | 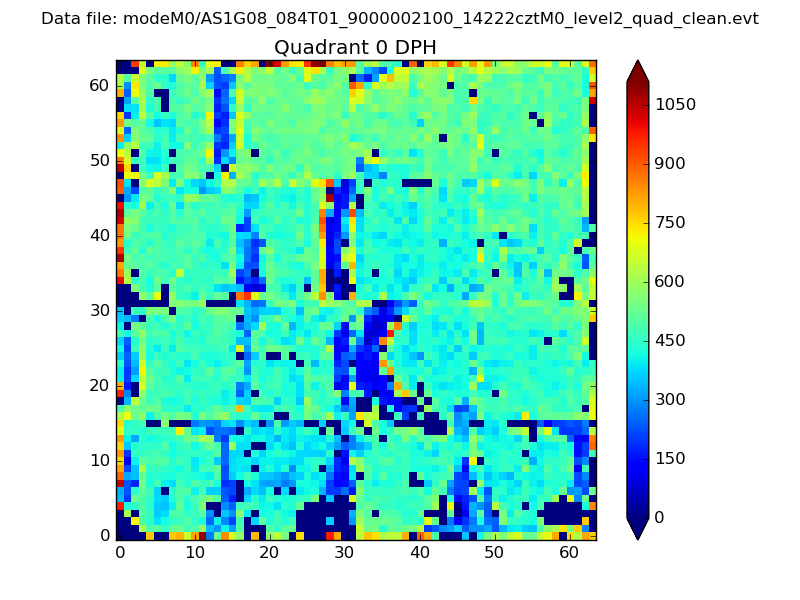 |
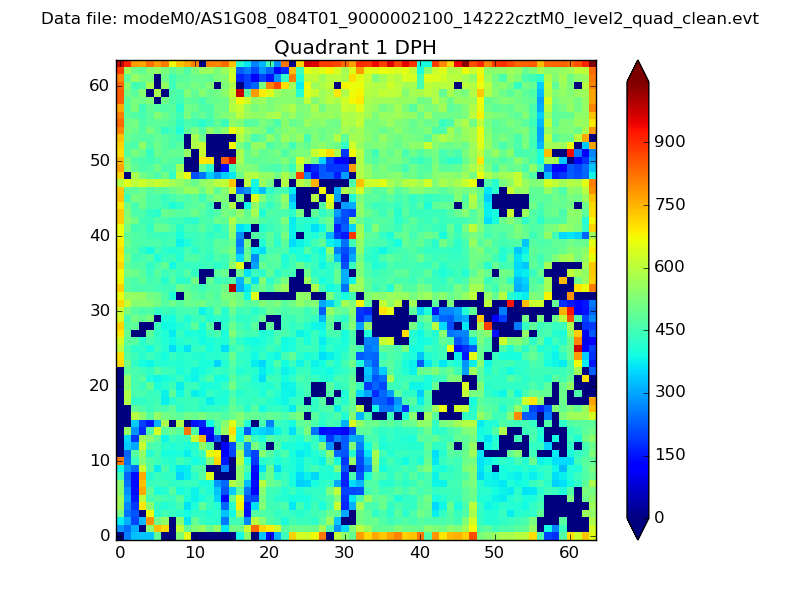 |
Quadrant B |
|---|---|---|---|
| Quadrant D | 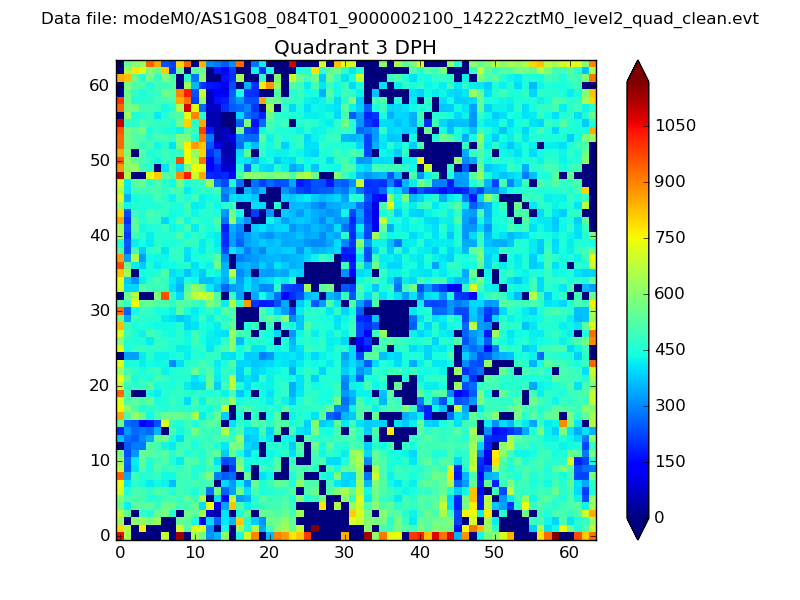 |
 |
Quadrant C |
| Plot type | Count rate plots | Images |
|---|---|---|
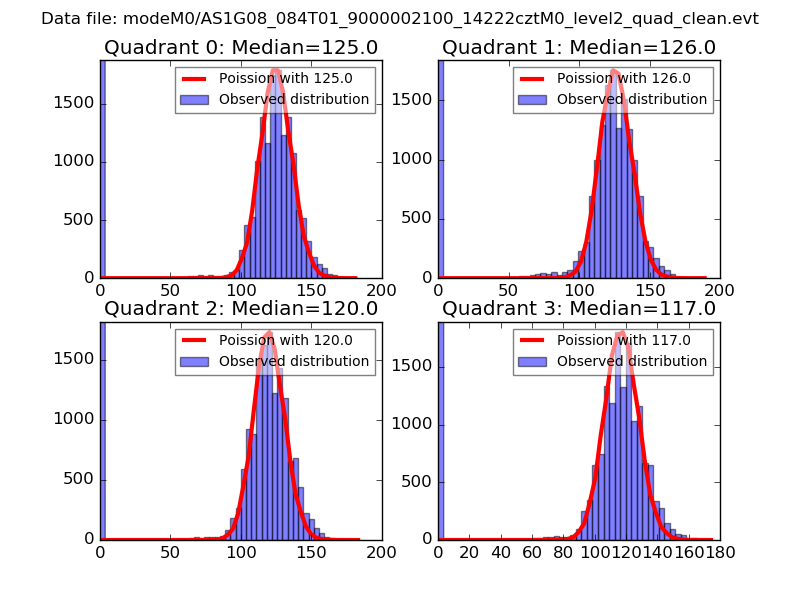
| Comparison with Poisson distribution Blue bars denote a histogram of data divided into 1 sec bins. Red curve is a Poisson curve with rate = median count rate of data. |
 |
 |
| Quadrant-wise count rates Data is divided into 100 sec bins |
 |
|
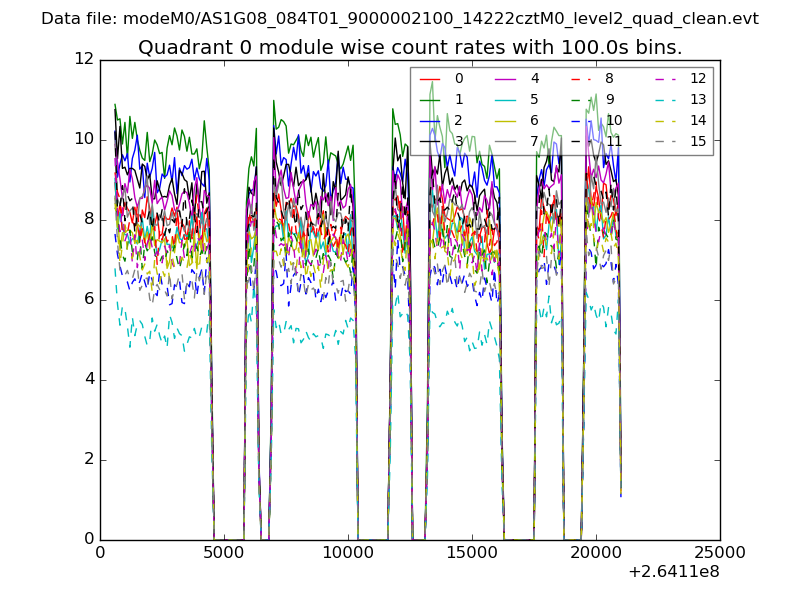
| Module-wise count rates for Quadrant A Data is divided into 100 sec bins |
 |
 |
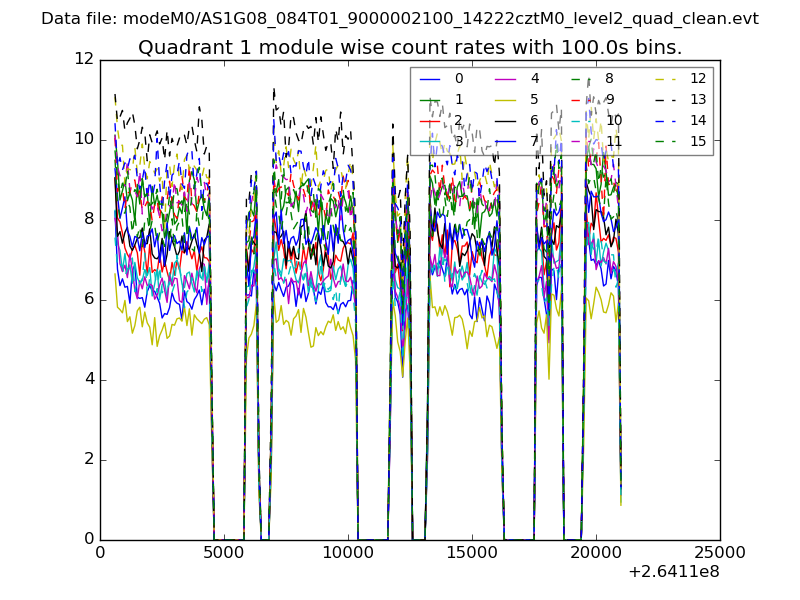
| Module-wise count rates for Quadrant B Data is divided into 100 sec bins |
 |
 |
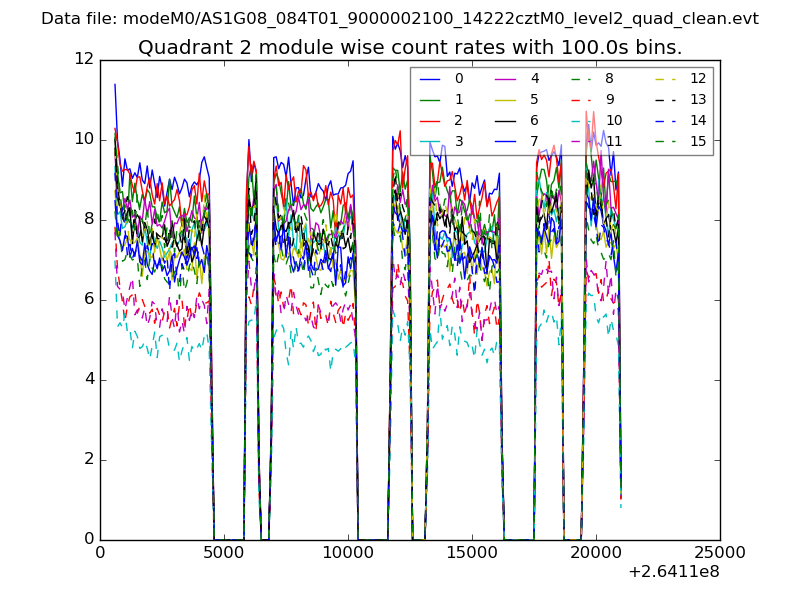
| Module-wise count rates for Quadrant C Data is divided into 100 sec bins |
 |
 |
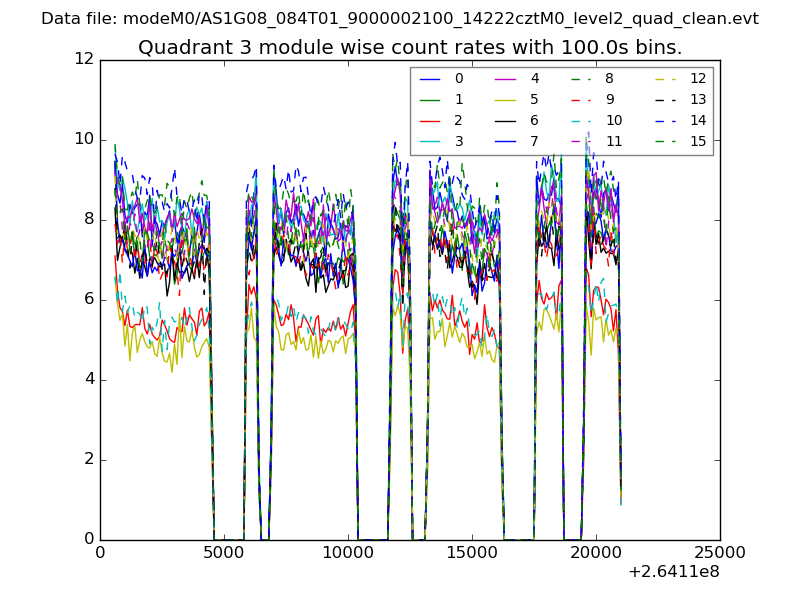
| Module-wise count rates for Quadrant D Data is divided into 100 sec bins |
 |
 |
| Parameter | Plot |
|---|---|
| CZT HV Monitor | 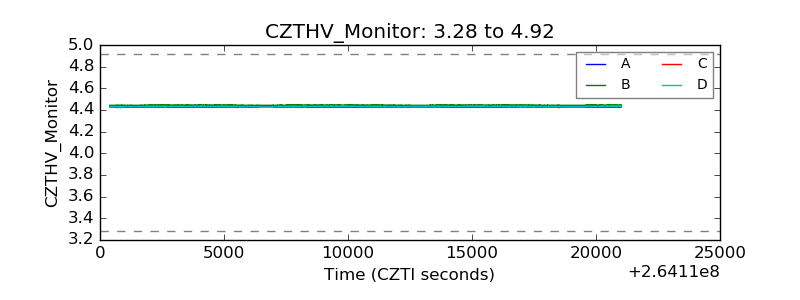 |
| D_VDD | 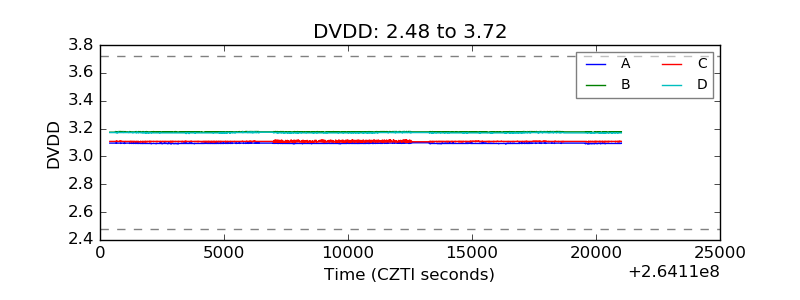 |
| Temperature 1 | 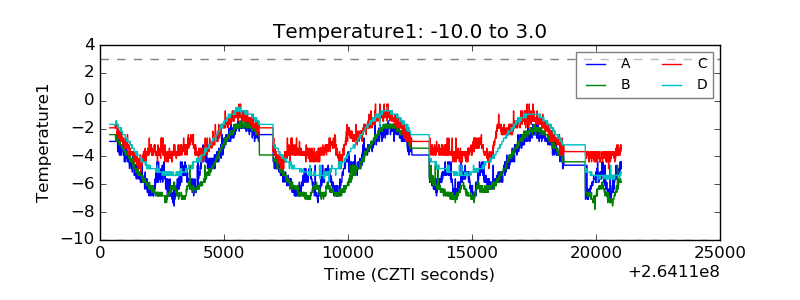 |
| Veto HV Monitor | 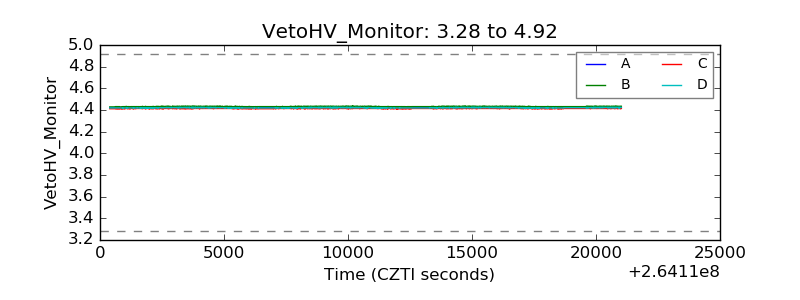 |
| Veto LLD | 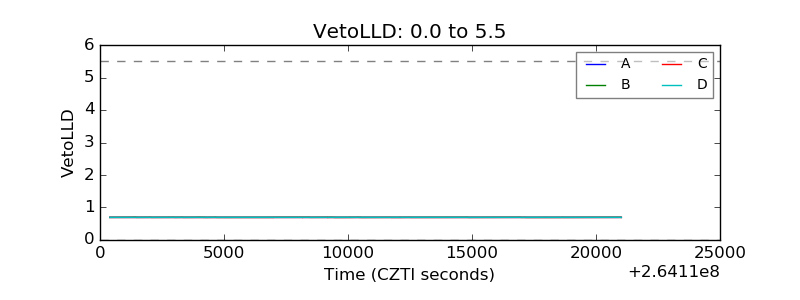 |
| Alpha Counter | 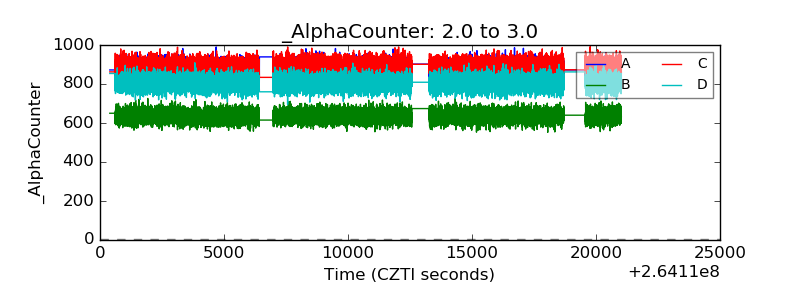 |
| _CPM_Rate | 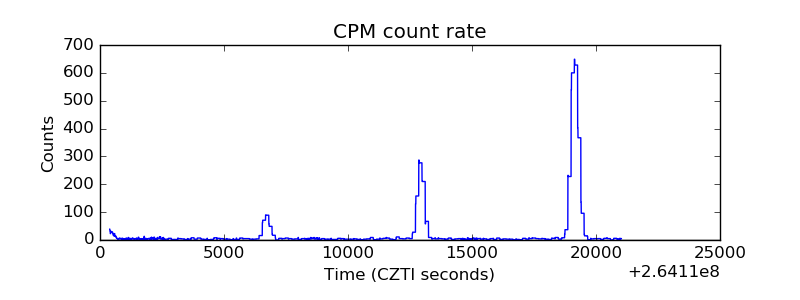 |
| CZT Counter |  |
| +2.5 Volts monitor |  |
| +5 Volts monitor |  |
| _ROLL_ROT | 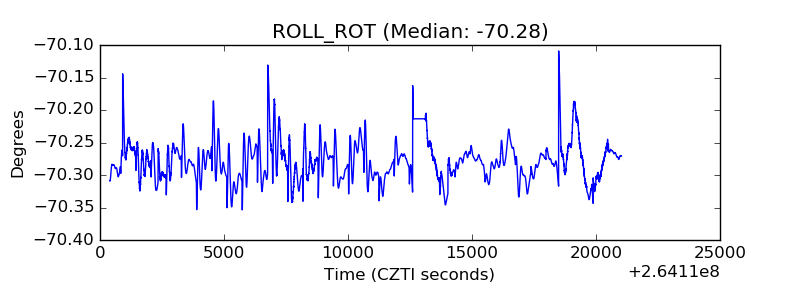 |
| _Roll_DEC | 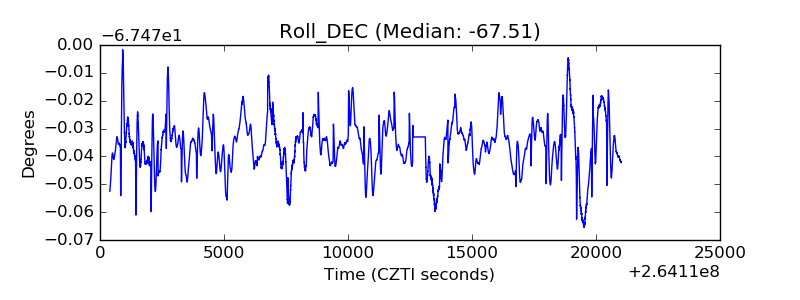 |
| _Roll_RA |  |
| Veto Counter | 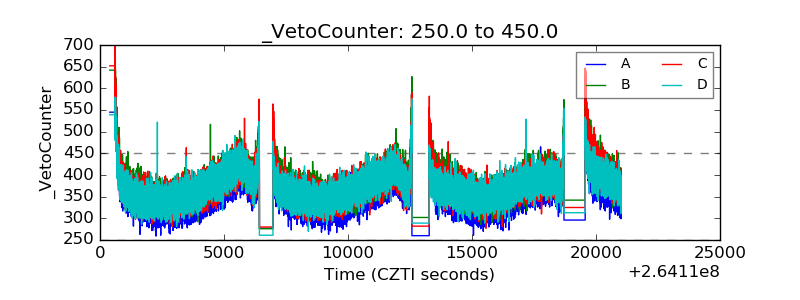 |