| Param | Original file | Final file |
|---|---|---|
| Filename | modeM0/AS1G08_084T01_9000002100_14224cztM0_level2.evt | modeM0/AS1G08_084T01_9000002100_14224cztM0_level2_quad_clean.evt |
| Size (bytes) | 499,559,040 | 116,481,600 |
| Size | 476.4 MB | 111.1 MB |
| Events in quadrant A | 3,389,249 | 771,050 |
| Events in quadrant B | 3,786,051 | 784,359 |
| Events in quadrant C | 3,686,388 | 756,540 |
| Events in quadrant D | 3,800,367 | 736,459 |
| Mode SS | |||
|---|---|---|---|
| Quadrant | BADHDUFLAG | Total packets | Discarded packets |
| A | 0 | 140 | 0 |
| B | 0 | 140 | 0 |
| C | 0 | 140 | 0 |
| D | 0 | 140 | 0 |
| Mode M0 | |||
|---|---|---|---|
| Quadrant | BADHDUFLAG | Total packets | Discarded packets |
| A | 0 | 14367 | 3 |
| B | 0 | 15529 | 2 |
| C | 0 | 14915 | 2 |
| D | 0 | 15631 | 2 |
| Mode M9 | |||
|---|---|---|---|
| Quadrant | BADHDUFLAG | Total packets | Discarded packets |
| A | 0 | 21 | 0 |
| B | 0 | 21 | 0 |
| C | 0 | 21 | 0 |
| D | 0 | 21 | 0 |
| Quadrant | Total seconds | Saturated seconds | Saturation percentage |
|---|---|---|---|
| A | 6889 | 27 | 0.391929% |
| B | 6889 | 132 | 1.916098% |
| C | 6889 | 58 | 0.841922% |
| D | 6889 | 65 | 0.943533% |
Noise dominated data is calculated using 1-second bins in cleaned event files. If a bin has >2000 counts, and if more than 50% of those come from <1% of pixels, then it is considered to be noise-dominated and hence unusable.
| Quadrant | # 1 sec bins | Bins with >0 counts | Bins with >2000 counts | High rate bins dominated by noise | Noise dominated (total time) | Noise dominated (detector-on time) | Marked lightcurve |
|---|---|---|---|---|---|---|---|
| A | 8955 | 6892 | 1 | 1 | 0.01% | 0.01% |  |
| B | 8955 | 6892 | 49 | 49 | 0.55% | 0.71% |  |
| C | 8955 | 6892 | 0 | 0 | 0.00% | 0.00% | 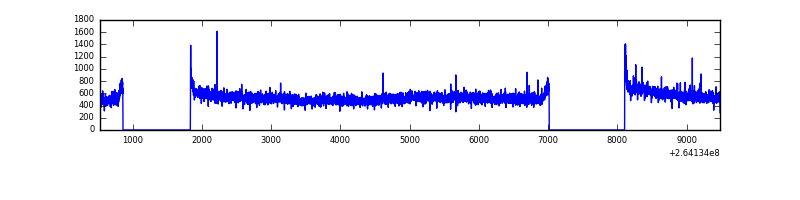 |
| D | 8955 | 6892 | 14 | 14 | 0.16% | 0.20% | 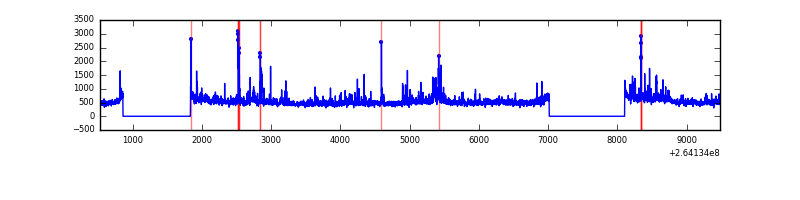 |
Top three noisy pixels from each quadrant. If the there are fewer than three noisy pixels in the level2.evt file, extra rows are filled as -1
| Pixel properties | Quadrant properties | ||||||
|---|---|---|---|---|---|---|---|
| Quadrant | DetID | PixID | Counts | Sigma | Mean | Median | Sigma |
| A | 8 | 15 | 66443 | 383.4 | 847 | 829 | 171.1 |
| A | 12 | 189 | 47310 | 271.6 | 847 | 829 | 171.1 |
| A | 9 | 143 | 8309 | 43.71 | 847 | 829 | 171.1 |
| B | 0 | 182 | 291348 | 1835.78 | 849 | 828 | 158.3 |
| B | 0 | 229 | 60615 | 377.79 | 849 | 828 | 158.3 |
| B | 4 | 97 | 42101 | 260.8 | 849 | 828 | 158.3 |
| C | 3 | 233 | 432038 | 2248.44 | 834 | 838 | 191.8 |
| C | 13 | 61 | 5868 | 26.23 | 834 | 838 | 191.8 |
| C | 14 | 234 | 5092 | 22.18 | 834 | 838 | 191.8 |
| D | 10 | 199 | 283092 | 1456.09 | 823 | 802 | 193.9 |
| D | 8 | 195 | 204780 | 1052.15 | 823 | 802 | 193.9 |
| D | 5 | 222 | 124010 | 635.52 | 823 | 802 | 193.9 |
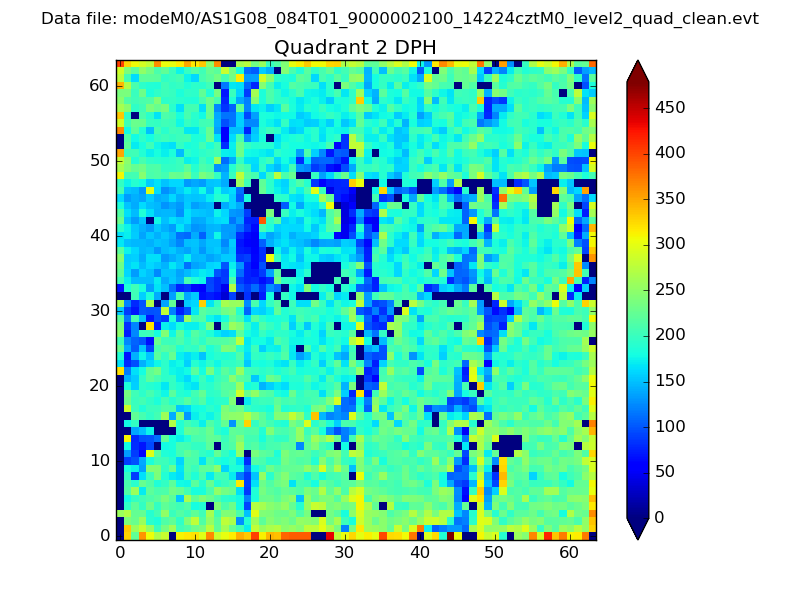
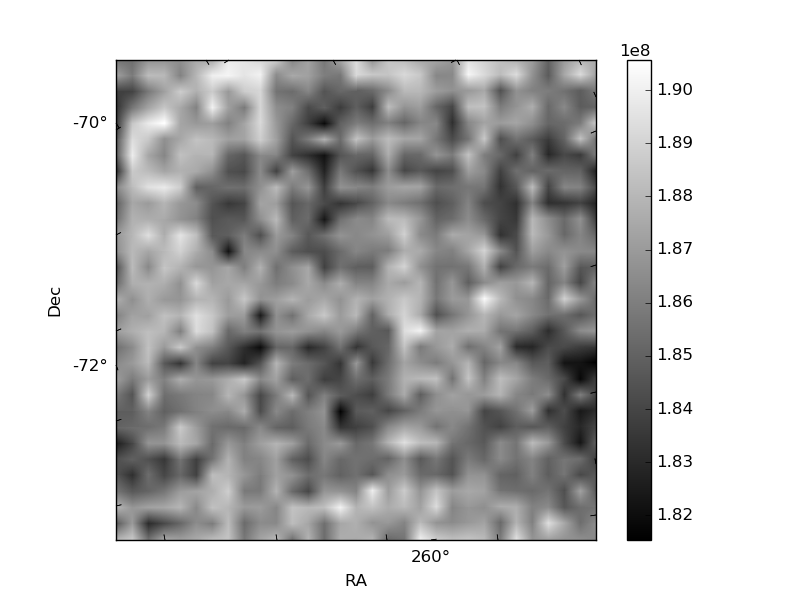
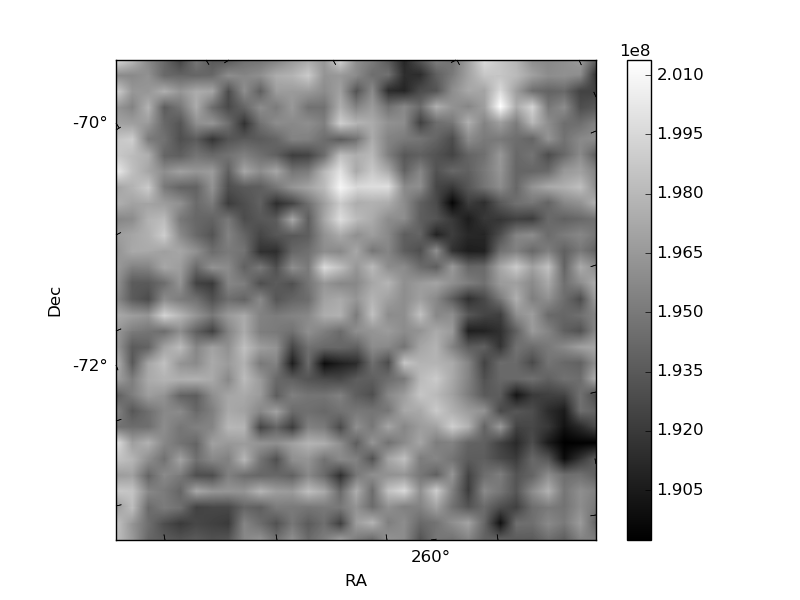
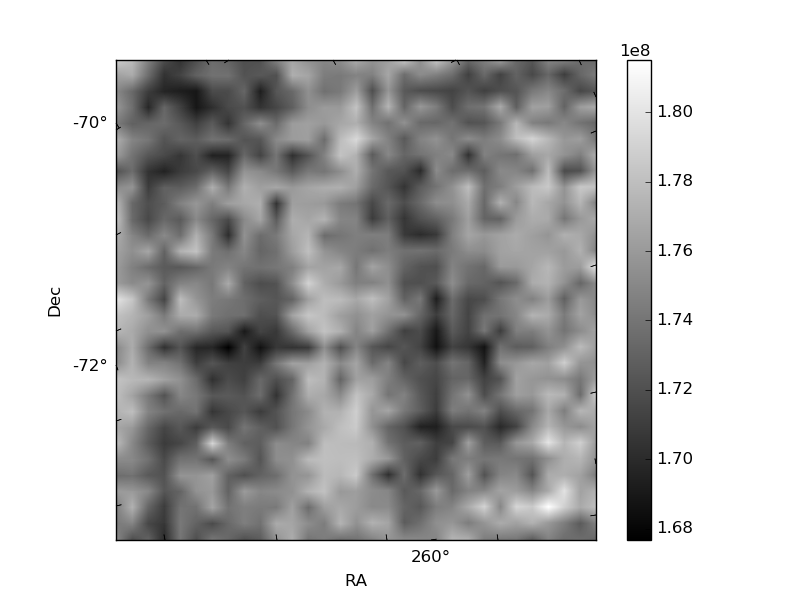
Histogram calculated using DETX and DETY for each event in the final _common_clean file
| Quadrant A | 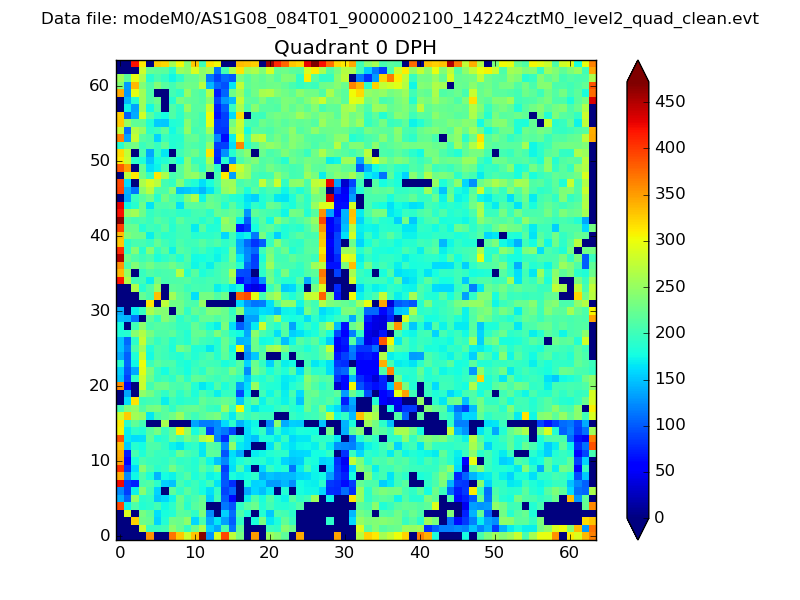 |
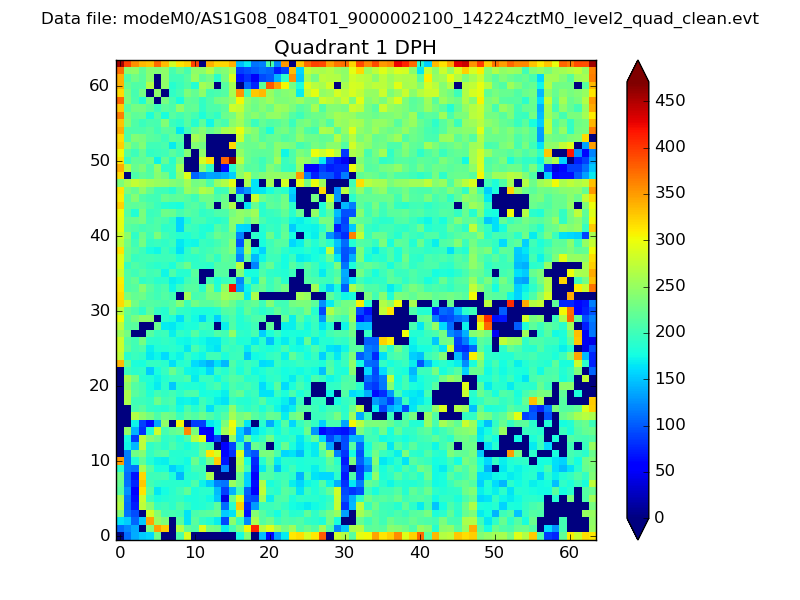 |
Quadrant B |
|---|---|---|---|
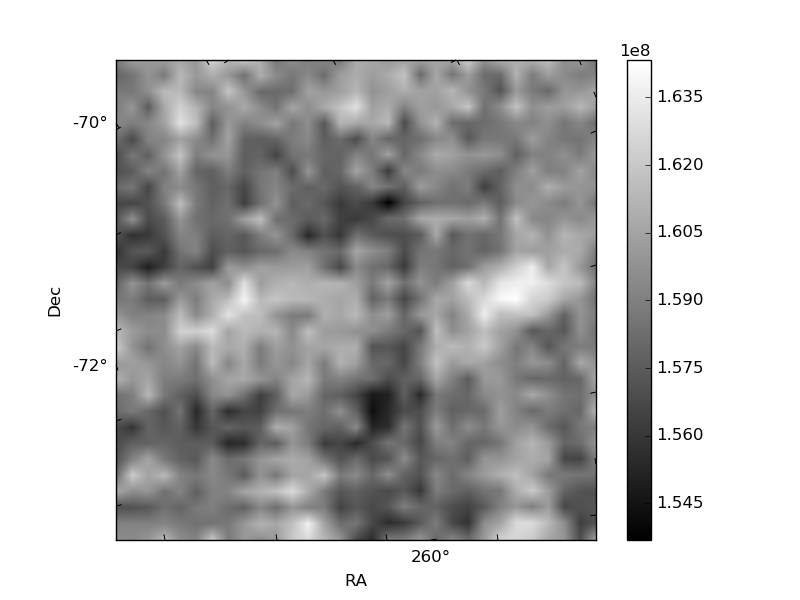
| Quadrant D | 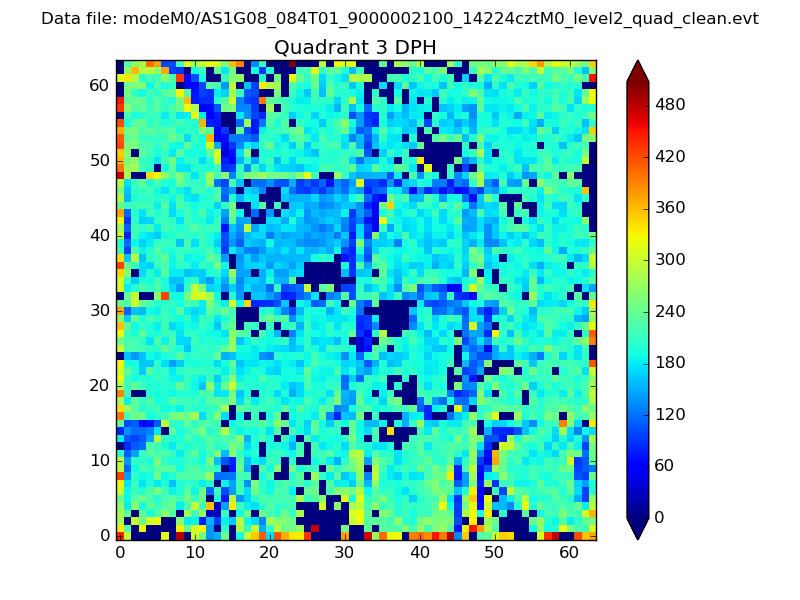 |
 |
Quadrant C |
| Plot type | Count rate plots | Images |
|---|---|---|
| Comparison with Poisson distribution Blue bars denote a histogram of data divided into 1 sec bins. Red curve is a Poisson curve with rate = median count rate of data. |
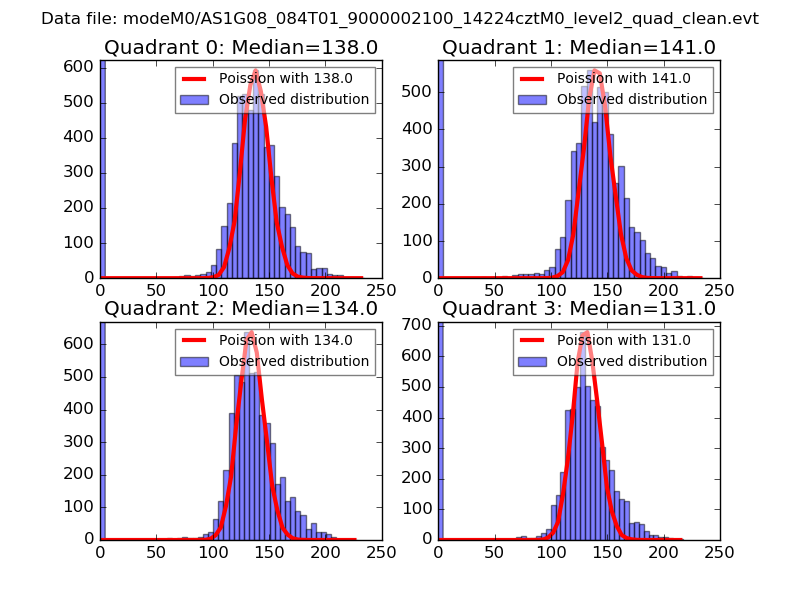 |
 |
| Quadrant-wise count rates Data is divided into 100 sec bins |
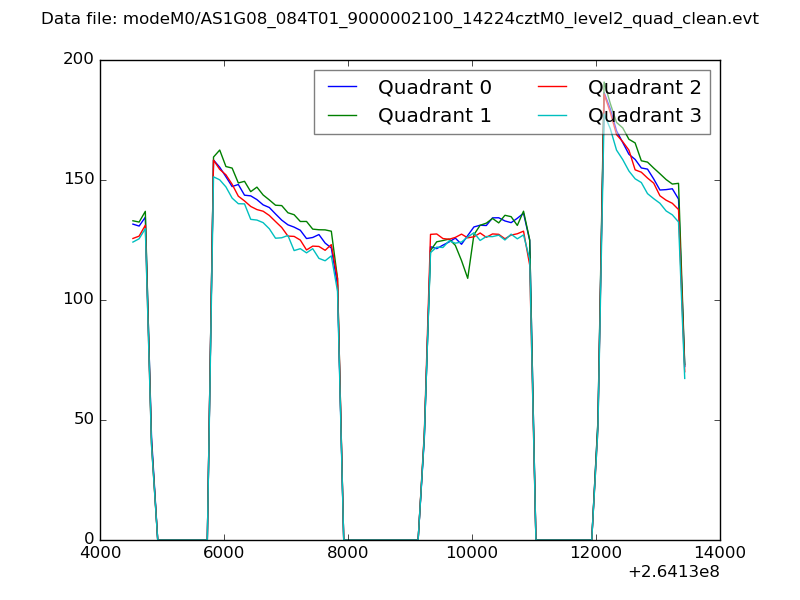 |
|
| Module-wise count rates for Quadrant A Data is divided into 100 sec bins |
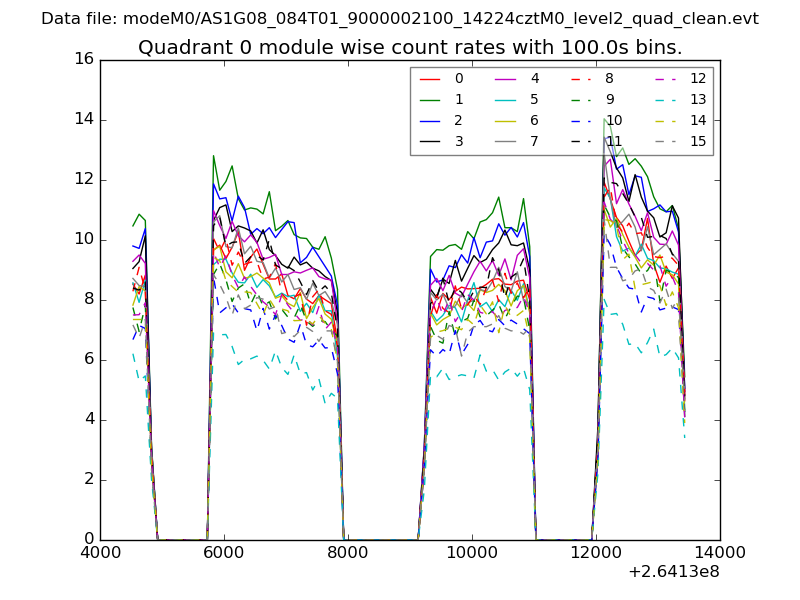 |
 |
| Module-wise count rates for Quadrant B Data is divided into 100 sec bins |
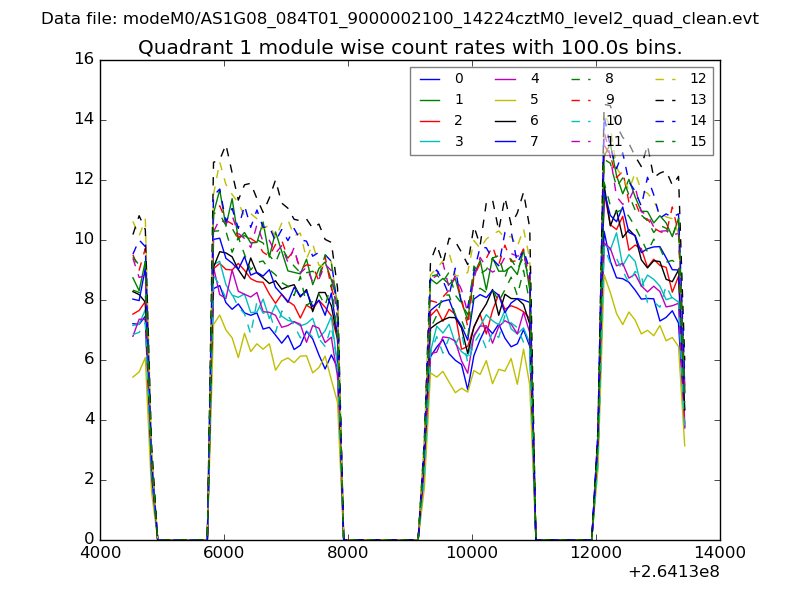 |
 |
| Module-wise count rates for Quadrant C Data is divided into 100 sec bins |
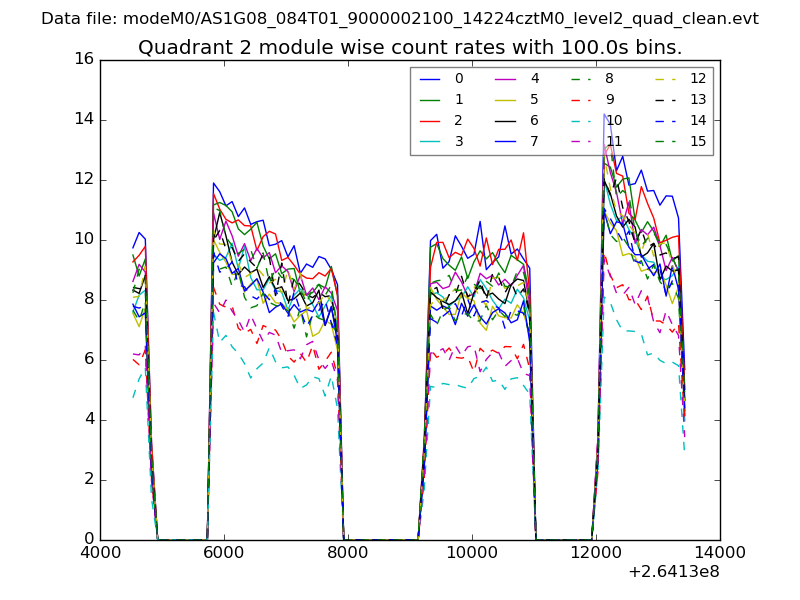 |
 |
| Module-wise count rates for Quadrant D Data is divided into 100 sec bins |
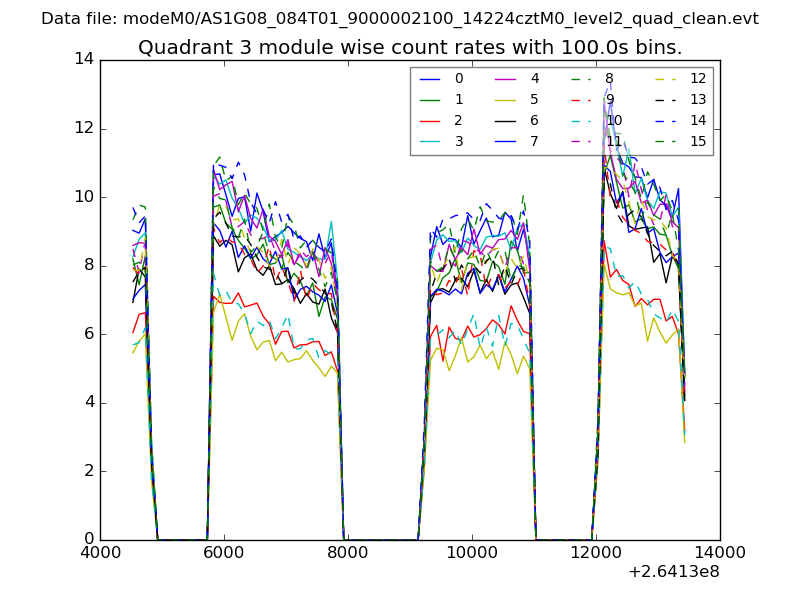 |
 |
| Parameter | Plot |
|---|---|
| CZT HV Monitor | 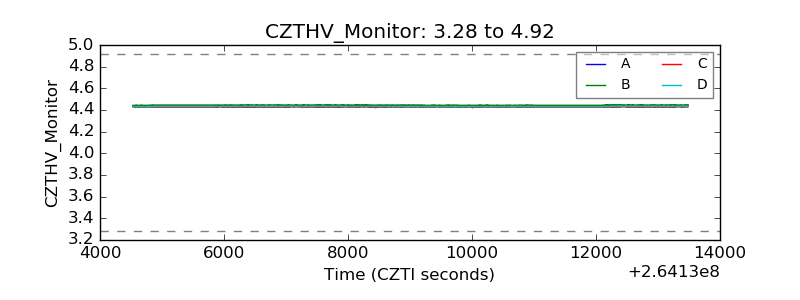 |
| D_VDD | 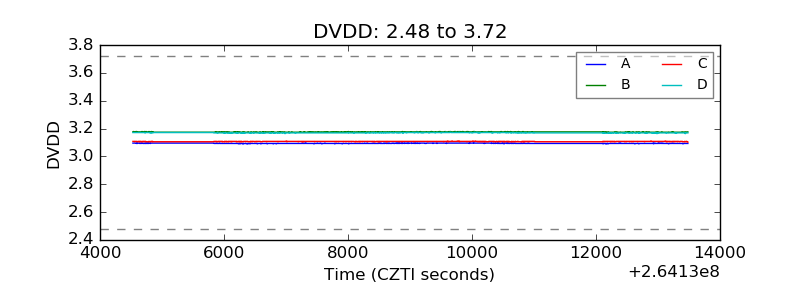 |
| Temperature 1 | 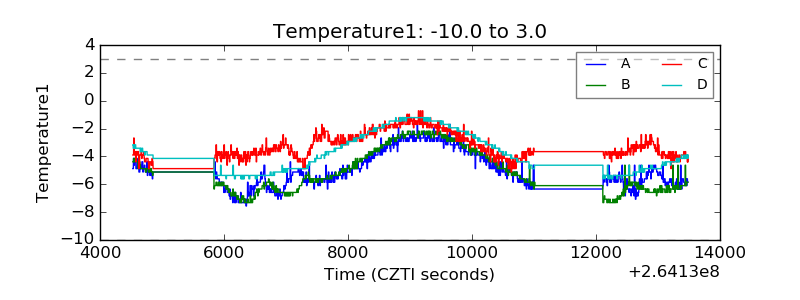 |
| Veto HV Monitor | 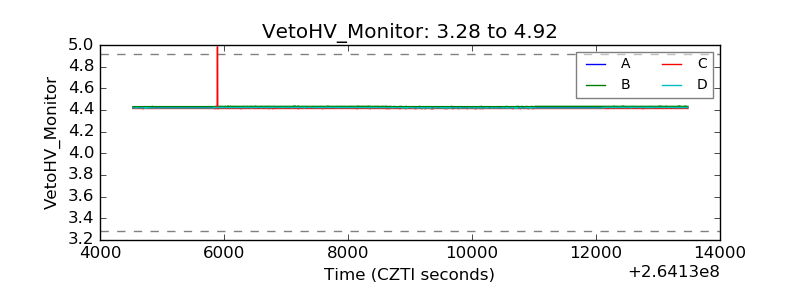 |
| Veto LLD | 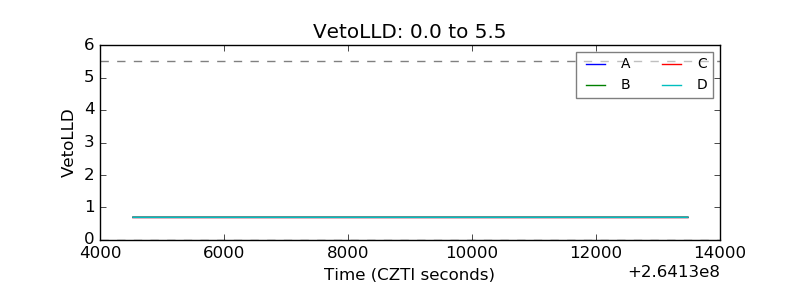 |
| Alpha Counter | 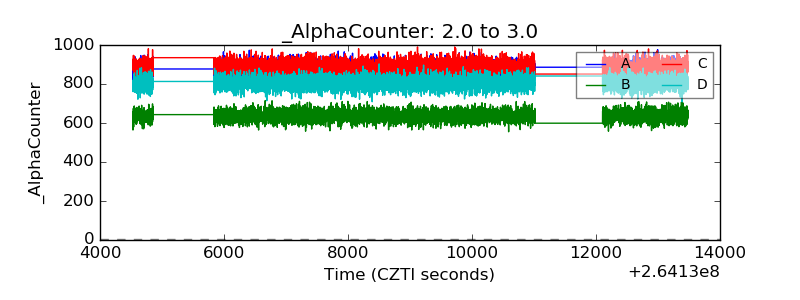 |
| _CPM_Rate | 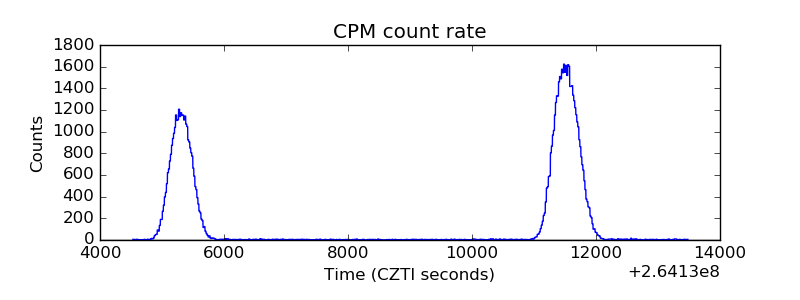 |
| CZT Counter | 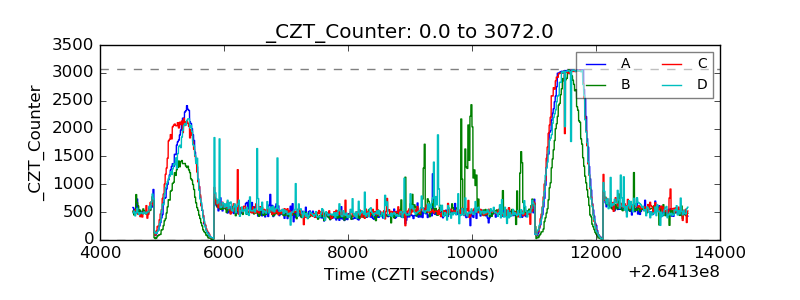 |
| +2.5 Volts monitor | 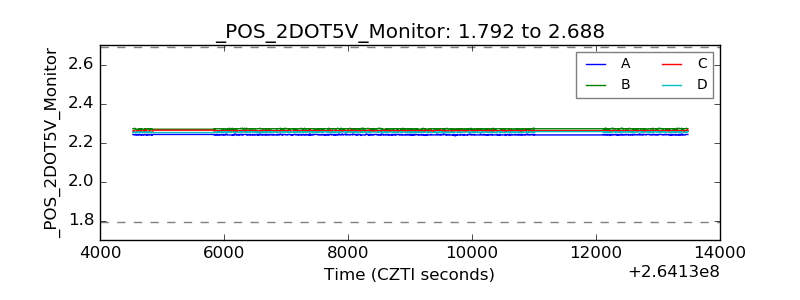 |
| +5 Volts monitor |  |
| _ROLL_ROT | 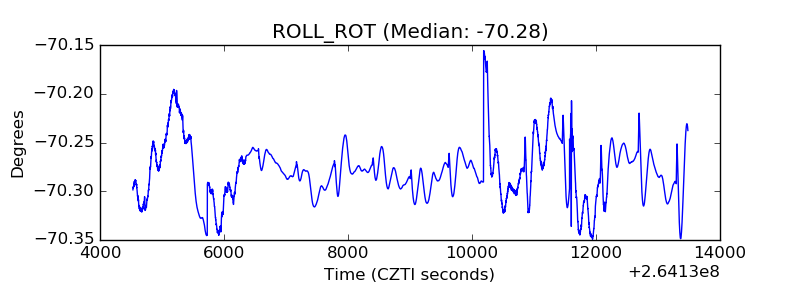 |
| _Roll_DEC | 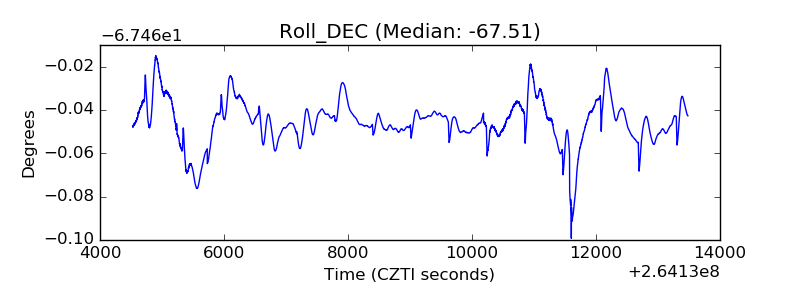 |
| _Roll_RA | 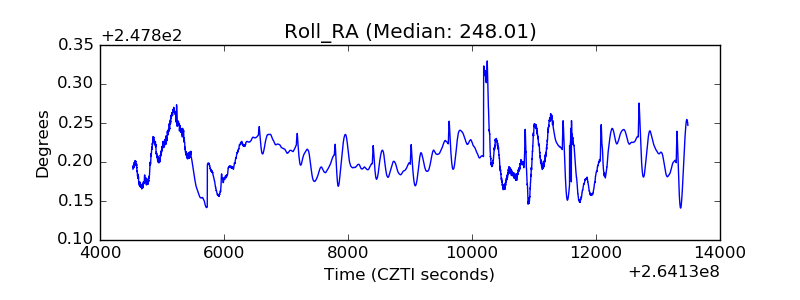 |
| Veto Counter | 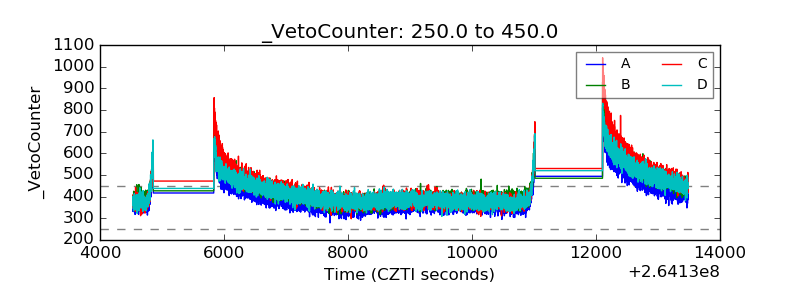 |