| Param | Original file | Final file |
|---|---|---|
| Filename | modeM0/AS1G08_084T01_9000002100_14227cztM0_level2.evt | modeM0/AS1G08_084T01_9000002100_14227cztM0_level2_quad_clean.evt |
| Size (bytes) | 524,632,320 | 103,639,680 |
| Size | 500.3 MB | 98.8 MB |
| Events in quadrant A | 3,303,990 | 688,681 |
| Events in quadrant B | 3,506,636 | 698,337 |
| Events in quadrant C | 3,522,629 | 673,892 |
| Events in quadrant D | 5,128,509 | 638,465 |
| Mode SS | |||
|---|---|---|---|
| Quadrant | BADHDUFLAG | Total packets | Discarded packets |
| A | 0 | 128 | 0 |
| B | 0 | 128 | 0 |
| C | 0 | 128 | 0 |
| D | 0 | 128 | 0 |
| Mode M0 | |||
|---|---|---|---|
| Quadrant | BADHDUFLAG | Total packets | Discarded packets |
| A | 0 | 13652 | 3 |
| B | 0 | 14283 | 2 |
| C | 0 | 14297 | 2 |
| D | 0 | 19503 | 2 |
| Mode M9 | |||
|---|---|---|---|
| Quadrant | BADHDUFLAG | Total packets | Discarded packets |
| A | 0 | 15 | 0 |
| B | 0 | 15 | 0 |
| C | 0 | 15 | 0 |
| D | 0 | 16 | 0 |
| Quadrant | Total seconds | Saturated seconds | Saturation percentage |
|---|---|---|---|
| A | 6295 | 67 | 1.064337% |
| B | 6295 | 88 | 1.397935% |
| C | 6295 | 62 | 0.984909% |
| D | 6295 | 383 | 6.084194% |
Noise dominated data is calculated using 1-second bins in cleaned event files. If a bin has >2000 counts, and if more than 50% of those come from <1% of pixels, then it is considered to be noise-dominated and hence unusable.
| Quadrant | # 1 sec bins | Bins with >0 counts | Bins with >2000 counts | High rate bins dominated by noise | Noise dominated (total time) | Noise dominated (detector-on time) | Marked lightcurve |
|---|---|---|---|---|---|---|---|
| A | 7556 | 6297 | 6 | 6 | 0.08% | 0.10% |  |
| B | 7556 | 6297 | 8 | 8 | 0.11% | 0.13% |  |
| C | 7556 | 6297 | 2 | 2 | 0.03% | 0.03% |  |
| D | 7556 | 6297 | 241 | 241 | 3.19% | 3.83% |  |
Top three noisy pixels from each quadrant. If the there are fewer than three noisy pixels in the level2.evt file, extra rows are filled as -1
| Pixel properties | Quadrant properties | ||||||
|---|---|---|---|---|---|---|---|
| Quadrant | DetID | PixID | Counts | Sigma | Mean | Median | Sigma |
| A | 12 | 189 | 40796 | 242.49 | 830 | 814 | 164.9 |
| A | 9 | 143 | 27676 | 162.92 | 830 | 814 | 164.9 |
| A | 8 | 15 | 22024 | 128.64 | 830 | 814 | 164.9 |
| B | 0 | 229 | 119686 | 776.83 | 825 | 806 | 153.0 |
| B | 4 | 97 | 41896 | 268.51 | 825 | 806 | 153.0 |
| B | 4 | 48 | 39803 | 254.83 | 825 | 806 | 153.0 |
| C | 3 | 233 | 342212 | 1847.87 | 812 | 818 | 184.7 |
| C | 14 | 234 | 8769 | 43.04 | 812 | 818 | 184.7 |
| C | 13 | 61 | 5716 | 26.51 | 812 | 818 | 184.7 |
| D | 12 | 110 | 804828 | 4347.18 | 798 | 780 | 185.0 |
| D | 5 | 222 | 506524 | 2734.37 | 798 | 780 | 185.0 |
| D | 10 | 199 | 266791 | 1438.22 | 798 | 780 | 185.0 |
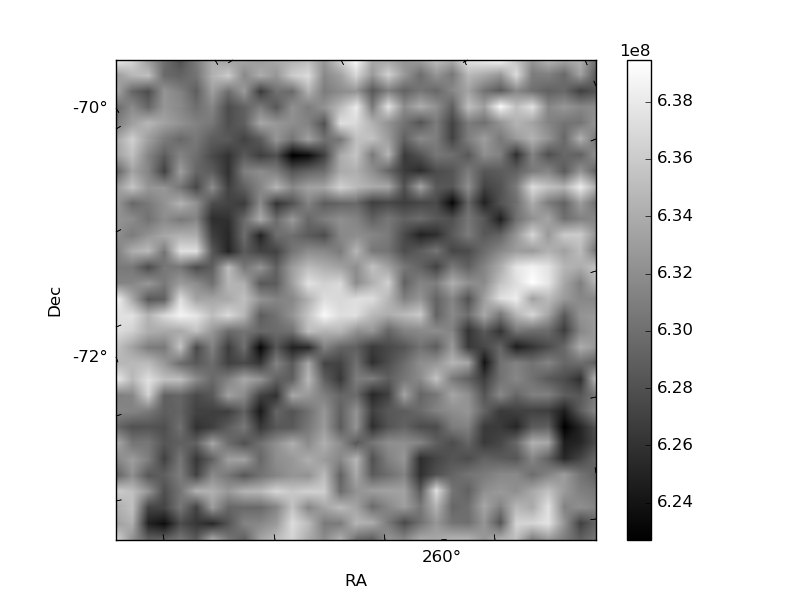
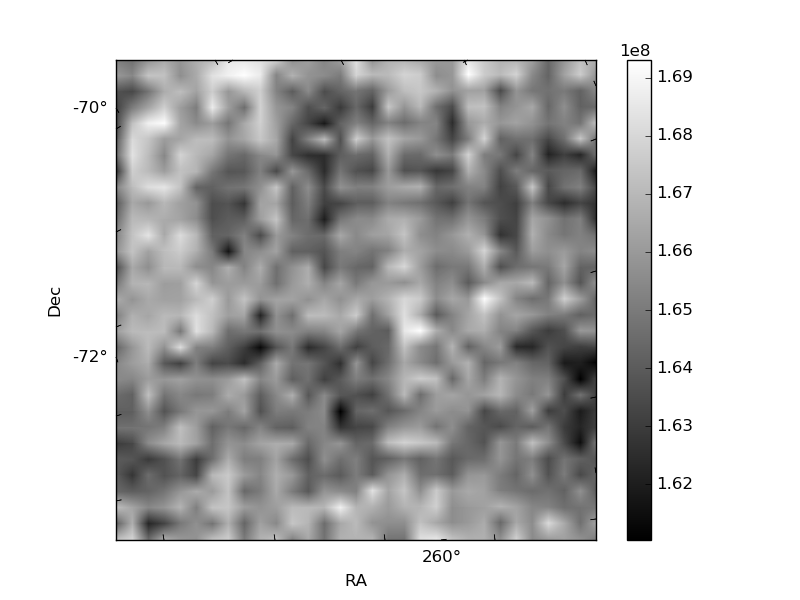
Histogram calculated using DETX and DETY for each event in the final _common_clean file
| Quadrant A | 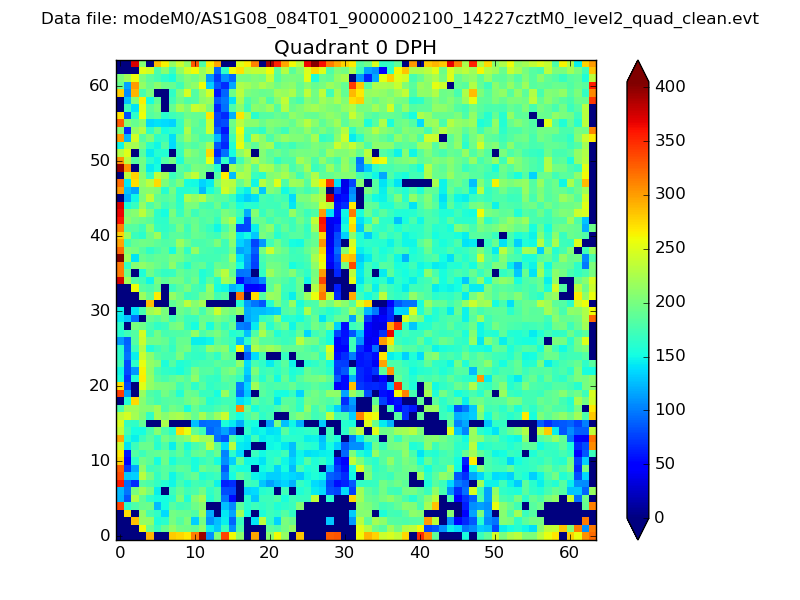 |
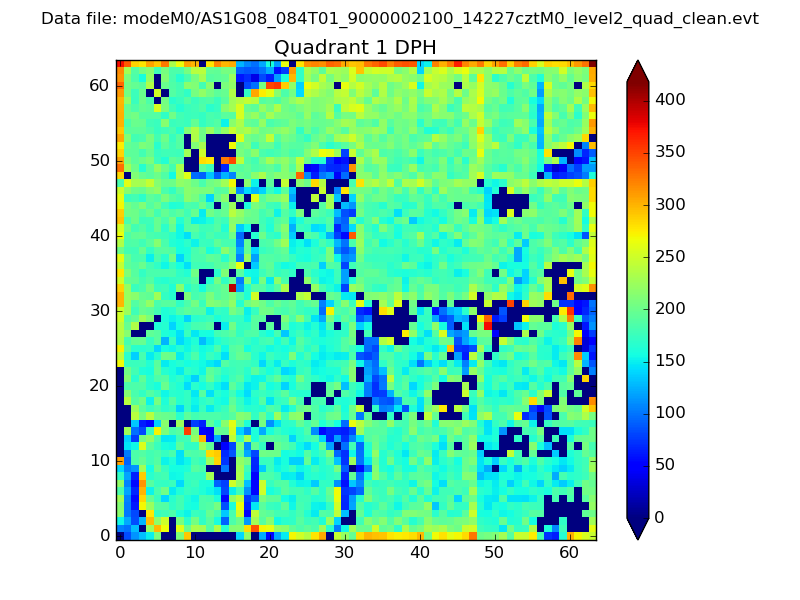 |
Quadrant B |
|---|---|---|---|
| Quadrant D |  |
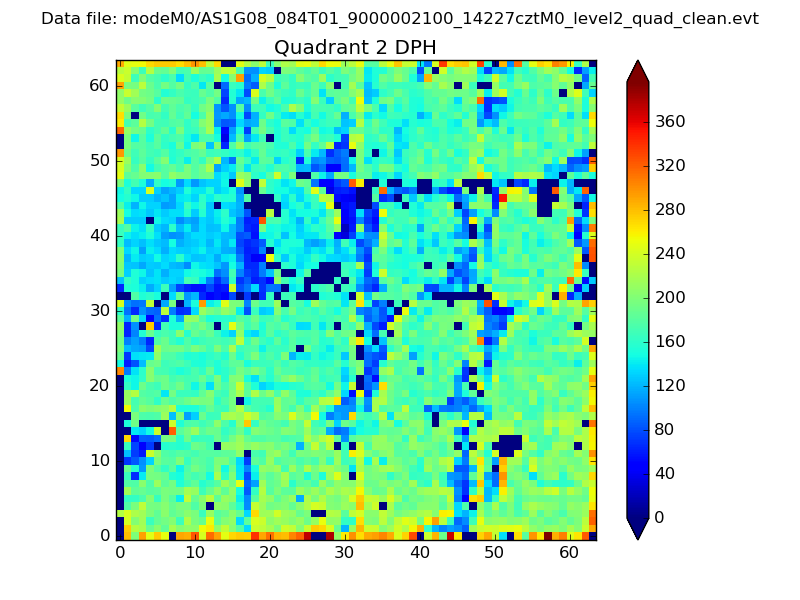 |
Quadrant C |
| Plot type | Count rate plots | Images |
|---|---|---|
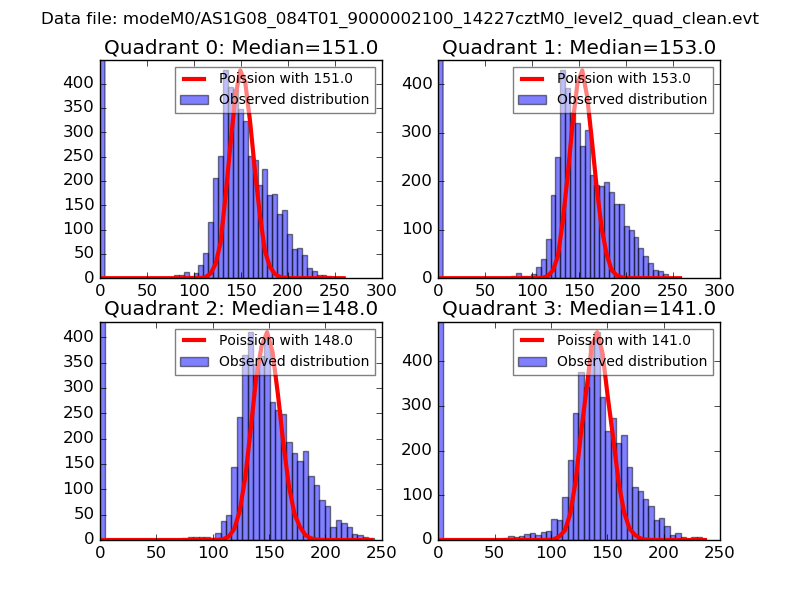
| Comparison with Poisson distribution Blue bars denote a histogram of data divided into 1 sec bins. Red curve is a Poisson curve with rate = median count rate of data. |
 |
 |
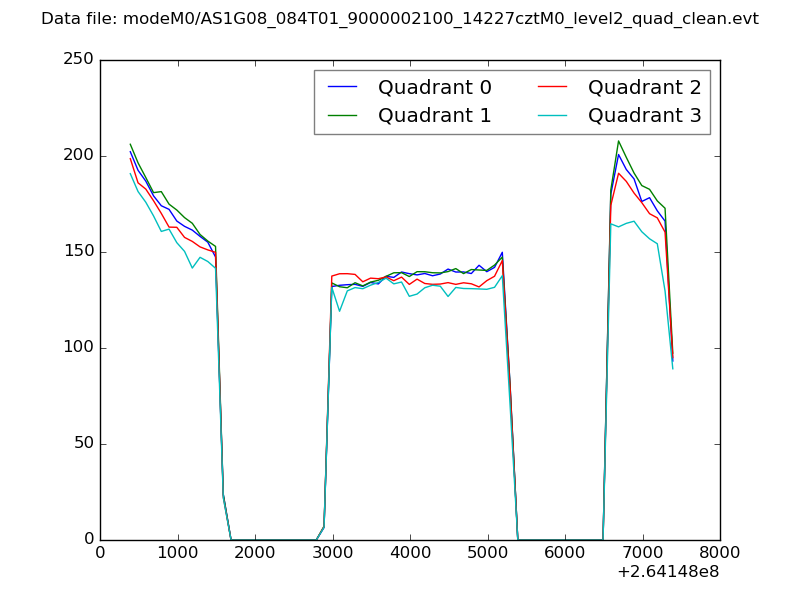
| Quadrant-wise count rates Data is divided into 100 sec bins |
 |
|
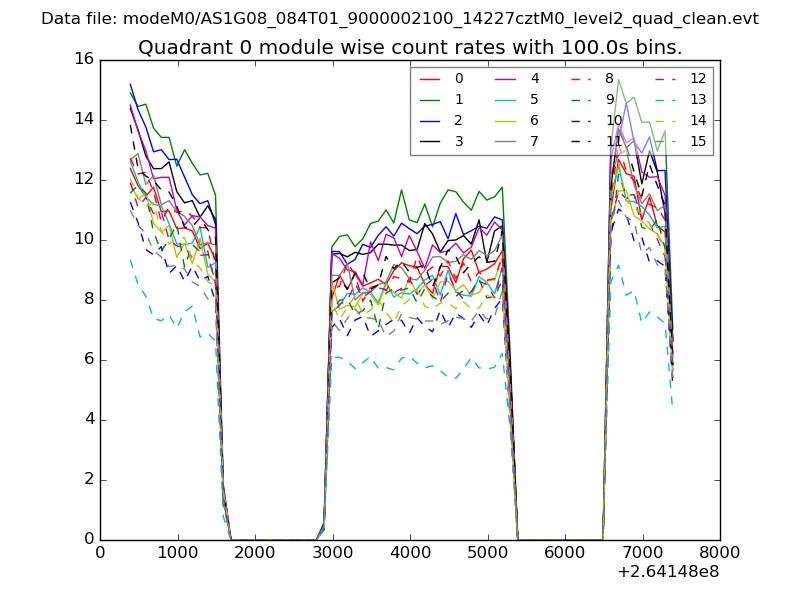
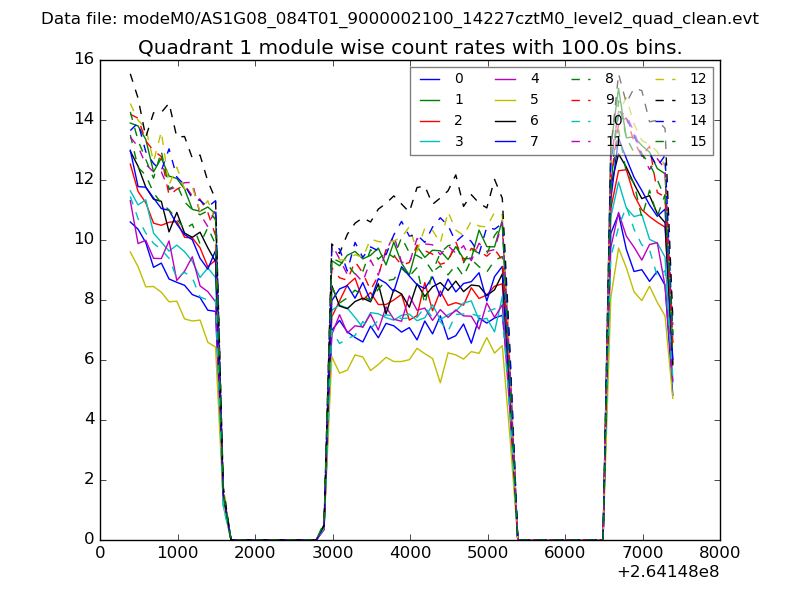
| Module-wise count rates for Quadrant A Data is divided into 100 sec bins |
 |
 |
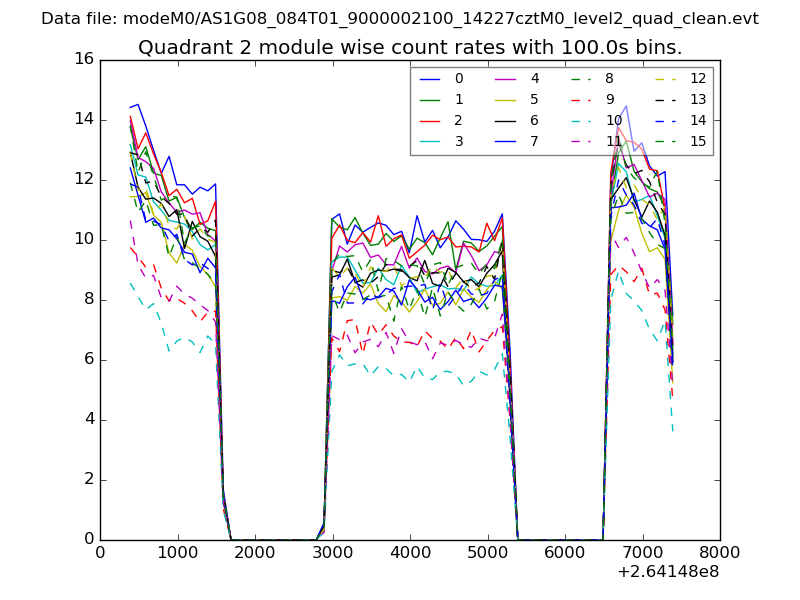
| Module-wise count rates for Quadrant B Data is divided into 100 sec bins |
 |
 |
| Module-wise count rates for Quadrant C Data is divided into 100 sec bins |
 |
 |
| Module-wise count rates for Quadrant D Data is divided into 100 sec bins |
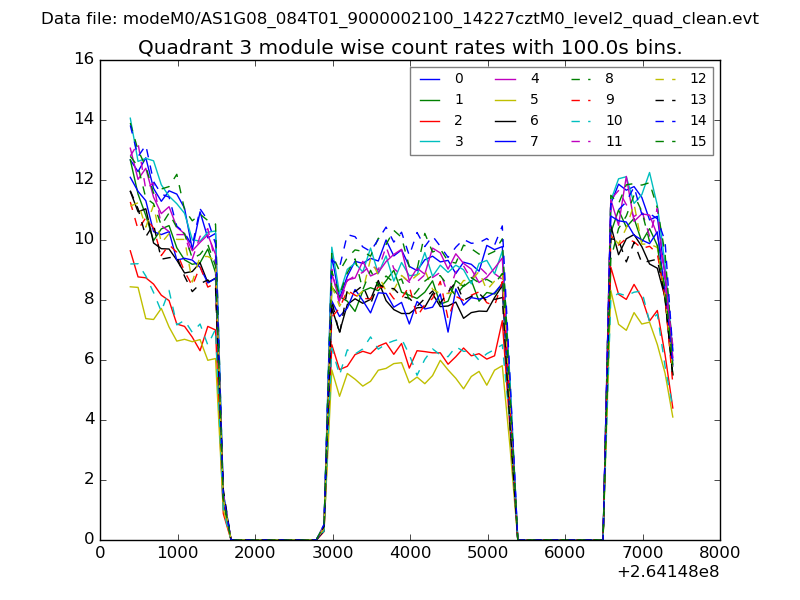 |
 |
| Parameter | Plot |
|---|---|
| CZT HV Monitor |  |
| D_VDD | 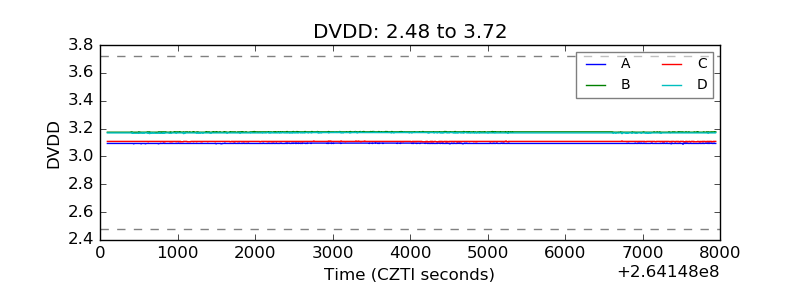 |
| Temperature 1 | 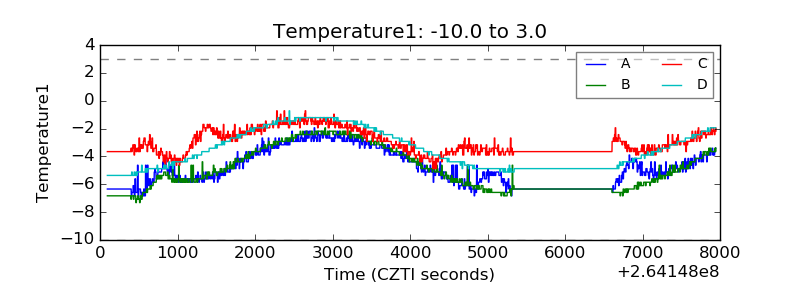 |
| Veto HV Monitor | 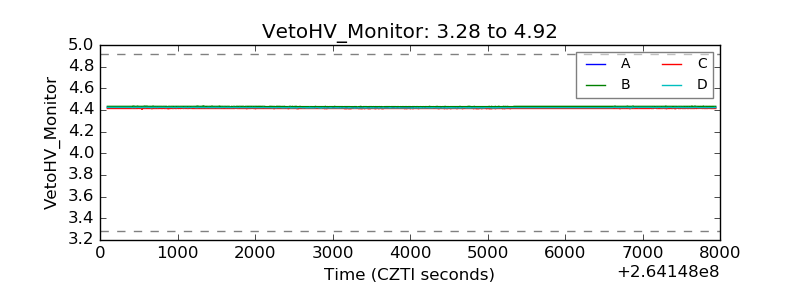 |
| Veto LLD | 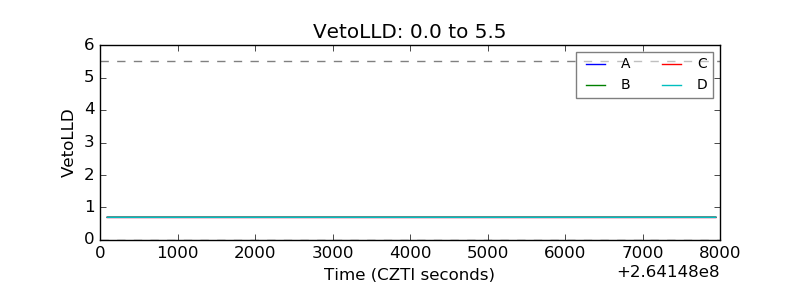 |
| Alpha Counter | 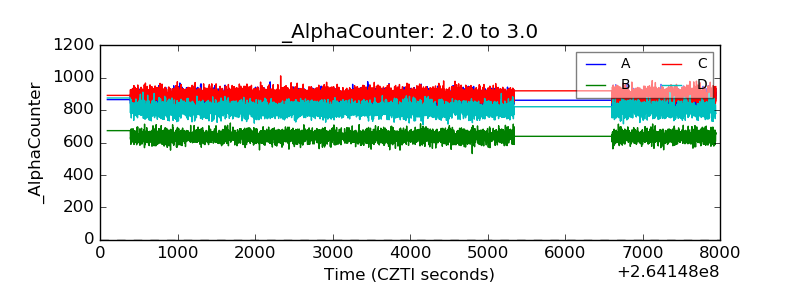 |
| _CPM_Rate | 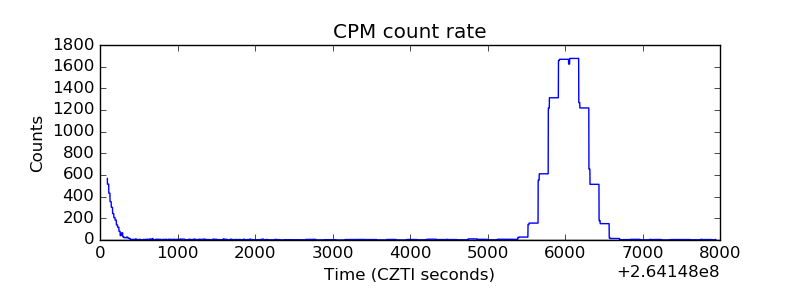 |
| CZT Counter | 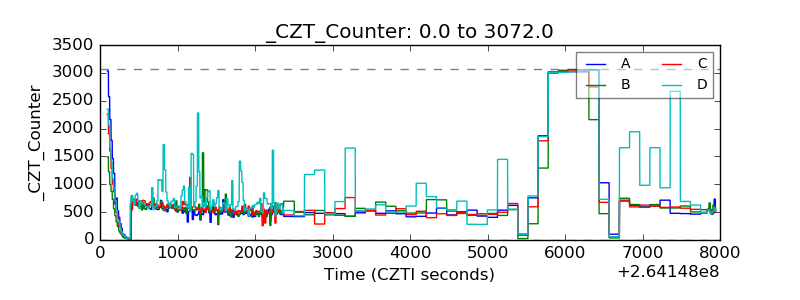 |
| +2.5 Volts monitor |  |
| +5 Volts monitor | 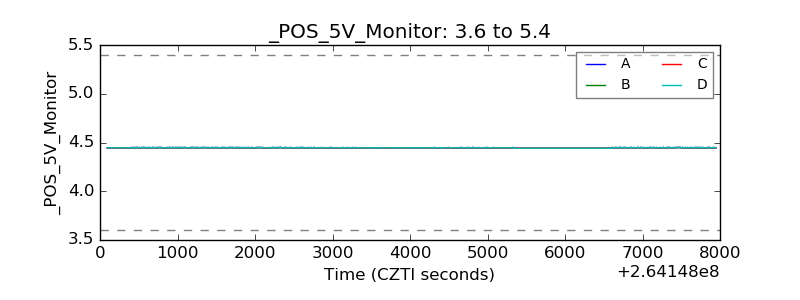 |
| _ROLL_ROT | 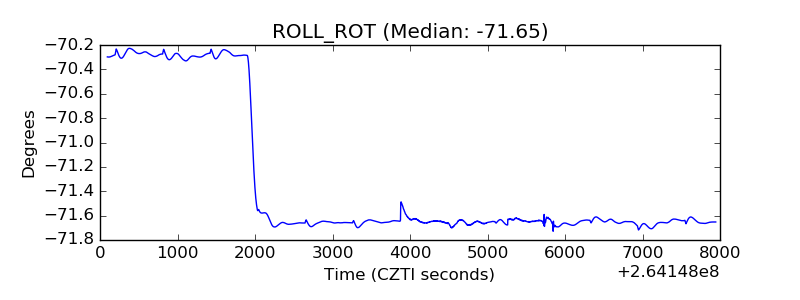 |
| _Roll_DEC | 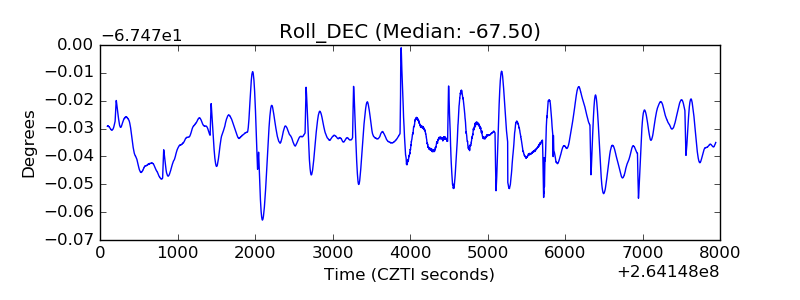 |
| _Roll_RA | 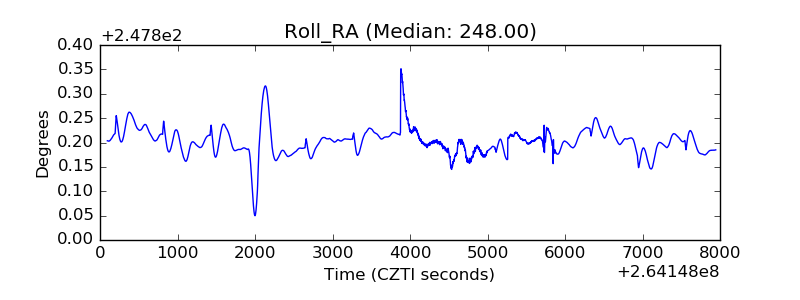 |
| Veto Counter | 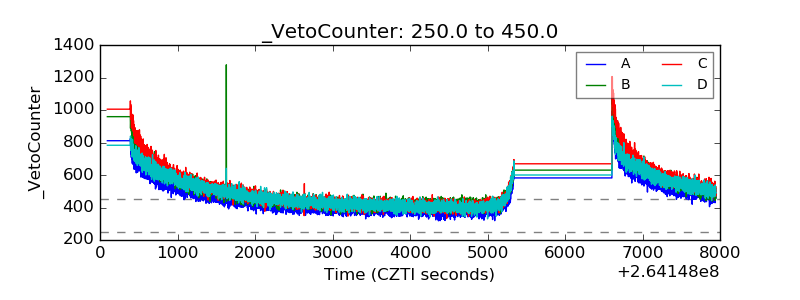 |