| Param | Original file | Final file |
|---|---|---|
| Filename | modeM0/AS1G08_084T01_9000002100_14228cztM0_level2.evt | modeM0/AS1G08_084T01_9000002100_14228cztM0_level2_quad_clean.evt |
| Size (bytes) | 583,067,520 | 87,384,960 |
| Size | 556.1 MB | 83.3 MB |
| Events in quadrant A | 3,183,061 | 583,610 |
| Events in quadrant B | 3,326,665 | 590,894 |
| Events in quadrant C | 3,304,719 | 571,587 |
| Events in quadrant D | 7,431,529 | 474,614 |
| Mode SS | |||
|---|---|---|---|
| Quadrant | BADHDUFLAG | Total packets | Discarded packets |
| A | 0 | 124 | 0 |
| B | 0 | 124 | 0 |
| C | 0 | 124 | 0 |
| D | 0 | 124 | 0 |
| Mode M0 | |||
|---|---|---|---|
| Quadrant | BADHDUFLAG | Total packets | Discarded packets |
| A | 0 | 13122 | 2 |
| B | 0 | 13479 | 1 |
| C | 0 | 13493 | 1 |
| D | 0 | 26200 | 1 |
| Mode M9 | |||
|---|---|---|---|
| Quadrant | BADHDUFLAG | Total packets | Discarded packets |
| A | 0 | 13 | 0 |
| B | 0 | 13 | 0 |
| C | 0 | 13 | 0 |
| D | 0 | 13 | 0 |
| Quadrant | Total seconds | Saturated seconds | Saturation percentage |
|---|---|---|---|
| A | 6084 | 78 | 1.282051% |
| B | 6084 | 96 | 1.577909% |
| C | 6084 | 64 | 1.051940% |
| D | 6084 | 1513 | 24.868508% |
Noise dominated data is calculated using 1-second bins in cleaned event files. If a bin has >2000 counts, and if more than 50% of those come from <1% of pixels, then it is considered to be noise-dominated and hence unusable.
| Quadrant | # 1 sec bins | Bins with >0 counts | Bins with >2000 counts | High rate bins dominated by noise | Noise dominated (total time) | Noise dominated (detector-on time) | Marked lightcurve |
|---|---|---|---|---|---|---|---|
| A | 7380 | 6086 | 8 | 8 | 0.11% | 0.13% | 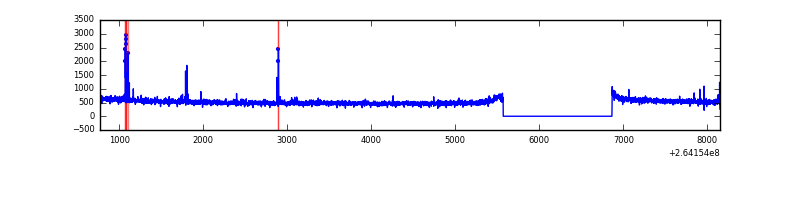 |
| B | 7380 | 6085 | 9 | 9 | 0.12% | 0.15% | 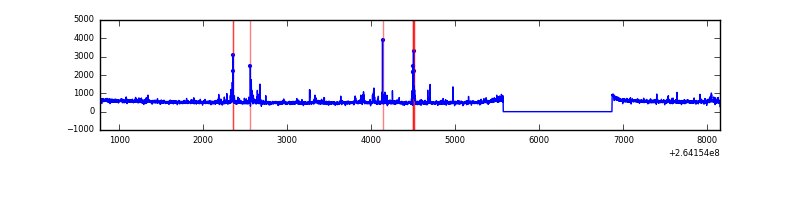 |
| C | 7380 | 6086 | 1 | 1 | 0.01% | 0.02% | 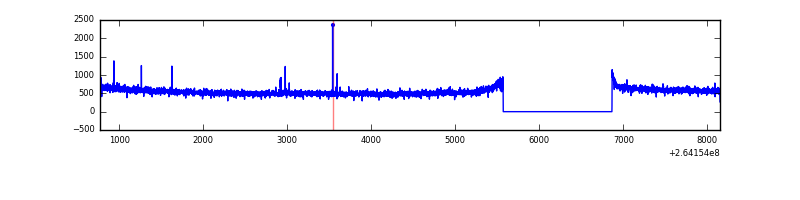 |
| D | 7380 | 6086 | 1293 | 1293 | 17.52% | 21.25% | 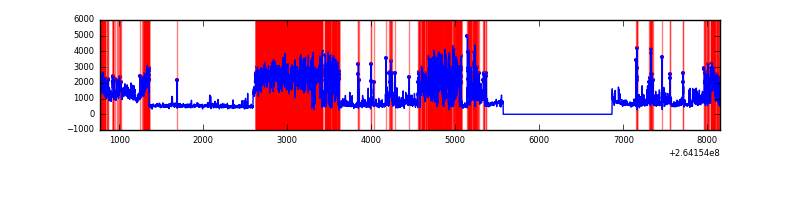 |
Top three noisy pixels from each quadrant. If the there are fewer than three noisy pixels in the level2.evt file, extra rows are filled as -1
| Pixel properties | Quadrant properties | ||||||
|---|---|---|---|---|---|---|---|
| Quadrant | DetID | PixID | Counts | Sigma | Mean | Median | Sigma |
| A | 12 | 189 | 36514 | 225.18 | 802 | 787 | 158.7 |
| A | 9 | 143 | 26344 | 161.08 | 802 | 787 | 158.7 |
| A | 15 | 222 | 15311 | 91.54 | 802 | 787 | 158.7 |
| B | 0 | 229 | 76489 | 516.09 | 795 | 776 | 146.7 |
| B | 4 | 97 | 49519 | 332.25 | 795 | 776 | 146.7 |
| B | 0 | 189 | 49063 | 329.14 | 795 | 776 | 146.7 |
| C | 3 | 233 | 269299 | 1534.04 | 777 | 783 | 175.0 |
| C | 14 | 234 | 7551 | 38.67 | 777 | 783 | 175.0 |
| C | 13 | 61 | 5591 | 27.47 | 777 | 783 | 175.0 |
| D | 12 | 110 | 2075387 | 12481.58 | 715 | 697 | 166.2 |
| D | 5 | 222 | 1575543 | 9474.46 | 715 | 697 | 166.2 |
| D | 10 | 172 | 666908 | 4008.0 | 715 | 697 | 166.2 |
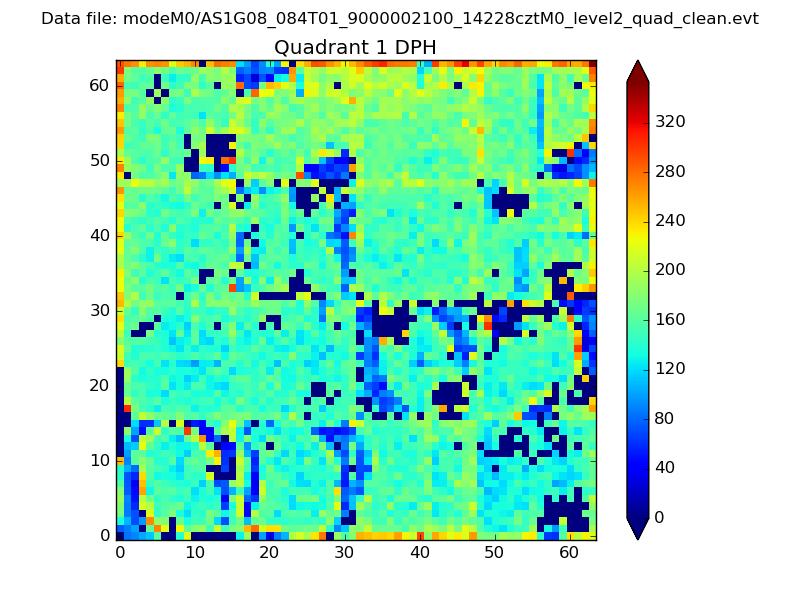
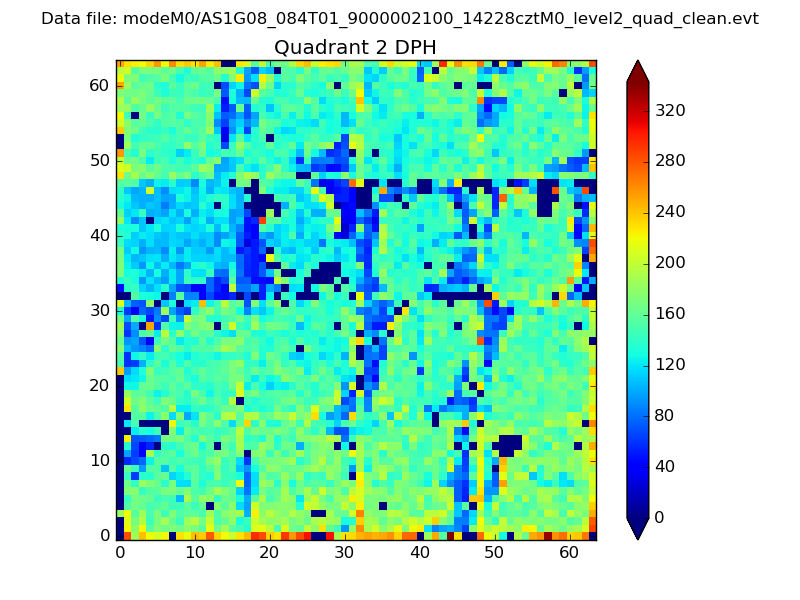
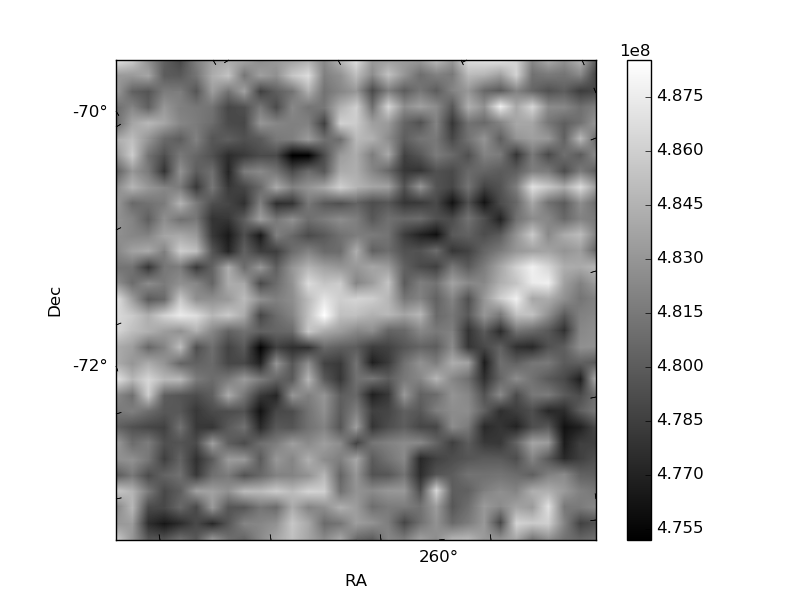
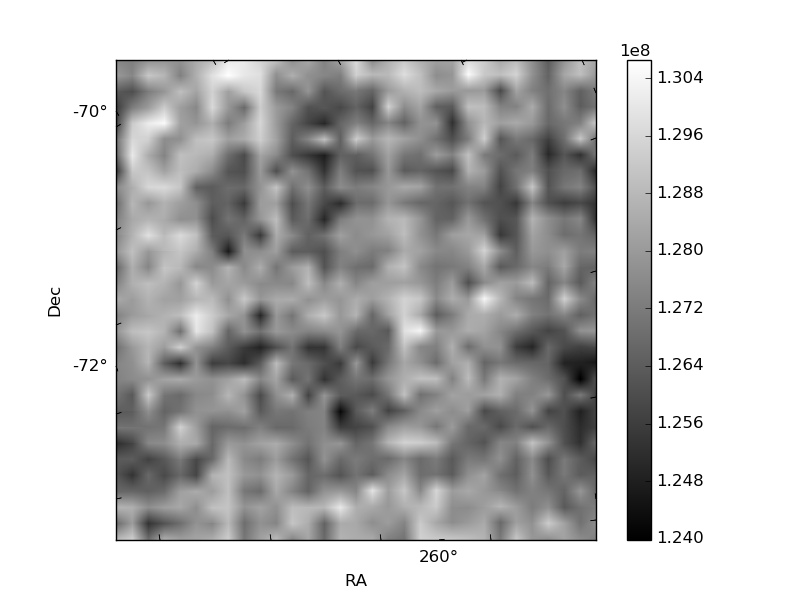
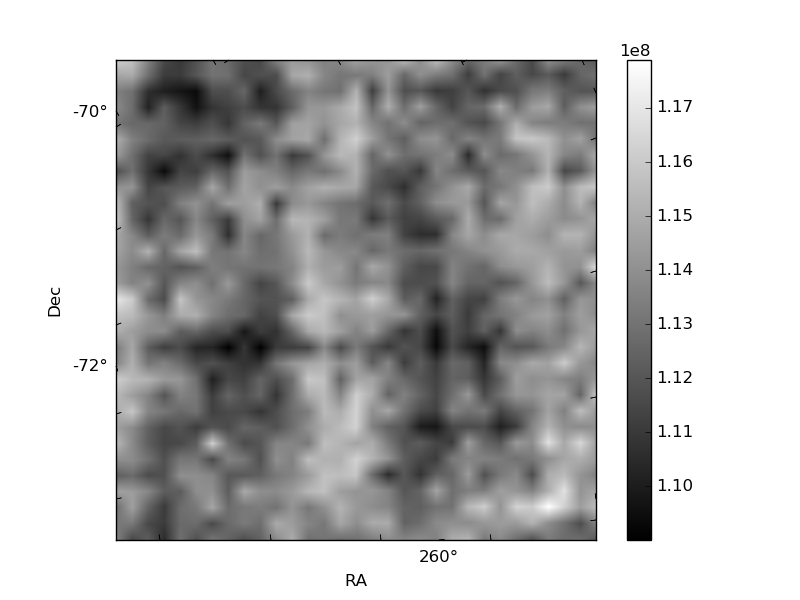
Histogram calculated using DETX and DETY for each event in the final _common_clean file
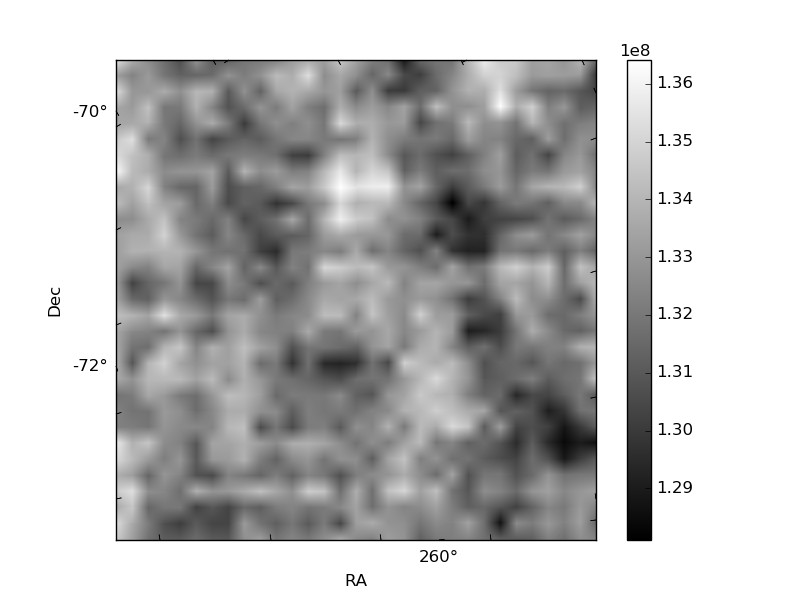
| Quadrant A |  |
 |
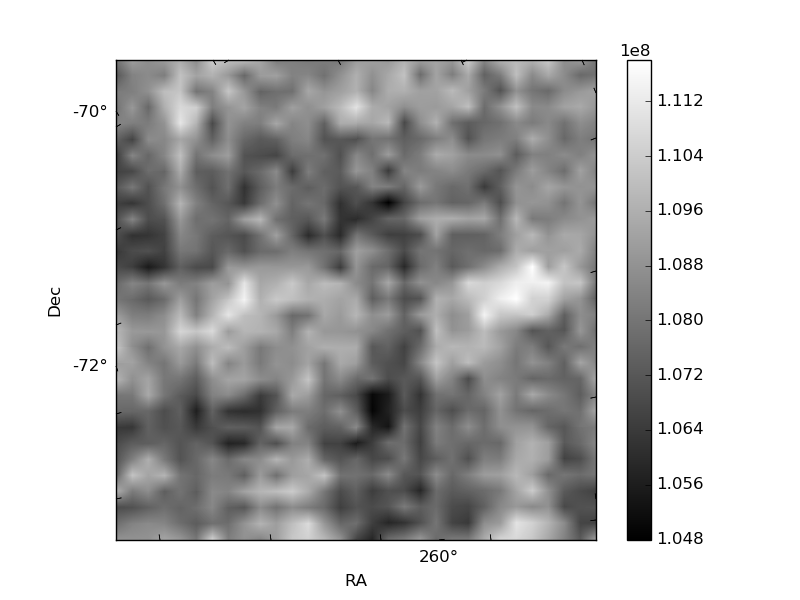
Quadrant B |
|---|---|---|---|
| Quadrant D | 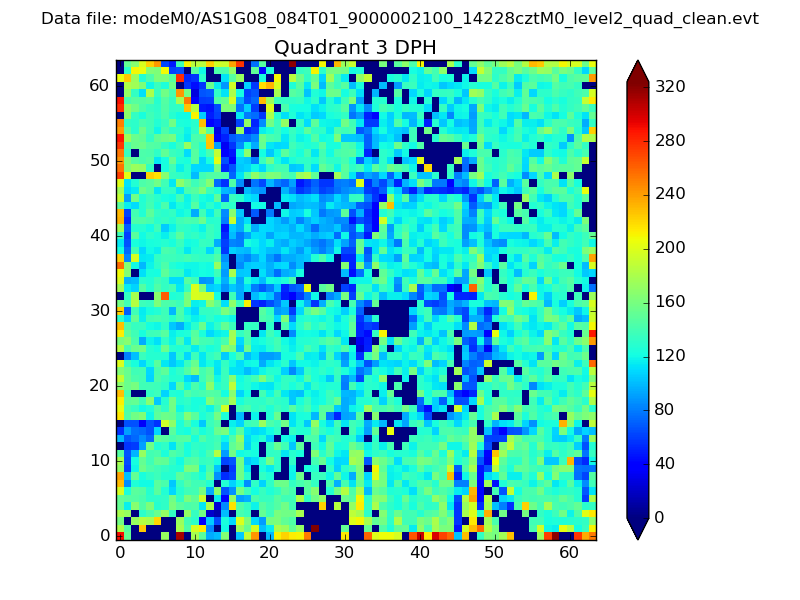 |
 |
Quadrant C |
| Plot type | Count rate plots | Images |
|---|---|---|
| Comparison with Poisson distribution Blue bars denote a histogram of data divided into 1 sec bins. Red curve is a Poisson curve with rate = median count rate of data. |
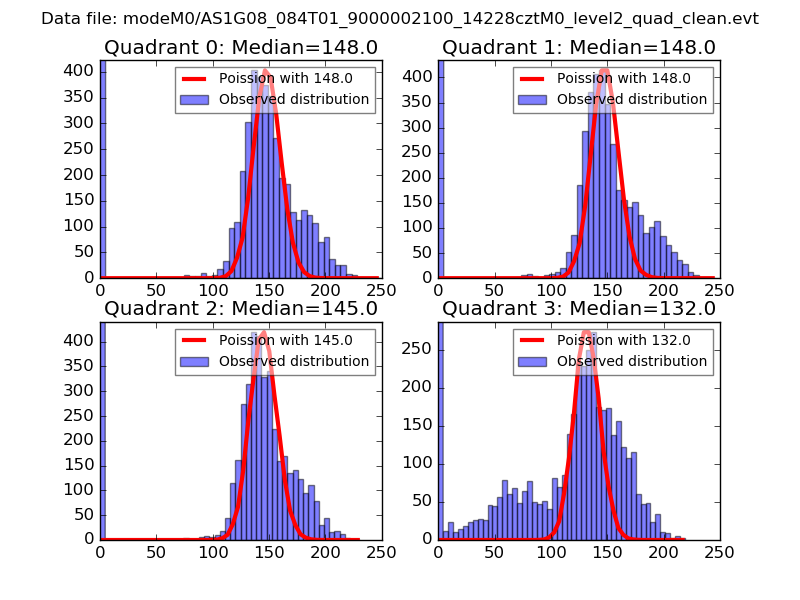 |
 |
| Quadrant-wise count rates Data is divided into 100 sec bins |
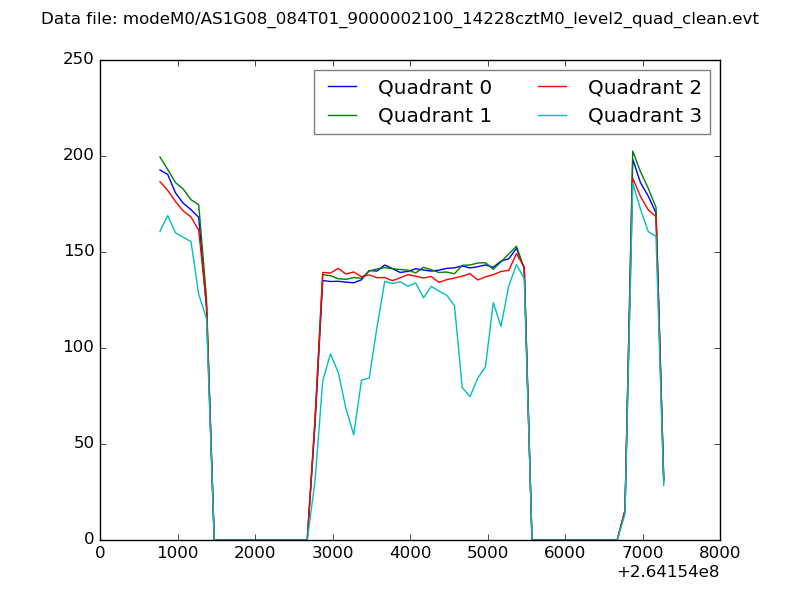 |
|
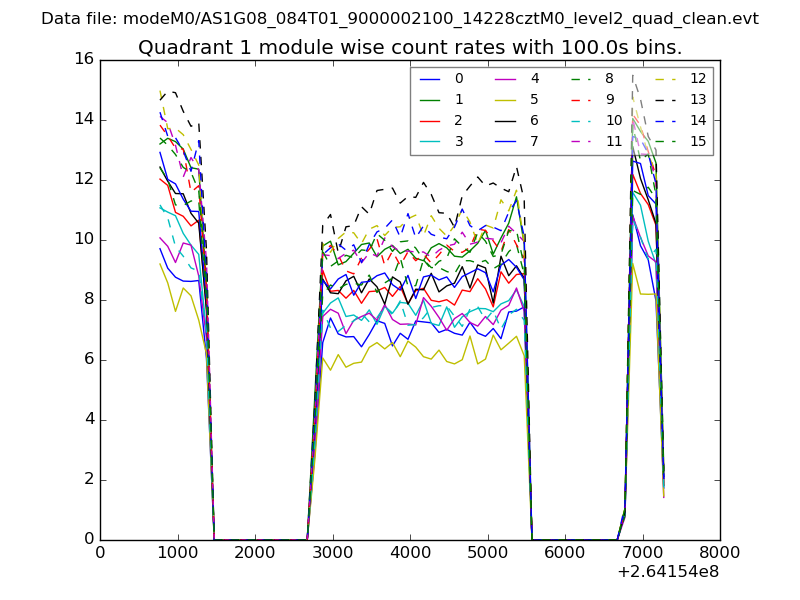
| Module-wise count rates for Quadrant A Data is divided into 100 sec bins |
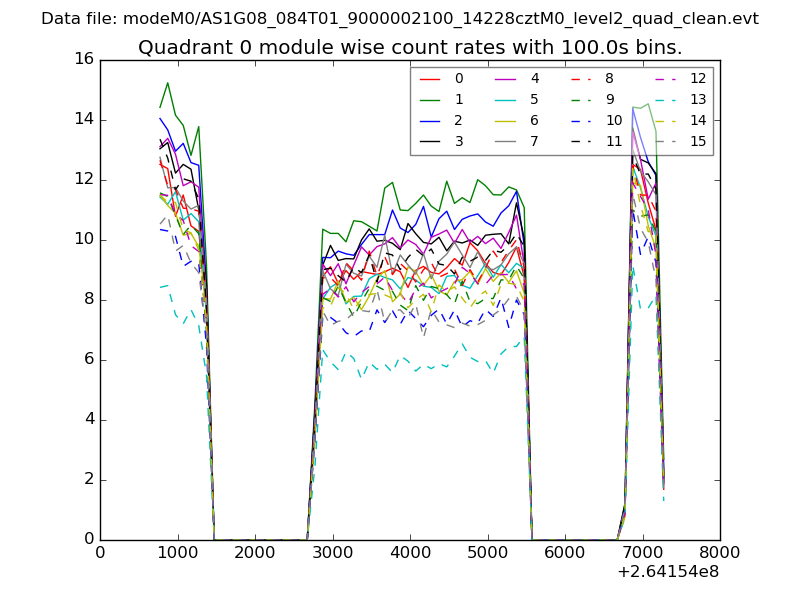 |
 |
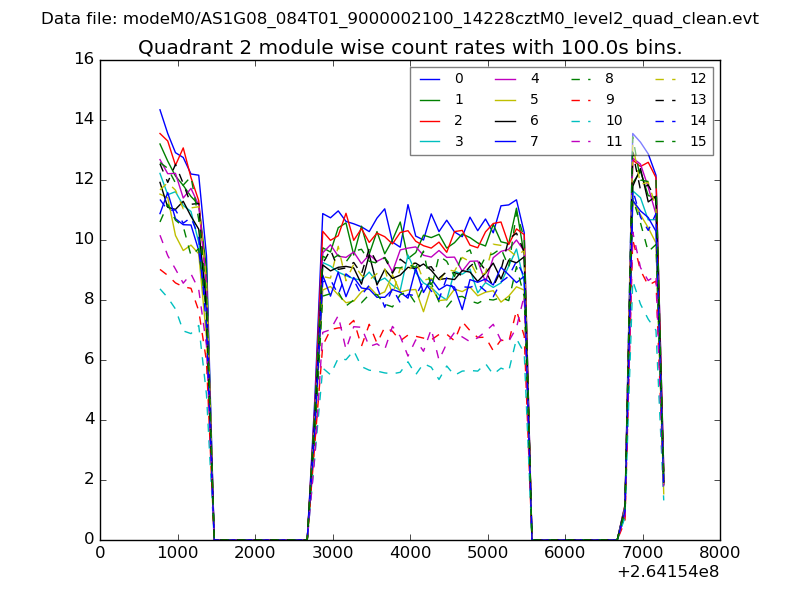
| Module-wise count rates for Quadrant B Data is divided into 100 sec bins |
 |
 |
| Module-wise count rates for Quadrant C Data is divided into 100 sec bins |
 |
 |
| Module-wise count rates for Quadrant D Data is divided into 100 sec bins |
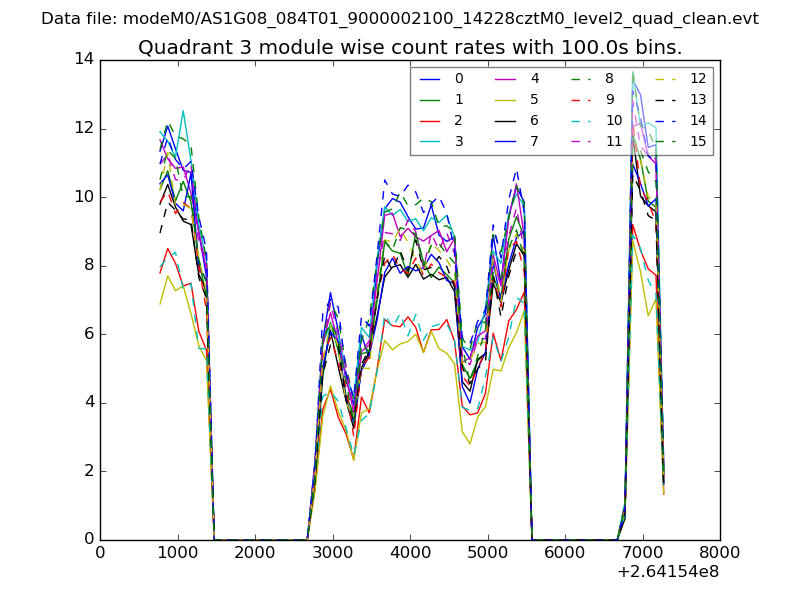 |
 |
| Parameter | Plot |
|---|---|
| CZT HV Monitor | 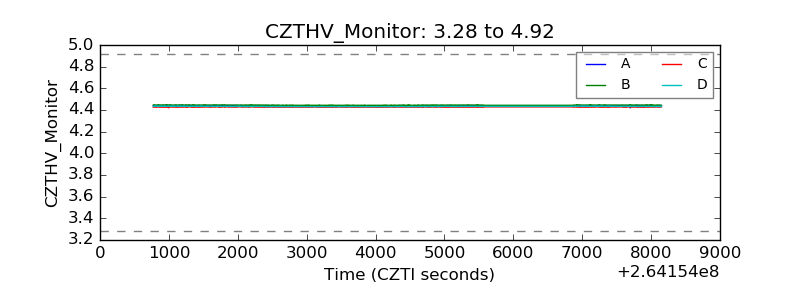 |
| D_VDD | 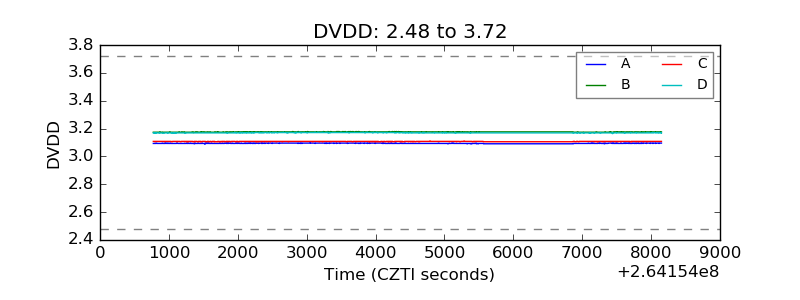 |
| Temperature 1 | 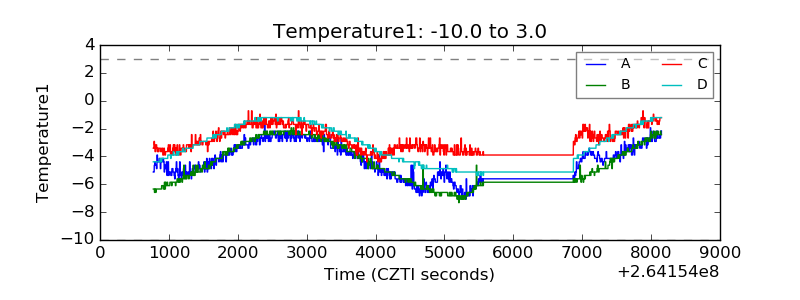 |
| Veto HV Monitor | 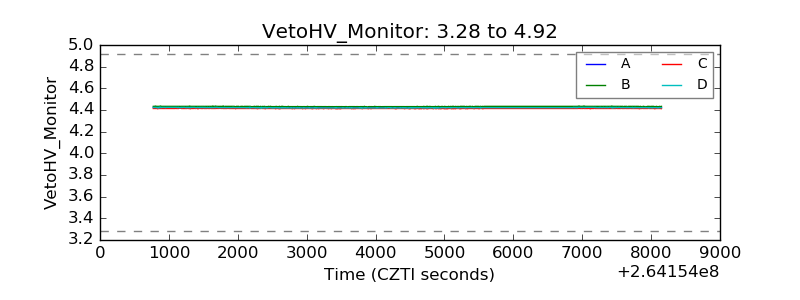 |
| Veto LLD | 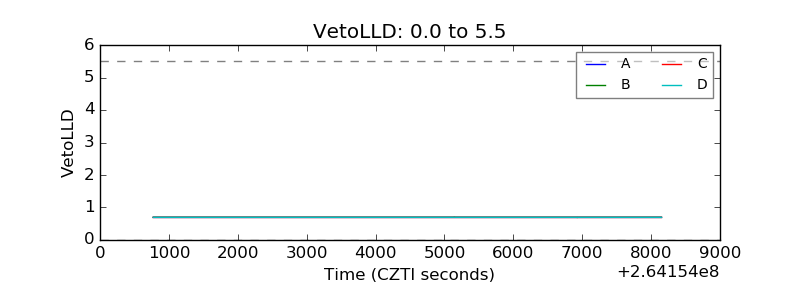 |
| Alpha Counter | 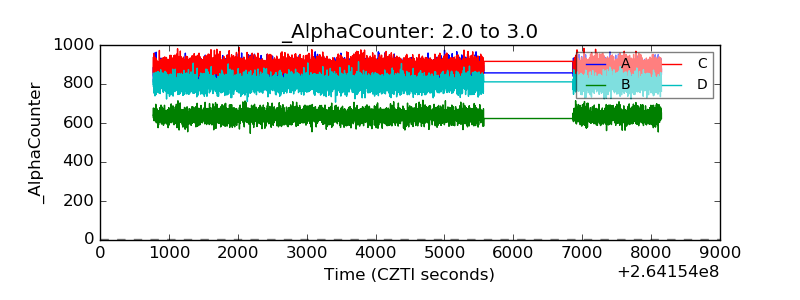 |
| _CPM_Rate | 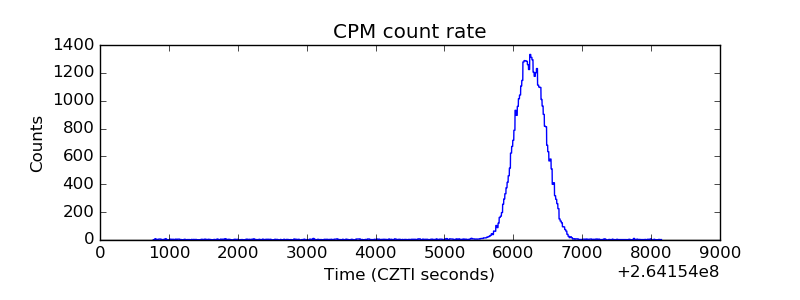 |
| CZT Counter | 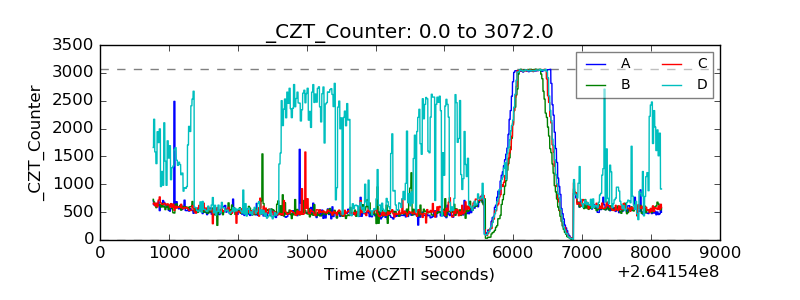 |
| +2.5 Volts monitor |  |
| +5 Volts monitor |  |
| _ROLL_ROT | 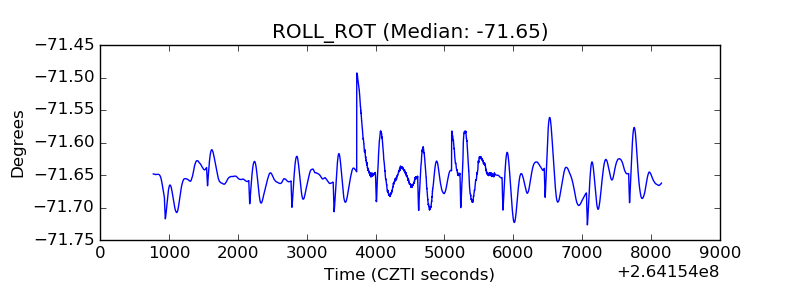 |
| _Roll_DEC | 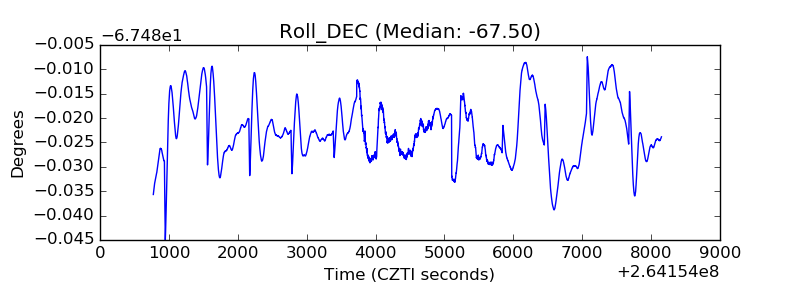 |
| _Roll_RA | 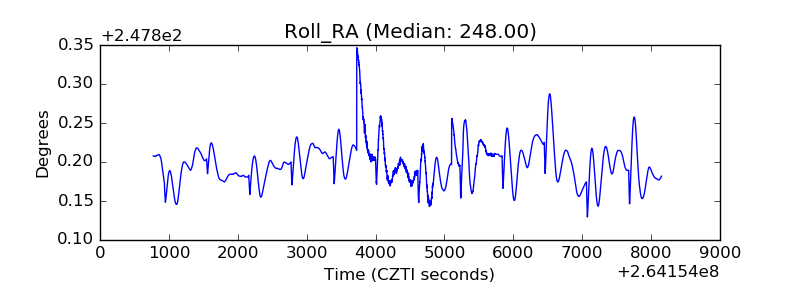 |
| Veto Counter | 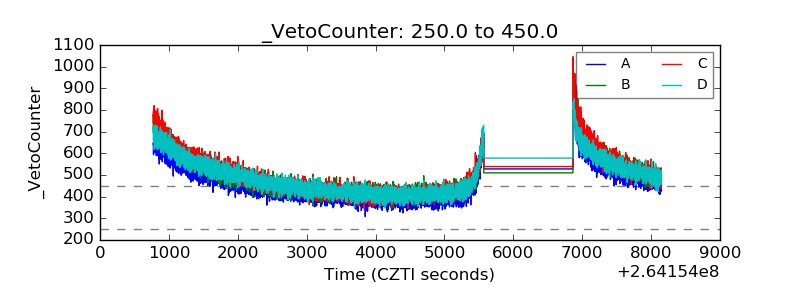 |