| Param | Original file | Final file |
|---|---|---|
| Filename | modeM0/AS1G08_084T01_9000002100_14230cztM0_level2.evt | modeM0/AS1G08_084T01_9000002100_14230cztM0_level2_quad_clean.evt |
| Size (bytes) | 500,492,160 | 91,791,360 |
| Size | 477.3 MB | 87.5 MB |
| Events in quadrant A | 3,149,820 | 594,748 |
| Events in quadrant B | 3,658,887 | 593,603 |
| Events in quadrant C | 3,483,104 | 578,891 |
| Events in quadrant D | 4,426,048 | 560,655 |
| Mode SS | |||
|---|---|---|---|
| Quadrant | BADHDUFLAG | Total packets | Discarded packets |
| A | 0 | 135 | 1 |
| B | 0 | 135 | 1 |
| C | 0 | 134 | 0 |
| D | 0 | 135 | 1 |
| Mode M0 | |||
|---|---|---|---|
| Quadrant | BADHDUFLAG | Total packets | Discarded packets |
| A | 0 | 13485 | 178 |
| B | 0 | 15085 | 163 |
| C | 0 | 14331 | 190 |
| D | 0 | 17742 | 258 |
| Mode M9 | |||
|---|---|---|---|
| Quadrant | BADHDUFLAG | Total packets | Discarded packets |
| A | 0 | 10 | 0 |
| B | 0 | 10 | 0 |
| C | 0 | 10 | 0 |
| D | 0 | 10 | 0 |
| Quadrant | Total seconds | Saturated seconds | Saturation percentage |
|---|---|---|---|
| A | 6467 | 90 | 1.391681% |
| B | 6474 | 242 | 3.738029% |
| C | 6471 | 83 | 1.282646% |
| D | 6465 | 185 | 2.861562% |
Noise dominated data is calculated using 1-second bins in cleaned event files. If a bin has >2000 counts, and if more than 50% of those come from <1% of pixels, then it is considered to be noise-dominated and hence unusable.
| Quadrant | # 1 sec bins | Bins with >0 counts | Bins with >2000 counts | High rate bins dominated by noise | Noise dominated (total time) | Noise dominated (detector-on time) | Marked lightcurve |
|---|---|---|---|---|---|---|---|
| A | 7668 | 6479 | 0 | 0 | 0.00% | 0.00% | 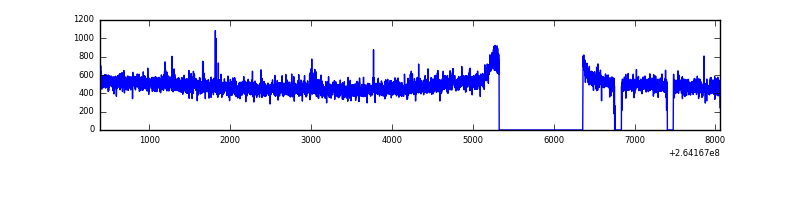 |
| B | 7668 | 6480 | 87 | 87 | 1.13% | 1.34% | 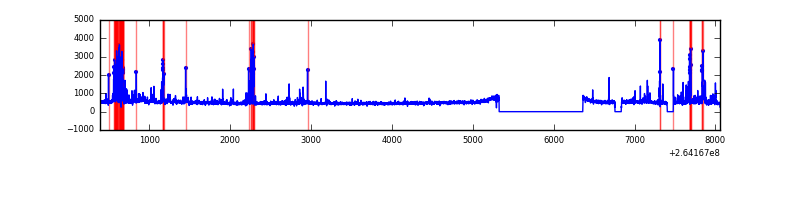 |
| C | 7668 | 6479 | 1 | 1 | 0.01% | 0.02% |  |
| D | 7668 | 6476 | 76 | 76 | 0.99% | 1.17% | 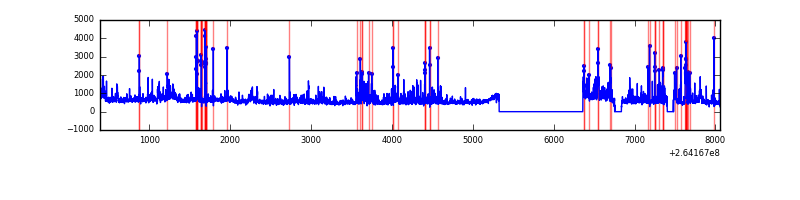 |
Top three noisy pixels from each quadrant. If the there are fewer than three noisy pixels in the level2.evt file, extra rows are filled as -1
| Pixel properties | Quadrant properties | ||||||
|---|---|---|---|---|---|---|---|
| Quadrant | DetID | PixID | Counts | Sigma | Mean | Median | Sigma |
| A | 12 | 189 | 52260 | 323.33 | 794 | 777 | 159.2 |
| A | 8 | 15 | 34394 | 211.13 | 794 | 777 | 159.2 |
| A | 0 | 226 | 7236 | 40.56 | 794 | 777 | 159.2 |
| B | 0 | 229 | 369164 | 2502.34 | 782 | 763 | 147.2 |
| B | 0 | 182 | 98471 | 663.67 | 782 | 763 | 147.2 |
| B | 0 | 189 | 70914 | 476.5 | 782 | 763 | 147.2 |
| C | 3 | 233 | 488991 | 2777.82 | 765 | 768 | 175.8 |
| C | 14 | 234 | 9937 | 52.17 | 765 | 768 | 175.8 |
| C | 13 | 61 | 5693 | 28.02 | 765 | 768 | 175.8 |
| D | 5 | 222 | 437854 | 2438.99 | 760 | 744 | 179.2 |
| D | 8 | 195 | 326665 | 1818.58 | 760 | 744 | 179.2 |
| D | 13 | 122 | 314295 | 1749.55 | 760 | 744 | 179.2 |
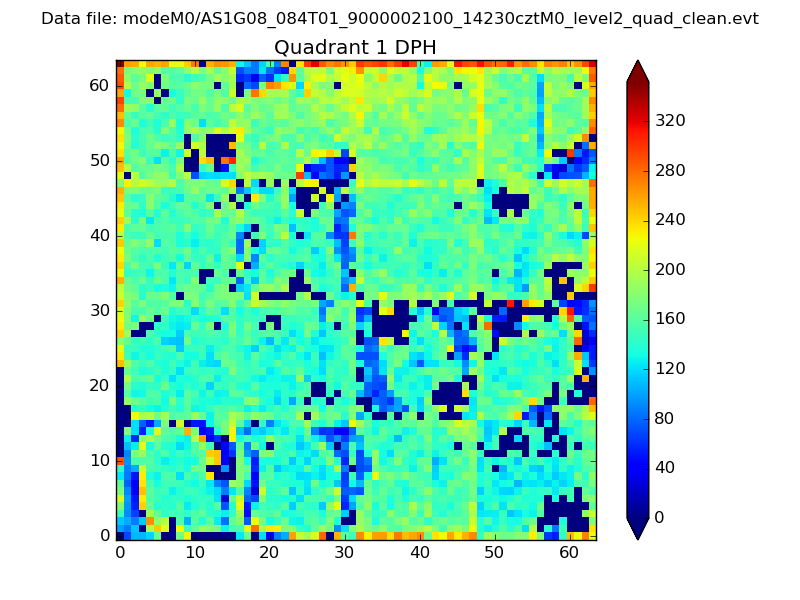
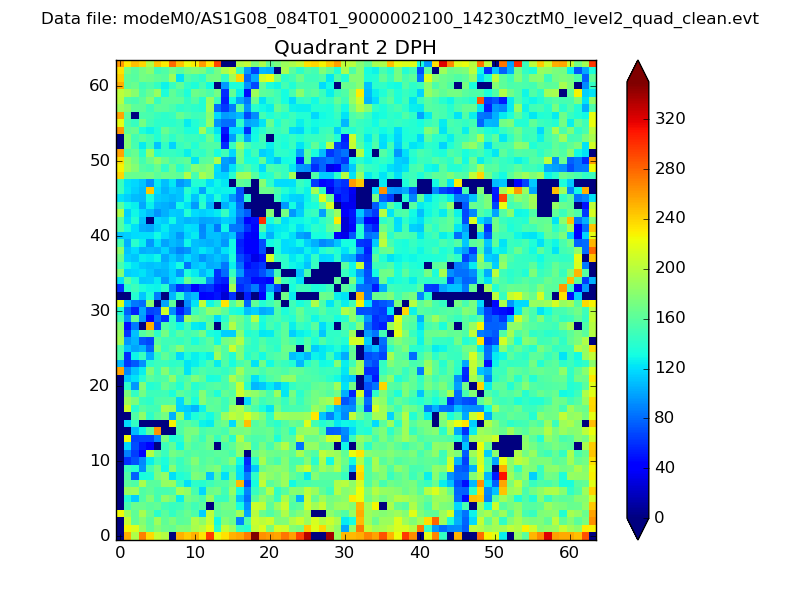
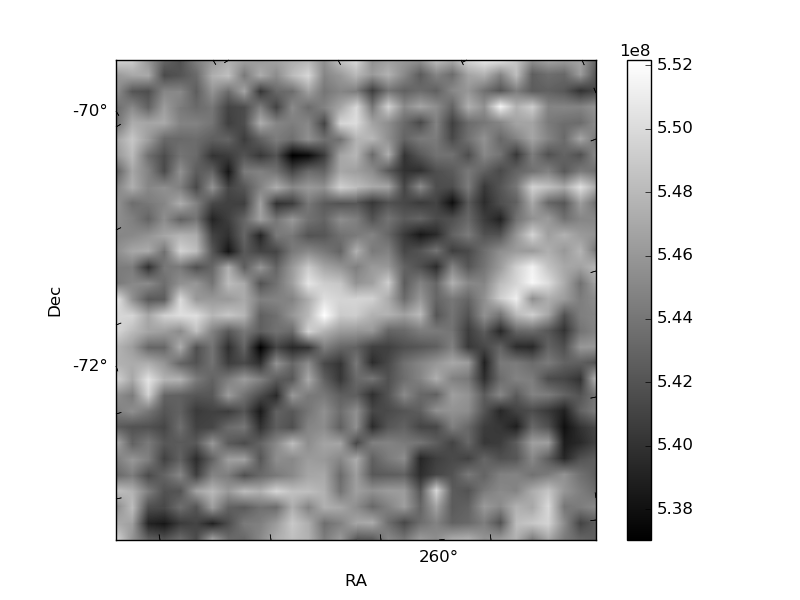
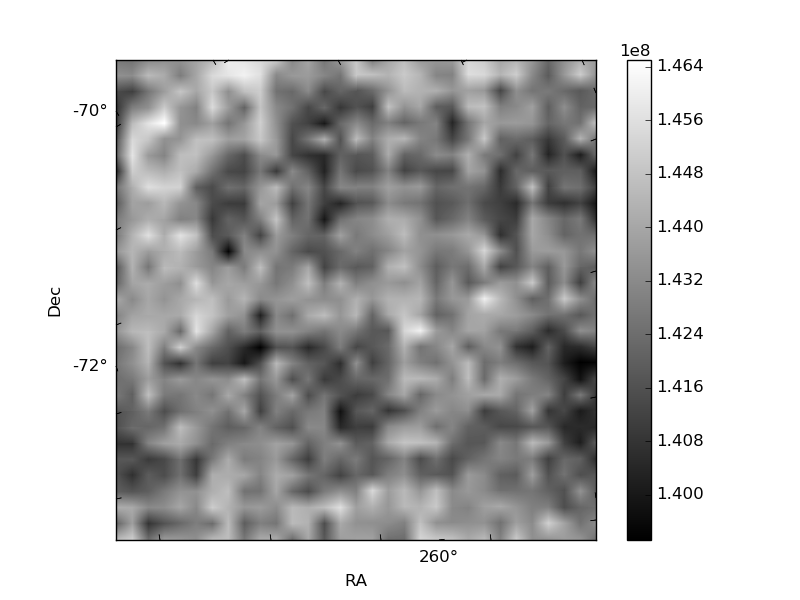
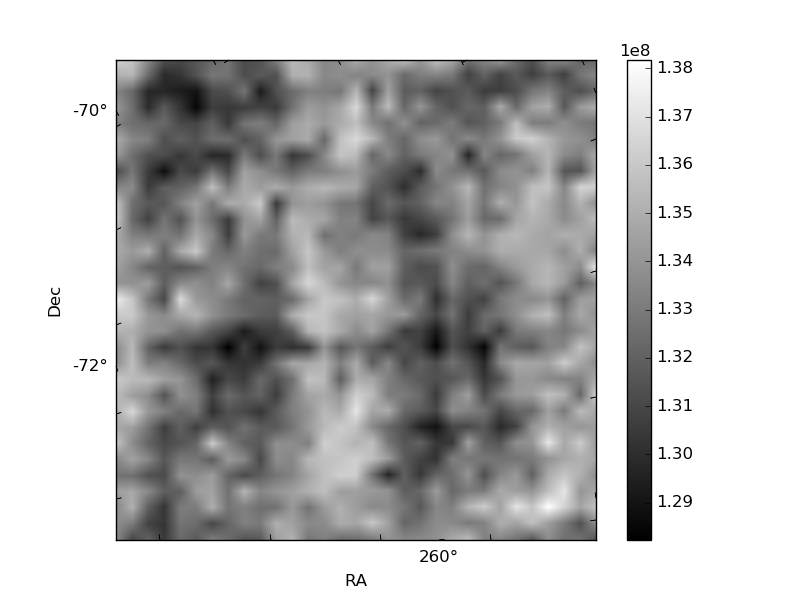
Histogram calculated using DETX and DETY for each event in the final _common_clean file
| Quadrant A | 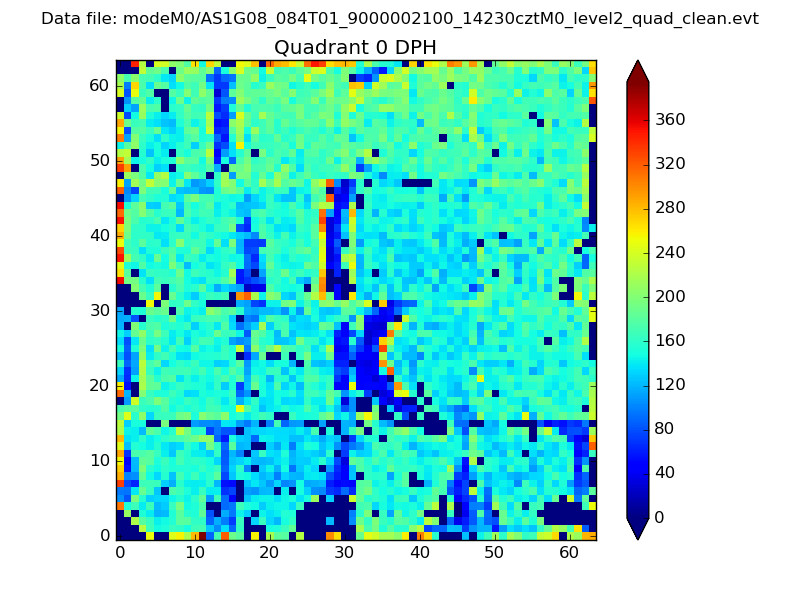 |
 |
Quadrant B |
|---|---|---|---|
| Quadrant D | 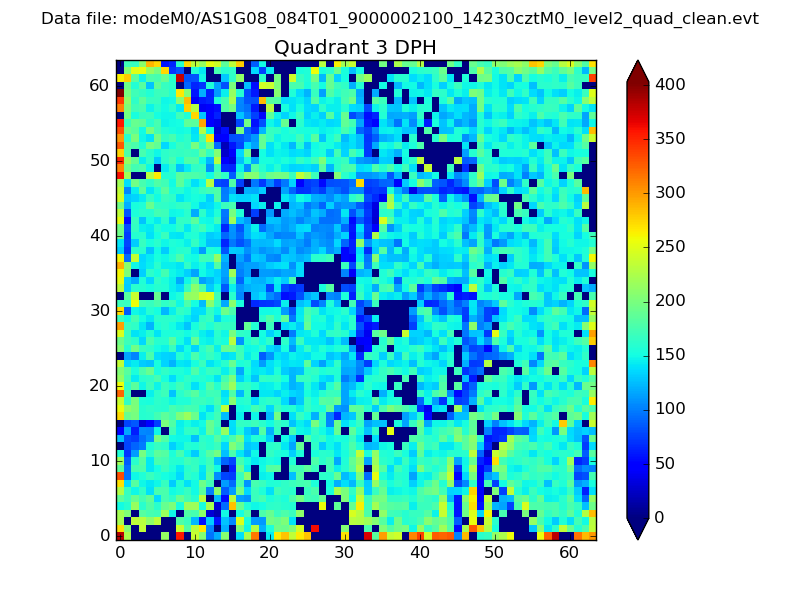 |
 |
Quadrant C |
| Plot type | Count rate plots | Images |
|---|---|---|
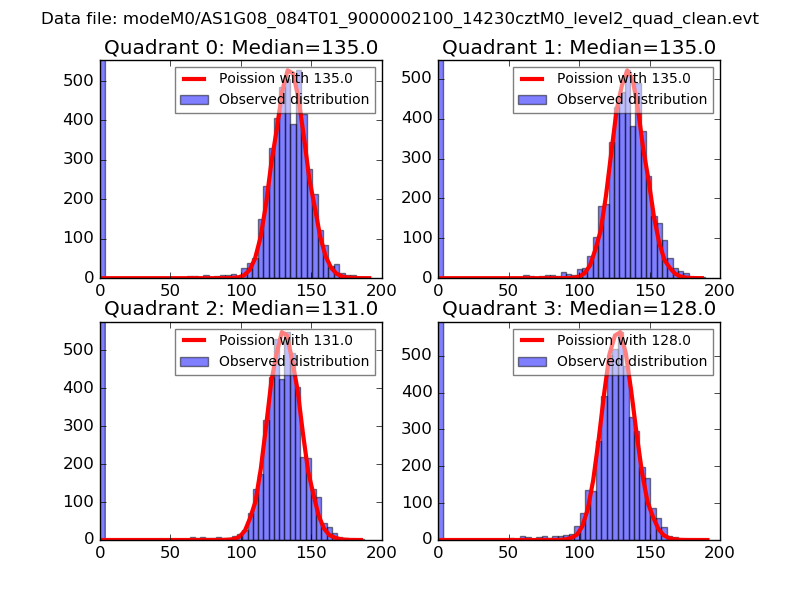
| Comparison with Poisson distribution Blue bars denote a histogram of data divided into 1 sec bins. Red curve is a Poisson curve with rate = median count rate of data. |
 |
 |
| Quadrant-wise count rates Data is divided into 100 sec bins |
 |
|
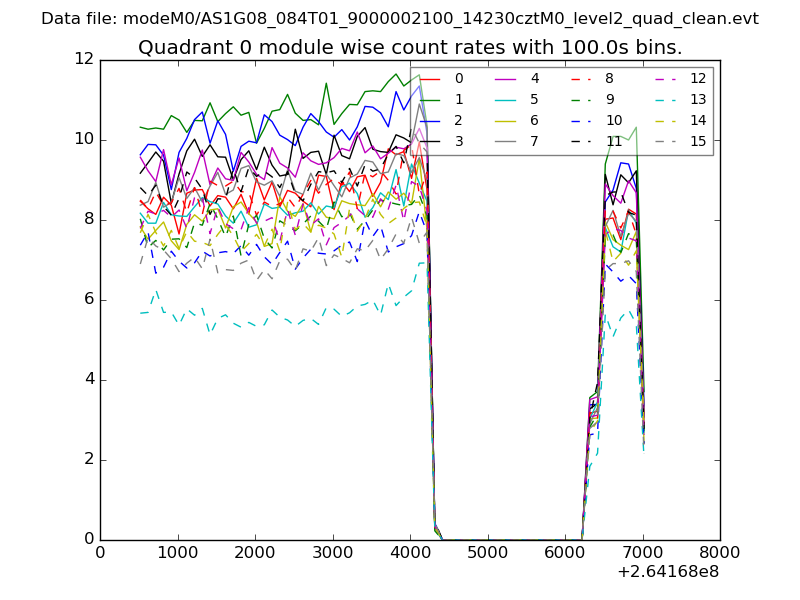
| Module-wise count rates for Quadrant A Data is divided into 100 sec bins |
 |
 |
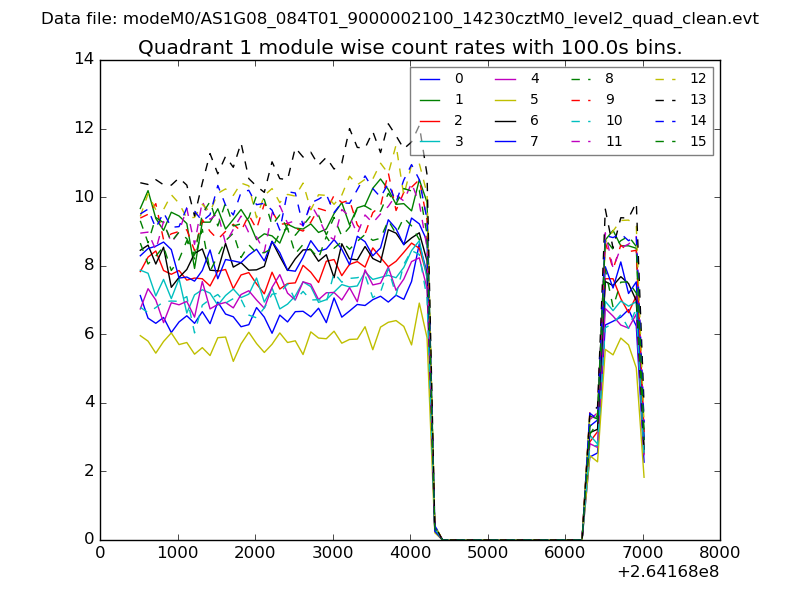
| Module-wise count rates for Quadrant B Data is divided into 100 sec bins |
 |
 |
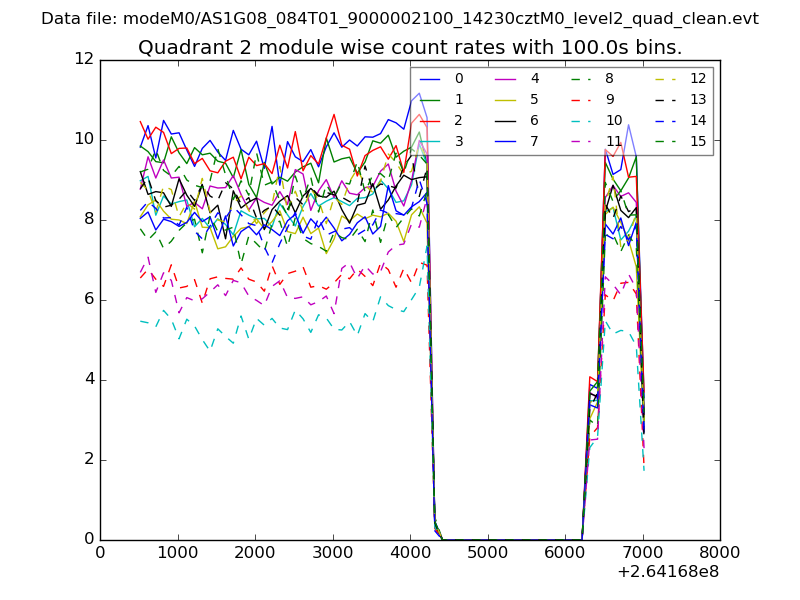
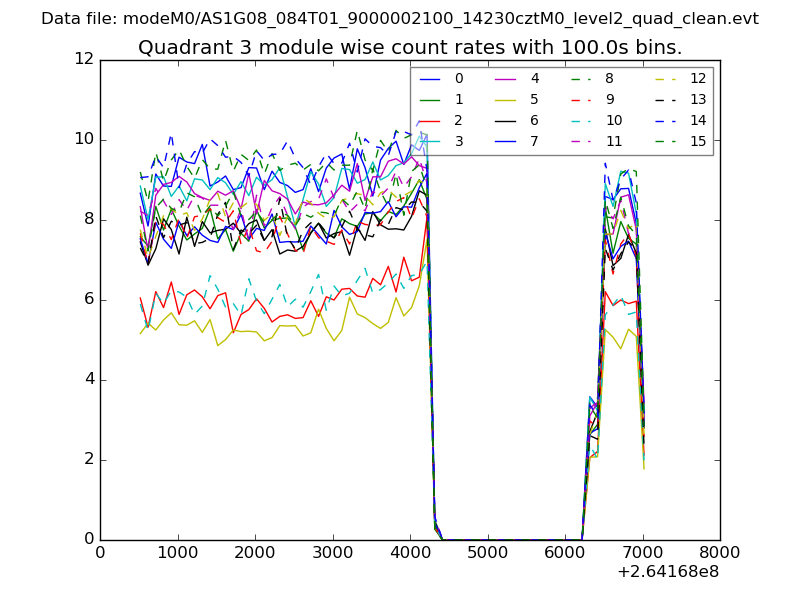
| Module-wise count rates for Quadrant C Data is divided into 100 sec bins |
 |
 |
| Module-wise count rates for Quadrant D Data is divided into 100 sec bins |
 |
 |
| Parameter | Plot |
|---|---|
| CZT HV Monitor | 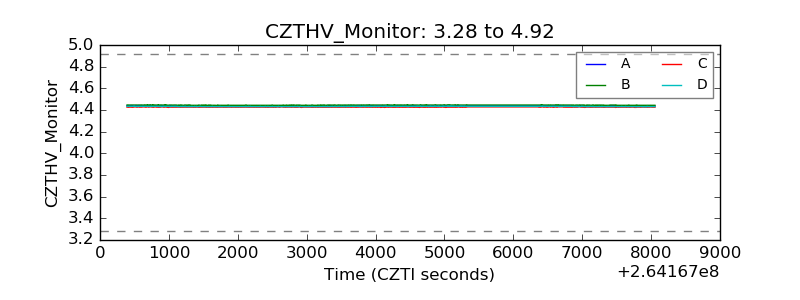 |
| D_VDD | 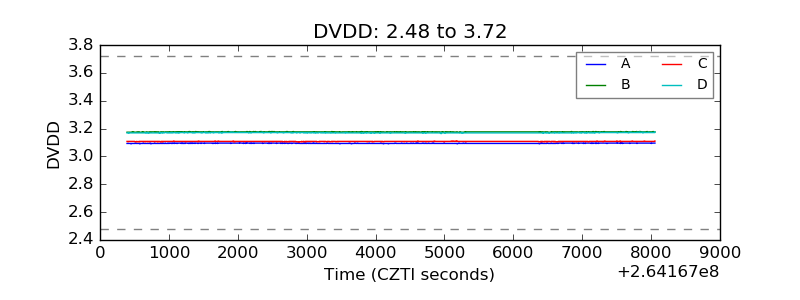 |
| Temperature 1 | 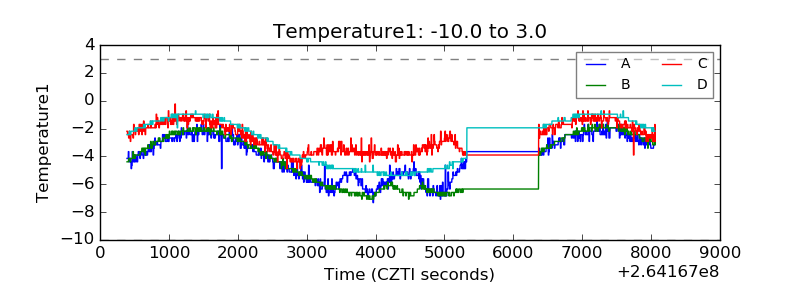 |
| Veto HV Monitor | 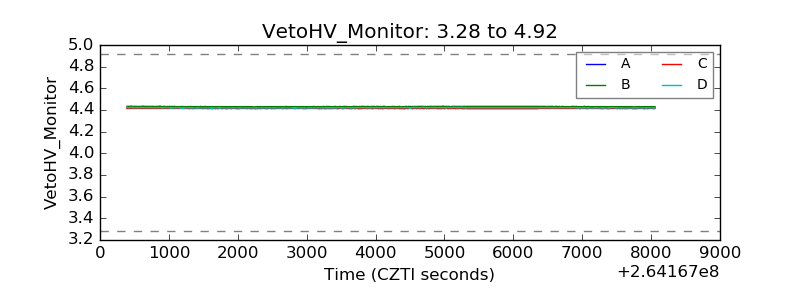 |
| Veto LLD |  |
| Alpha Counter | 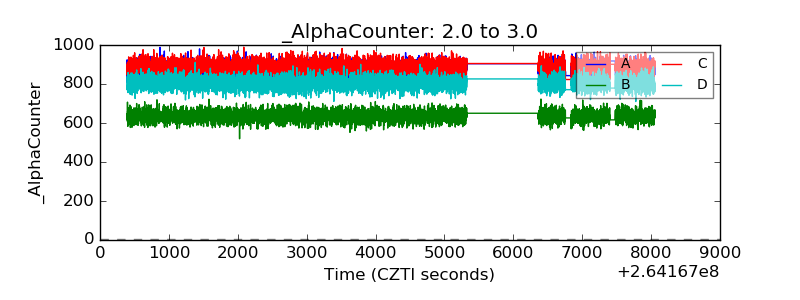 |
| _CPM_Rate | 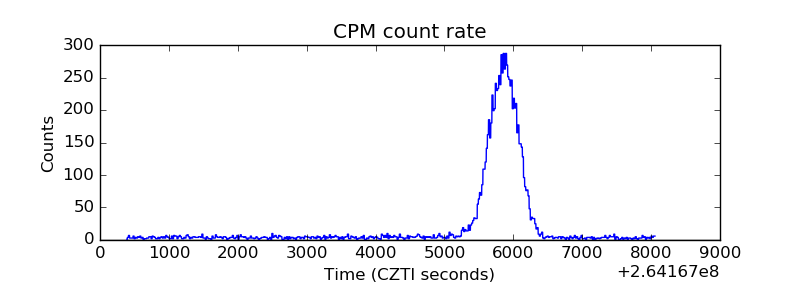 |
| CZT Counter | 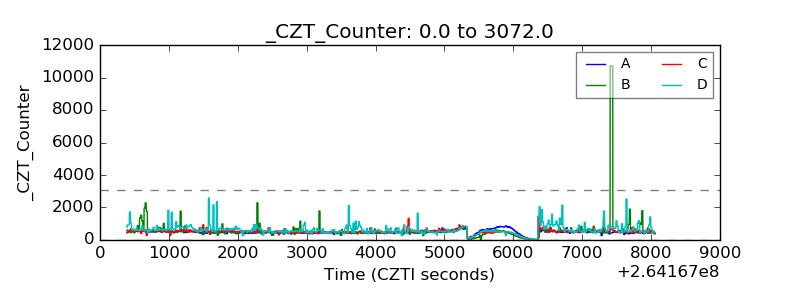 |
| +2.5 Volts monitor |  |
| +5 Volts monitor |  |
| _ROLL_ROT | 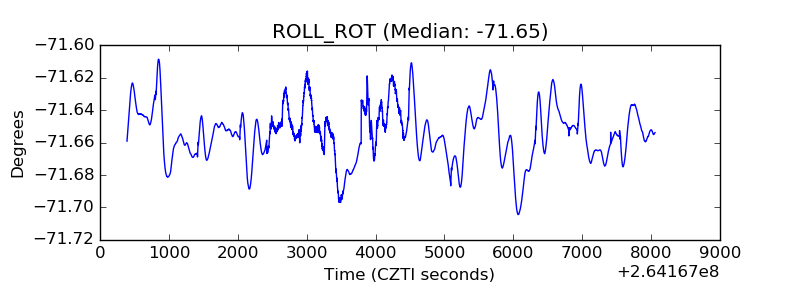 |
| _Roll_DEC |  |
| _Roll_RA | 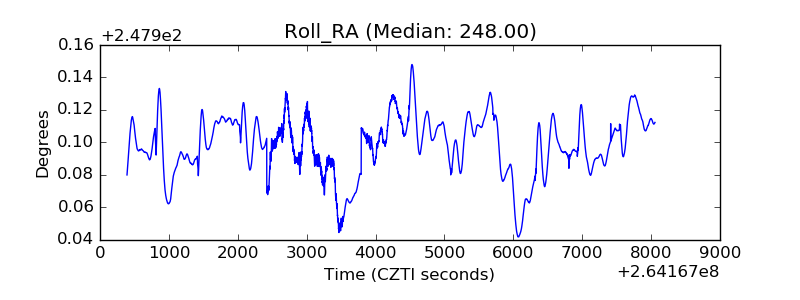 |
| Veto Counter | 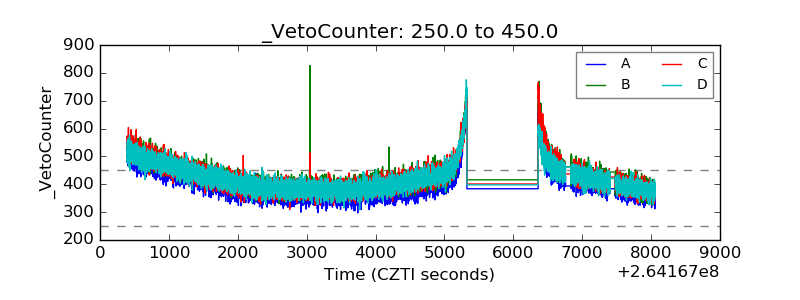 |