| Param | Original file | Final file |
|---|---|---|
| Filename | modeM0/AS1G08_084T01_9000002100_14231cztM0_level2.evt | modeM0/AS1G08_084T01_9000002100_14231cztM0_level2_quad_clean.evt |
| Size (bytes) | 524,229,120 | 108,524,160 |
| Size | 499.9 MB | 103.5 MB |
| Events in quadrant A | 3,226,685 | 719,505 |
| Events in quadrant B | 3,762,519 | 720,020 |
| Events in quadrant C | 3,601,110 | 699,555 |
| Events in quadrant D | 4,824,505 | 673,459 |
| Mode SS | |||
|---|---|---|---|
| Quadrant | BADHDUFLAG | Total packets | Discarded packets |
| A | 0 | 138 | 0 |
| B | 0 | 138 | 0 |
| C | 0 | 138 | 0 |
| D | 0 | 138 | 0 |
| Mode M0 | |||
|---|---|---|---|
| Quadrant | BADHDUFLAG | Total packets | Discarded packets |
| A | 0 | 14008 | 2 |
| B | 0 | 15568 | 1 |
| C | 0 | 14768 | 1 |
| D | 0 | 18844 | 1 |
| Mode M9 | |||
|---|---|---|---|
| Quadrant | BADHDUFLAG | Total packets | Discarded packets |
| A | 0 | 7 | 0 |
| B | 0 | 7 | 0 |
| C | 0 | 7 | 0 |
| D | 0 | 7 | 0 |
| Quadrant | Total seconds | Saturated seconds | Saturation percentage |
|---|---|---|---|
| A | 6805 | 111 | 1.631154% |
| B | 6805 | 223 | 3.277002% |
| C | 6805 | 97 | 1.425422% |
| D | 6805 | 275 | 4.041146% |
Noise dominated data is calculated using 1-second bins in cleaned event files. If a bin has >2000 counts, and if more than 50% of those come from <1% of pixels, then it is considered to be noise-dominated and hence unusable.
| Quadrant | # 1 sec bins | Bins with >0 counts | Bins with >2000 counts | High rate bins dominated by noise | Noise dominated (total time) | Noise dominated (detector-on time) | Marked lightcurve |
|---|---|---|---|---|---|---|---|
| A | 7476 | 6807 | 2 | 2 | 0.03% | 0.03% | 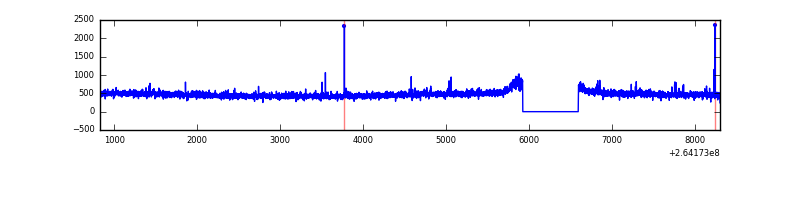 |
| B | 7476 | 6807 | 40 | 40 | 0.54% | 0.59% | 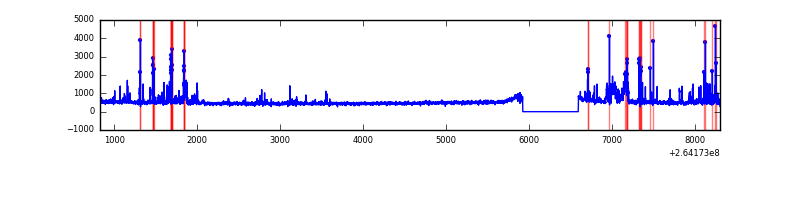 |
| C | 7476 | 6807 | 3 | 3 | 0.04% | 0.04% | 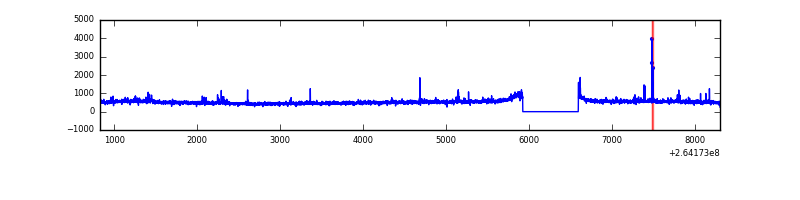 |
| D | 7476 | 6807 | 164 | 164 | 2.19% | 2.41% | 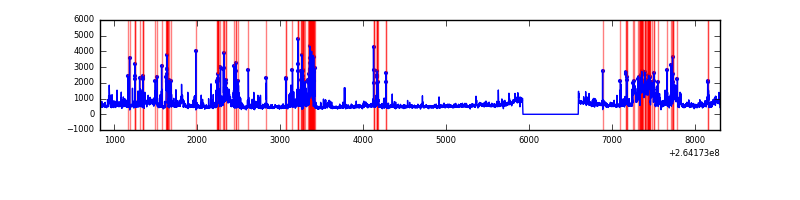 |
Top three noisy pixels from each quadrant. If the there are fewer than three noisy pixels in the level2.evt file, extra rows are filled as -1
| Pixel properties | Quadrant properties | ||||||
|---|---|---|---|---|---|---|---|
| Quadrant | DetID | PixID | Counts | Sigma | Mean | Median | Sigma |
| A | 12 | 189 | 53648 | 321.68 | 812 | 794 | 164.3 |
| A | 8 | 15 | 19278 | 112.5 | 812 | 794 | 164.3 |
| A | 15 | 69 | 11522 | 65.29 | 812 | 794 | 164.3 |
| B | 0 | 182 | 218166 | 1434.4 | 808 | 788 | 151.5 |
| B | 0 | 229 | 204283 | 1342.79 | 808 | 788 | 151.5 |
| B | 4 | 97 | 55793 | 362.96 | 808 | 788 | 151.5 |
| C | 3 | 233 | 527296 | 2921.88 | 782 | 785 | 180.2 |
| C | 0 | 207 | 14495 | 76.08 | 782 | 785 | 180.2 |
| C | 7 | 221 | 6525 | 31.85 | 782 | 785 | 180.2 |
| D | 1 | 52 | 497526 | 2696.34 | 776 | 758 | 184.2 |
| D | 5 | 222 | 447222 | 2423.3 | 776 | 758 | 184.2 |
| D | 8 | 195 | 388114 | 2102.48 | 776 | 758 | 184.2 |
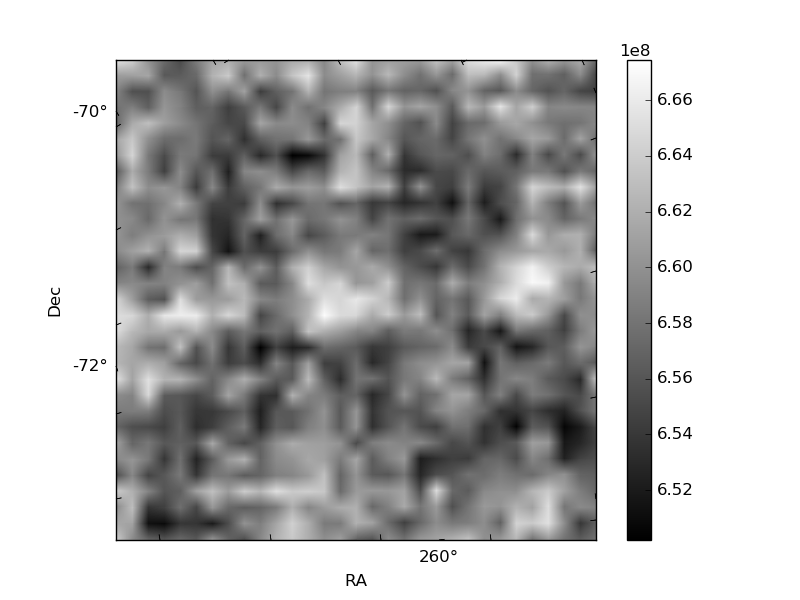
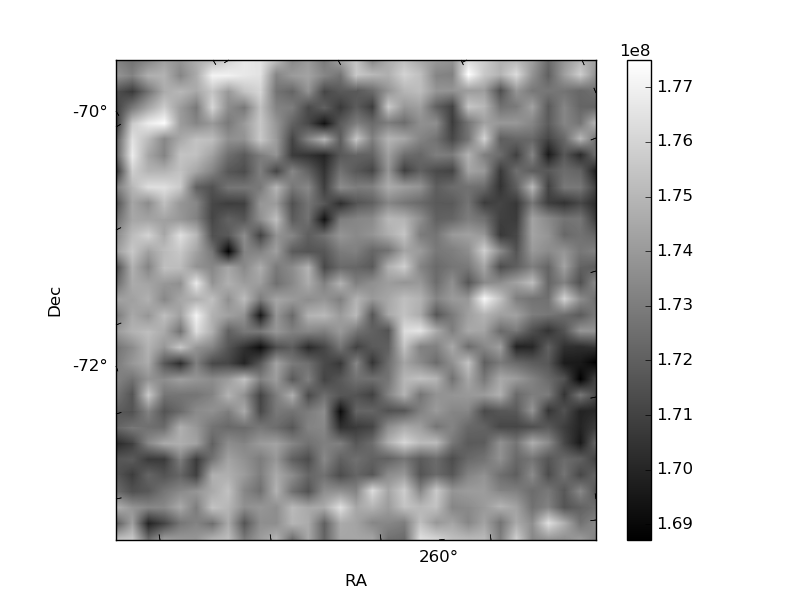
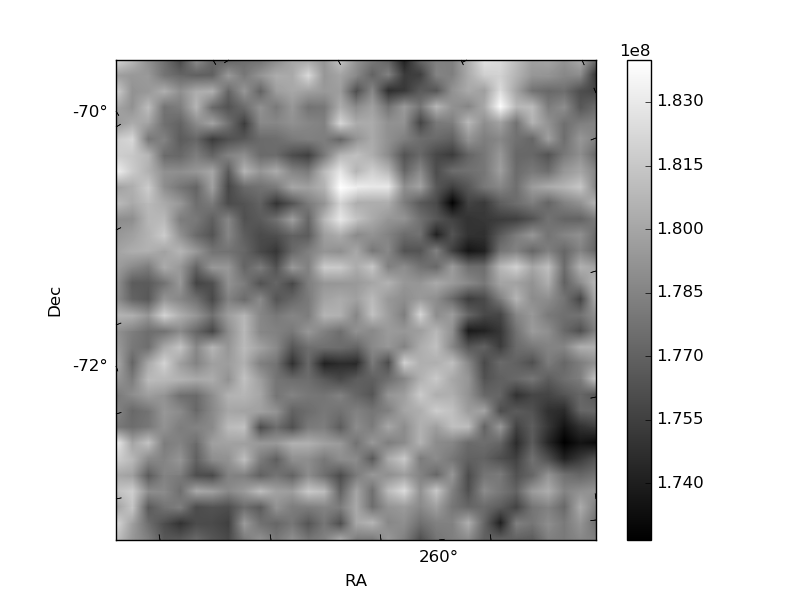
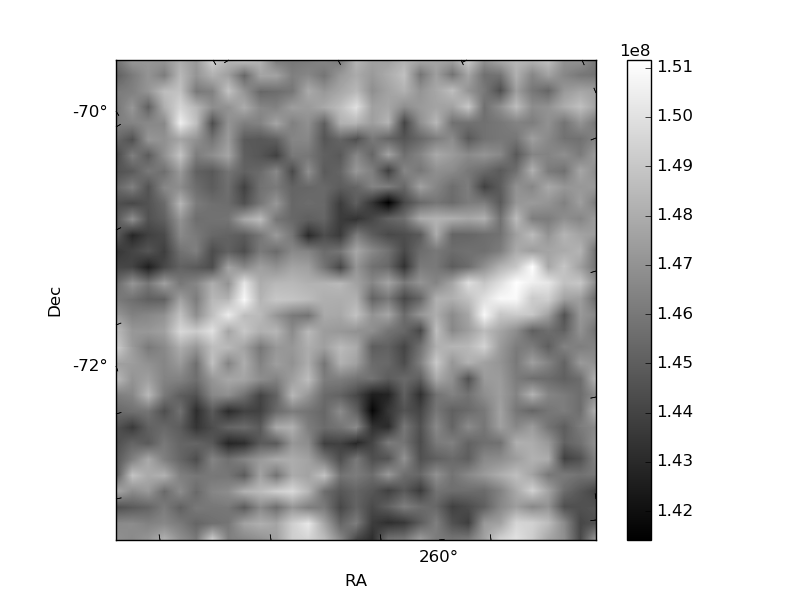
Histogram calculated using DETX and DETY for each event in the final _common_clean file
| Quadrant A | 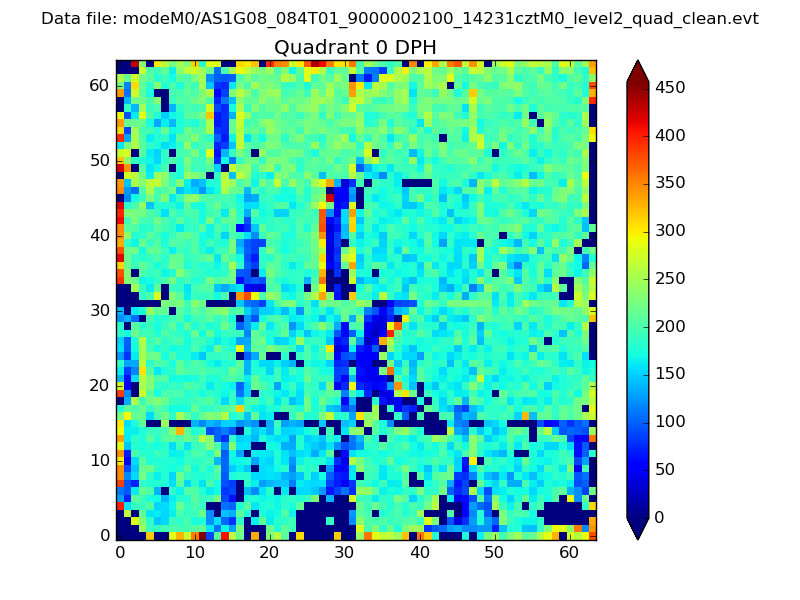 |
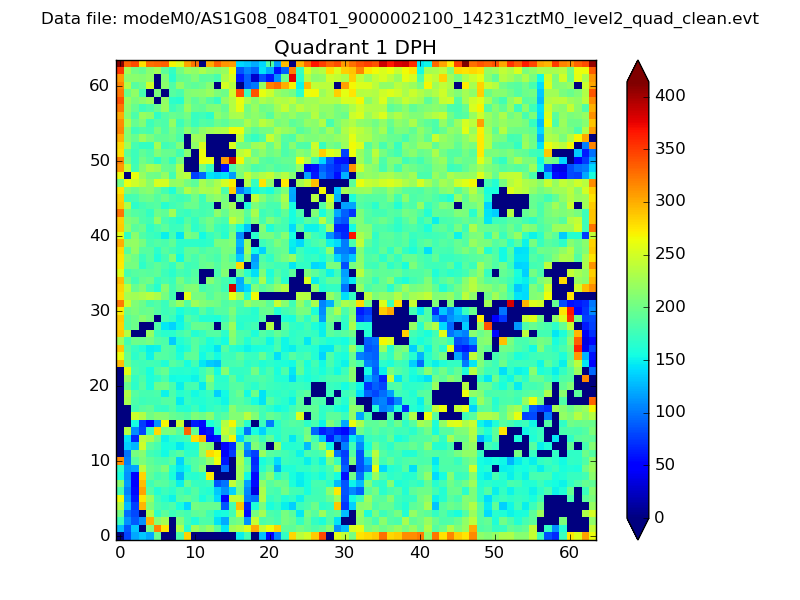 |
Quadrant B |
|---|---|---|---|
| Quadrant D | 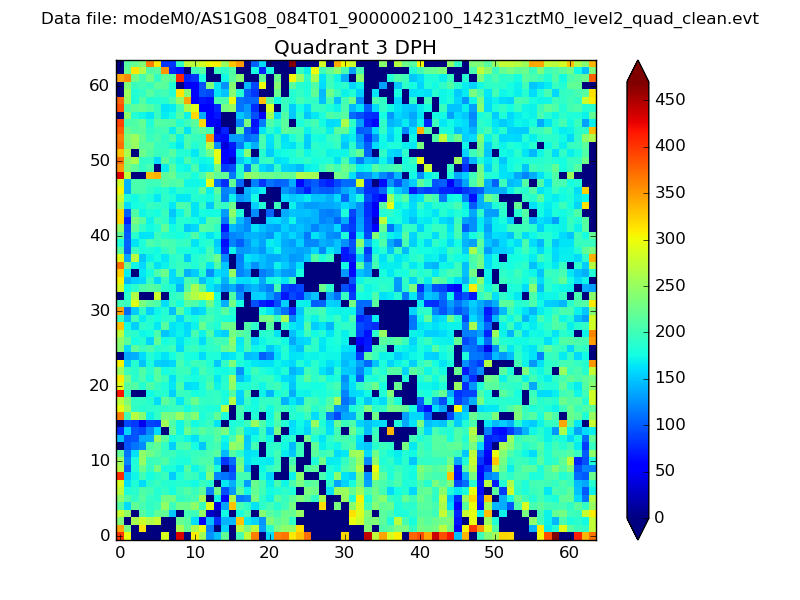 |
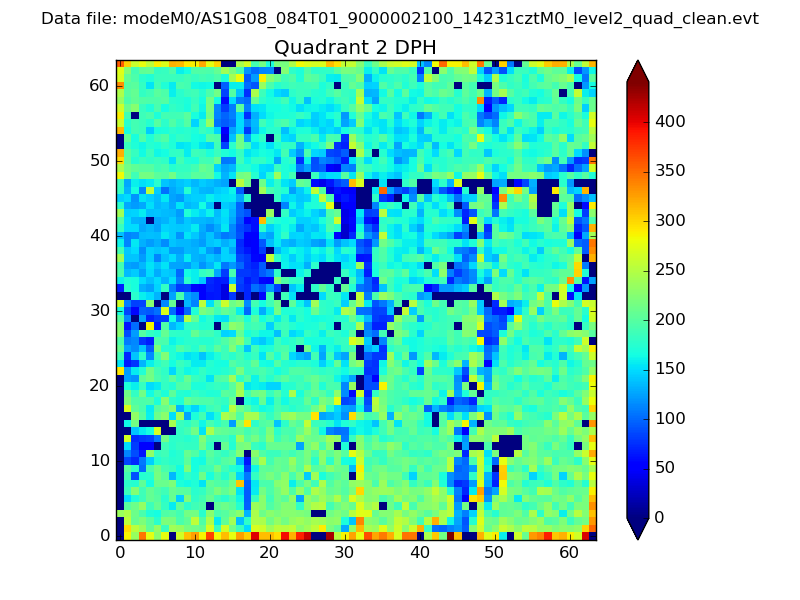 |
Quadrant C |
| Plot type | Count rate plots | Images |
|---|---|---|
| Comparison with Poisson distribution Blue bars denote a histogram of data divided into 1 sec bins. Red curve is a Poisson curve with rate = median count rate of data. |
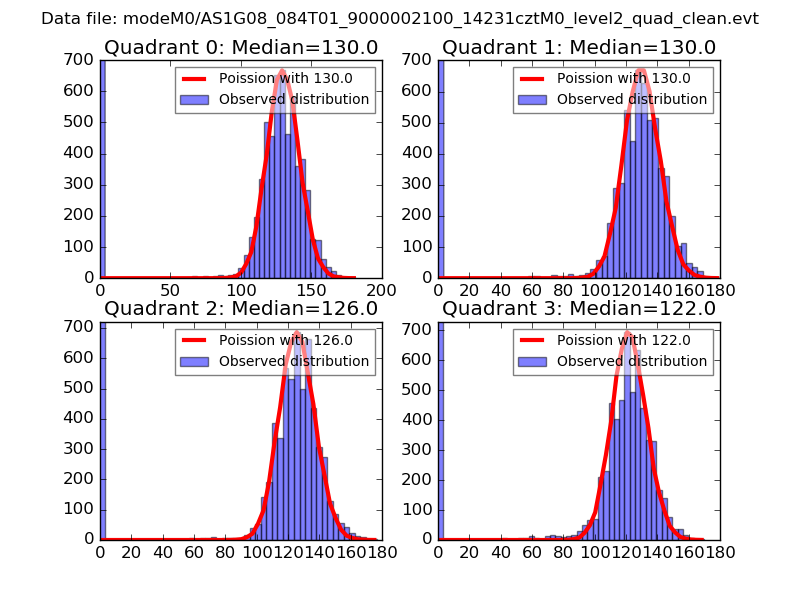 |
 |
| Quadrant-wise count rates Data is divided into 100 sec bins |
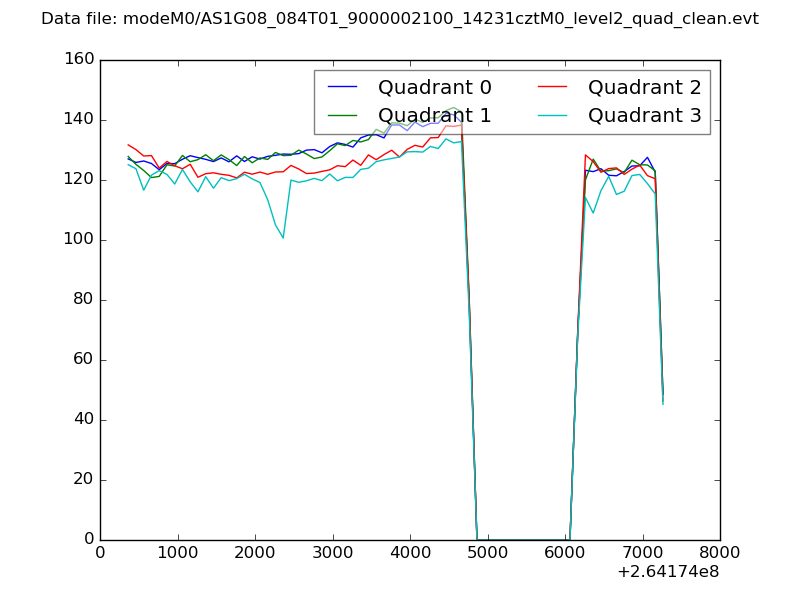 |
|
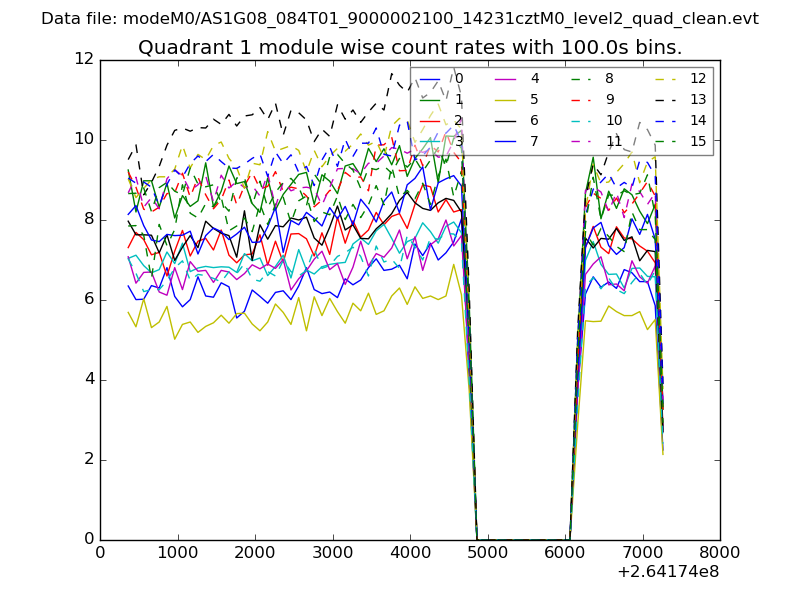
| Module-wise count rates for Quadrant A Data is divided into 100 sec bins |
 |
 |
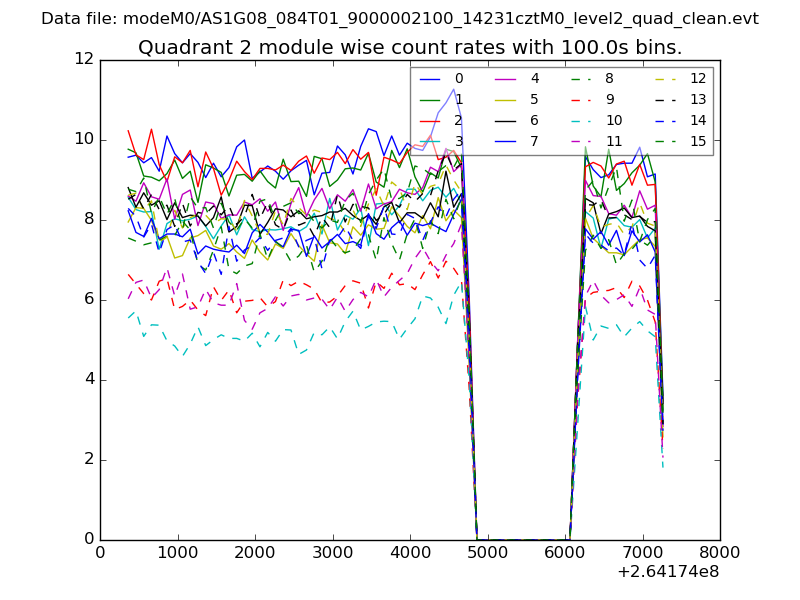
| Module-wise count rates for Quadrant B Data is divided into 100 sec bins |
 |
 |
| Module-wise count rates for Quadrant C Data is divided into 100 sec bins |
 |
 |
| Module-wise count rates for Quadrant D Data is divided into 100 sec bins |
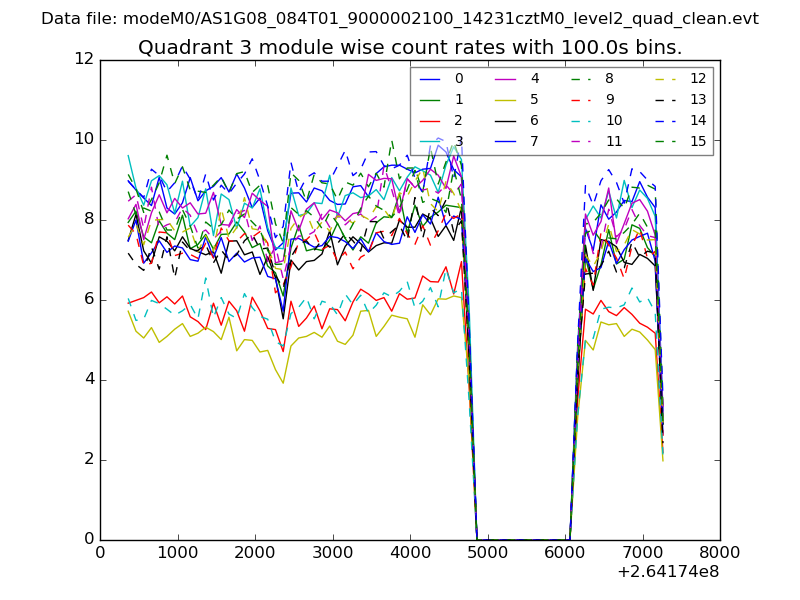 |
 |
| Parameter | Plot |
|---|---|
| CZT HV Monitor | 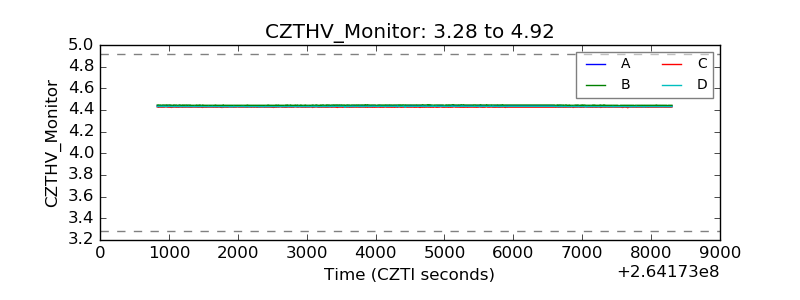 |
| D_VDD | 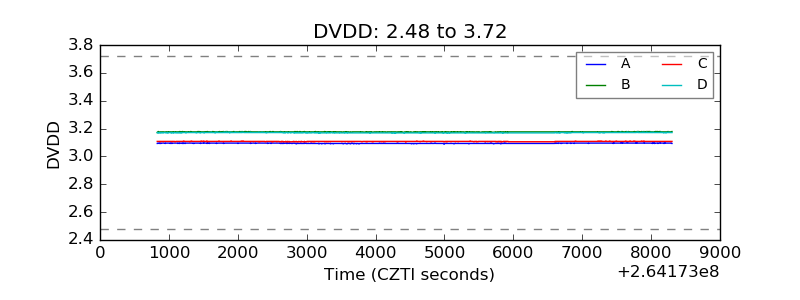 |
| Temperature 1 |  |
| Veto HV Monitor | 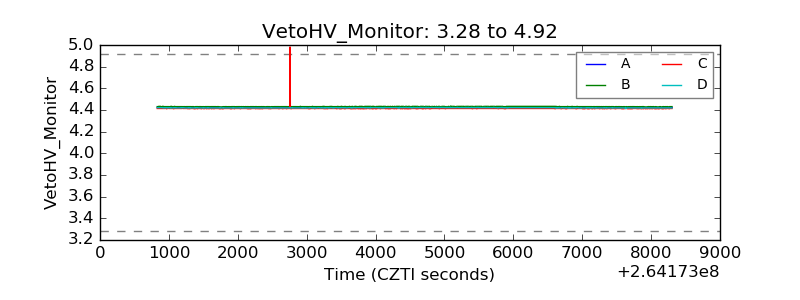 |
| Veto LLD | 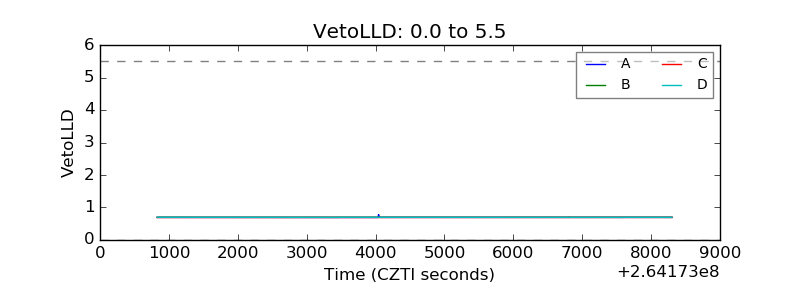 |
| Alpha Counter | 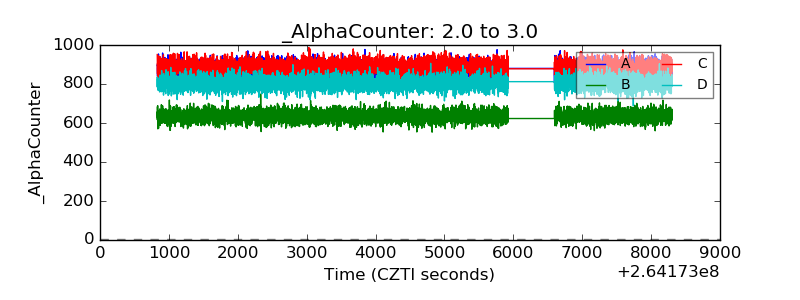 |
| _CPM_Rate | 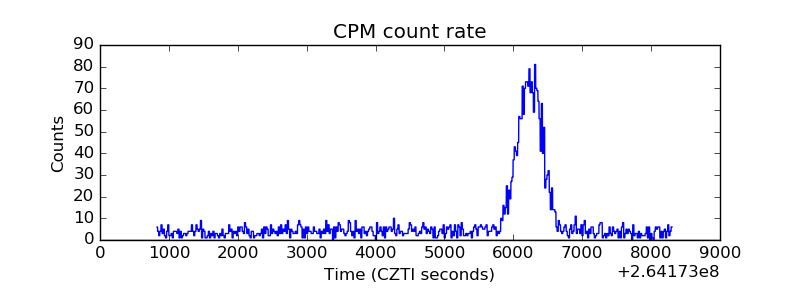 |
| CZT Counter | 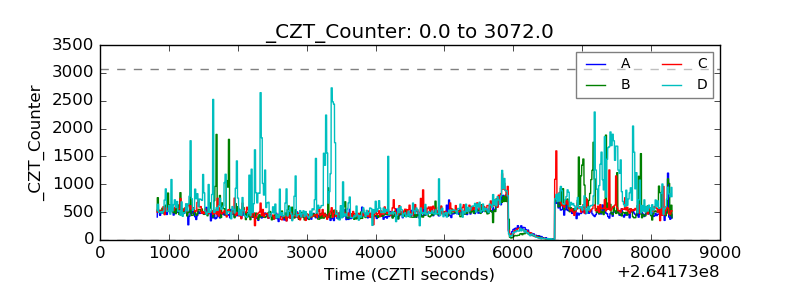 |
| +2.5 Volts monitor |  |
| +5 Volts monitor |  |
| _ROLL_ROT |  |
| _Roll_DEC | 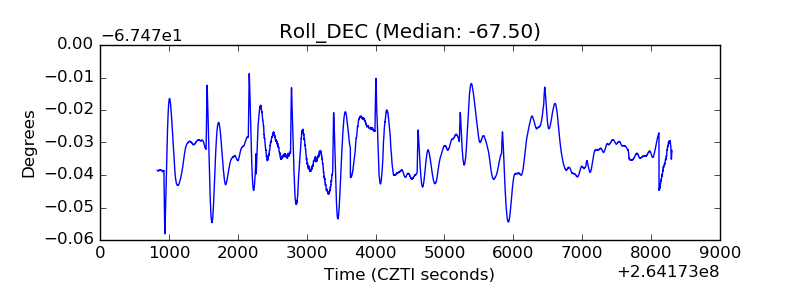 |
| _Roll_RA | 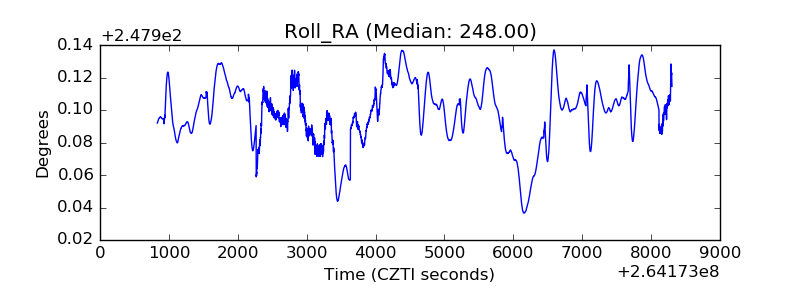 |
| Veto Counter |  |