| Param | Original file | Final file |
|---|---|---|
| Filename | modeM0/AS1G08_084T01_9000002100_14232cztM0_level2.evt | modeM0/AS1G08_084T01_9000002100_14232cztM0_level2_quad_clean.evt |
| Size (bytes) | 602,962,560 | 111,337,920 |
| Size | 575.0 MB | 106.2 MB |
| Events in quadrant A | 3,272,222 | 742,306 |
| Events in quadrant B | 4,116,607 | 740,659 |
| Events in quadrant C | 4,001,139 | 719,811 |
| Events in quadrant D | 6,395,067 | 679,622 |
| Mode SS | |||
|---|---|---|---|
| Quadrant | BADHDUFLAG | Total packets | Discarded packets |
| A | 0 | 144 | 0 |
| B | 0 | 144 | 0 |
| C | 0 | 144 | 0 |
| D | 0 | 144 | 0 |
| Mode M0 | |||
|---|---|---|---|
| Quadrant | BADHDUFLAG | Total packets | Discarded packets |
| A | 0 | 14407 | 2 |
| B | 0 | 16831 | 1 |
| C | 0 | 16122 | 1 |
| D | 0 | 23852 | 1 |
| Mode M9 | |||
|---|---|---|---|
| Quadrant | BADHDUFLAG | Total packets | Discarded packets |
| A | 0 | 4 | 0 |
| B | 0 | 4 | 0 |
| C | 0 | 4 | 0 |
| D | 0 | 4 | 0 |
| Quadrant | Total seconds | Saturated seconds | Saturation percentage |
|---|---|---|---|
| A | 7023 | 39 | 0.555318% |
| B | 7023 | 188 | 2.676919% |
| C | 7023 | 47 | 0.669230% |
| D | 7023 | 620 | 8.828136% |
Noise dominated data is calculated using 1-second bins in cleaned event files. If a bin has >2000 counts, and if more than 50% of those come from <1% of pixels, then it is considered to be noise-dominated and hence unusable.
| Quadrant | # 1 sec bins | Bins with >0 counts | Bins with >2000 counts | High rate bins dominated by noise | Noise dominated (total time) | Noise dominated (detector-on time) | Marked lightcurve |
|---|---|---|---|---|---|---|---|
| A | 7414 | 7025 | 1 | 1 | 0.01% | 0.01% |  |
| B | 7414 | 7025 | 69 | 69 | 0.93% | 0.98% |  |
| C | 7414 | 7025 | 12 | 12 | 0.16% | 0.17% |  |
| D | 7414 | 7025 | 552 | 552 | 7.45% | 7.86% |  |
Top three noisy pixels from each quadrant. If the there are fewer than three noisy pixels in the level2.evt file, extra rows are filled as -1
| Pixel properties | Quadrant properties | ||||||
|---|---|---|---|---|---|---|---|
| Quadrant | DetID | PixID | Counts | Sigma | Mean | Median | Sigma |
| A | 12 | 189 | 40494 | 235.9 | 827 | 810 | 168.2 |
| A | 8 | 15 | 16255 | 91.81 | 827 | 810 | 168.2 |
| A | 15 | 69 | 13601 | 76.03 | 827 | 810 | 168.2 |
| B | 10 | 16 | 341273 | 2173.03 | 821 | 801 | 156.7 |
| B | 0 | 229 | 221495 | 1408.56 | 821 | 801 | 156.7 |
| B | 0 | 182 | 75868 | 479.11 | 821 | 801 | 156.7 |
| C | 3 | 233 | 885693 | 4841.83 | 792 | 794 | 182.8 |
| C | 0 | 207 | 14398 | 74.44 | 792 | 794 | 182.8 |
| C | 13 | 61 | 5803 | 27.41 | 792 | 794 | 182.8 |
| D | 1 | 52 | 1281829 | 6958.37 | 771 | 750 | 184.1 |
| D | 8 | 195 | 830338 | 4506.03 | 771 | 750 | 184.1 |
| D | 12 | 110 | 693392 | 3762.18 | 771 | 750 | 184.1 |
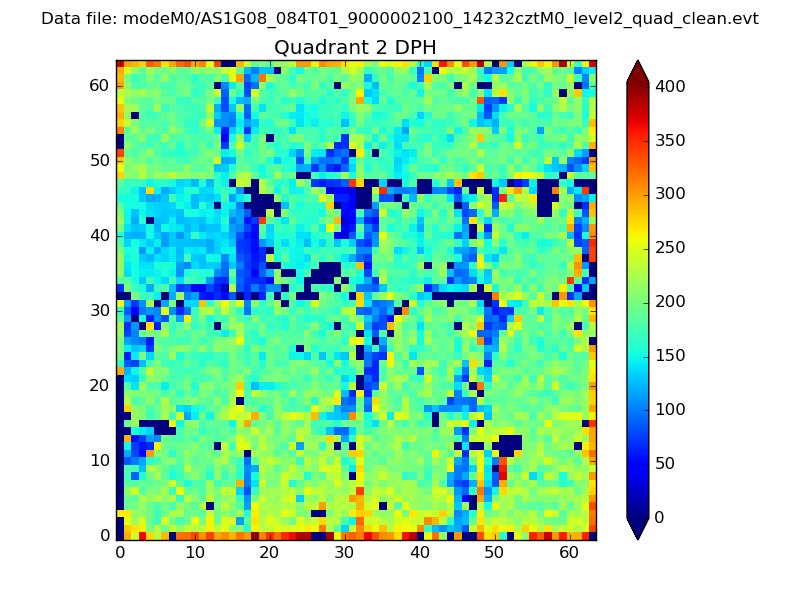
Histogram calculated using DETX and DETY for each event in the final _common_clean file
| Quadrant A | 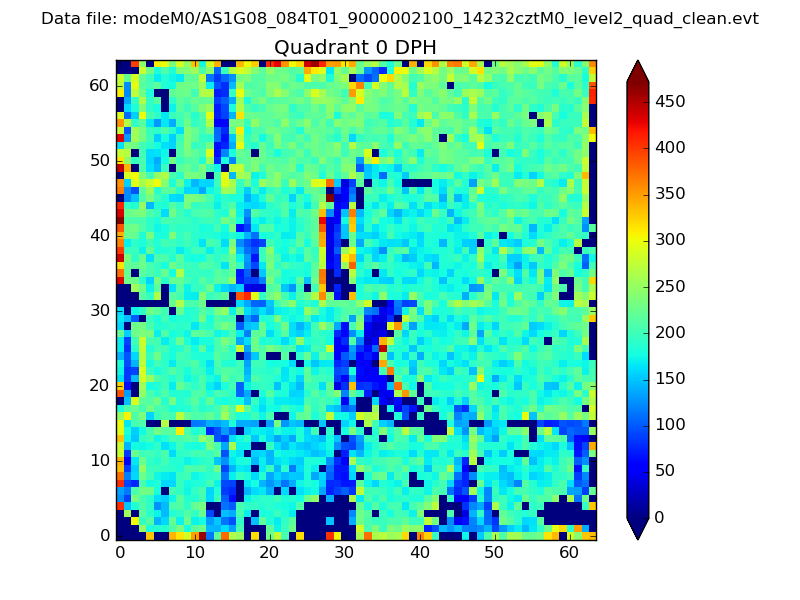 |
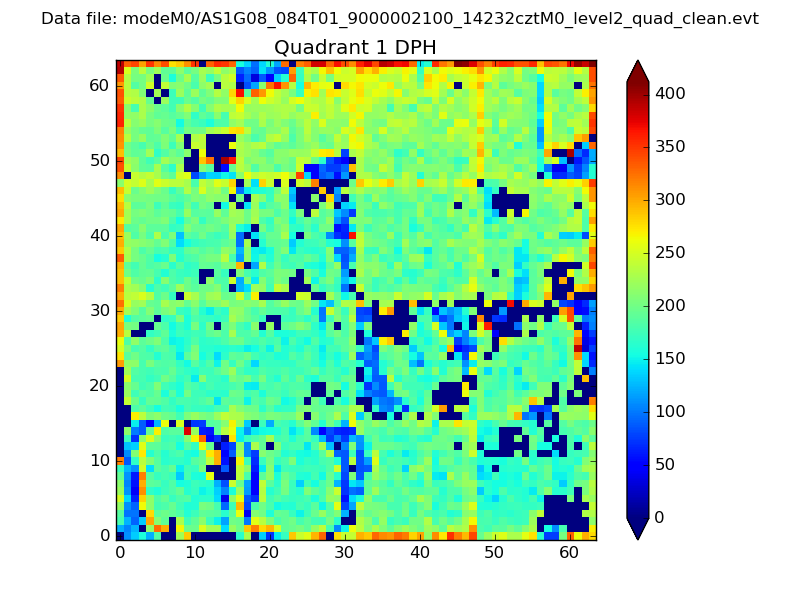 |
Quadrant B |
|---|---|---|---|
| Quadrant D | 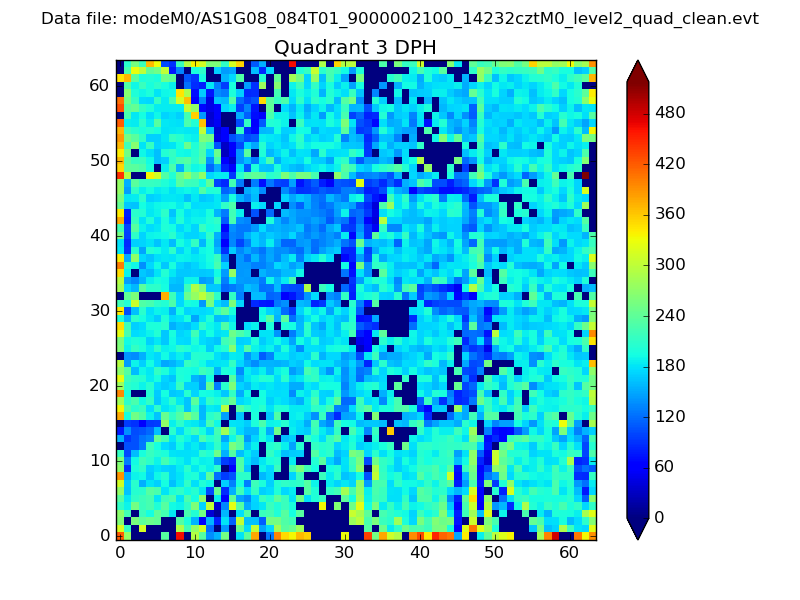 |
 |
Quadrant C |
| Plot type | Count rate plots | Images |
|---|---|---|
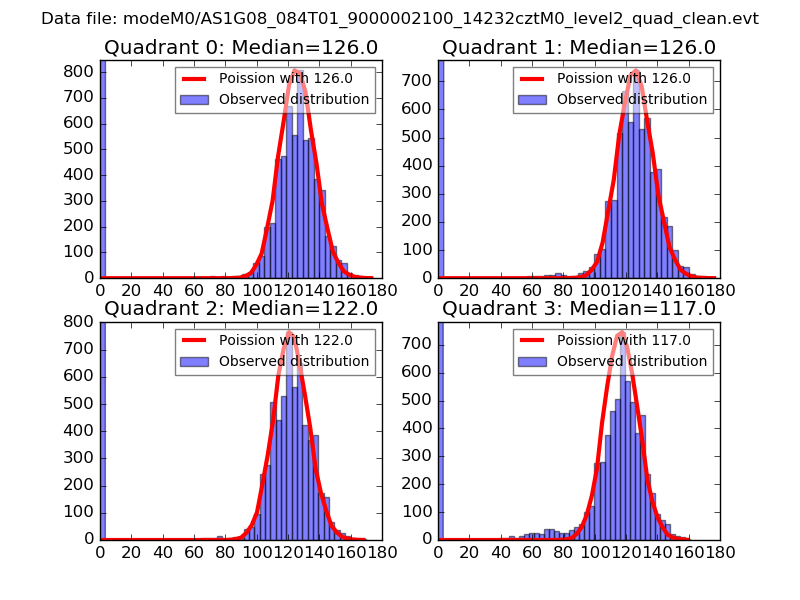
| Comparison with Poisson distribution Blue bars denote a histogram of data divided into 1 sec bins. Red curve is a Poisson curve with rate = median count rate of data. |
 |
 |
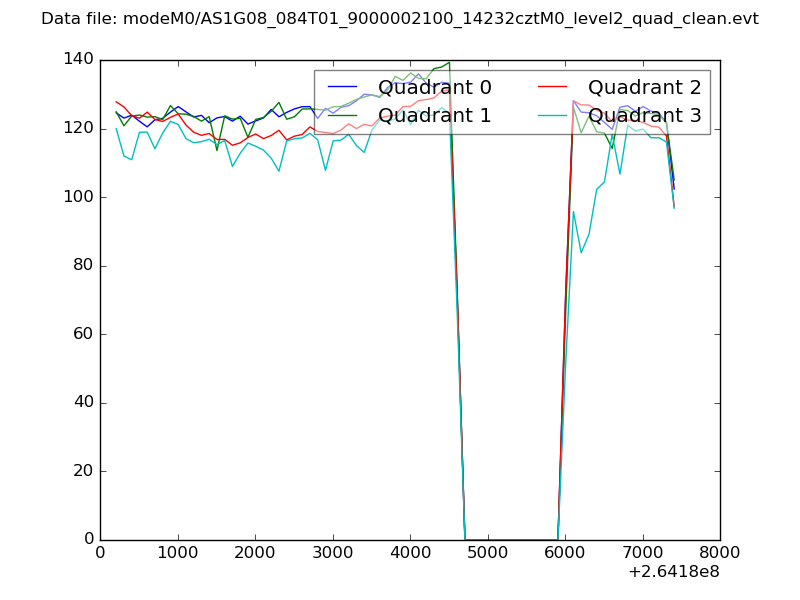
| Quadrant-wise count rates Data is divided into 100 sec bins |
 |
|
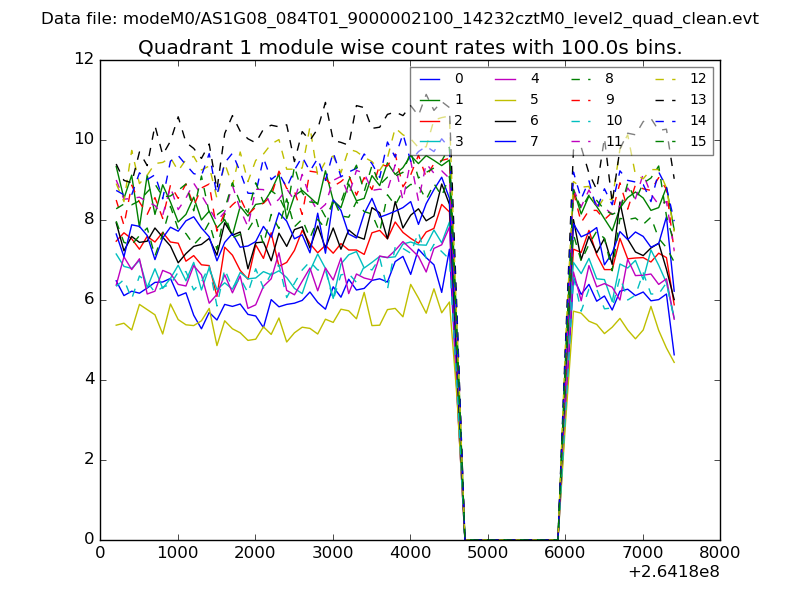
| Module-wise count rates for Quadrant A Data is divided into 100 sec bins |
 |
 |
| Module-wise count rates for Quadrant B Data is divided into 100 sec bins |
 |
 |
| Module-wise count rates for Quadrant C Data is divided into 100 sec bins |
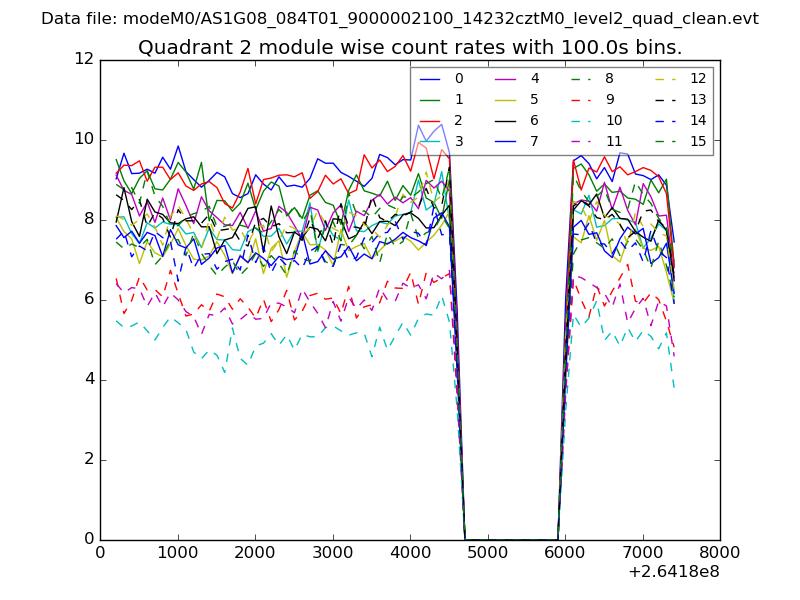 |
 |
| Module-wise count rates for Quadrant D Data is divided into 100 sec bins |
 |
 |
| Parameter | Plot |
|---|---|
| CZT HV Monitor | 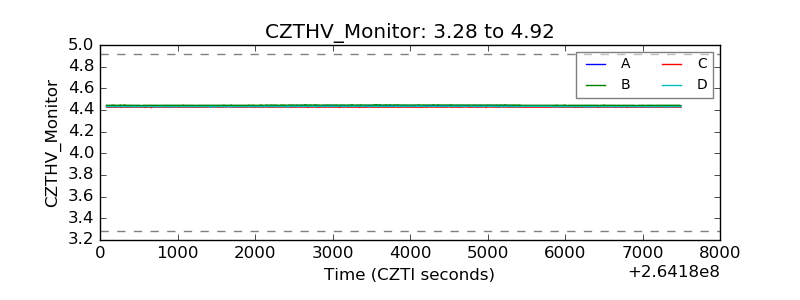 |
| D_VDD | 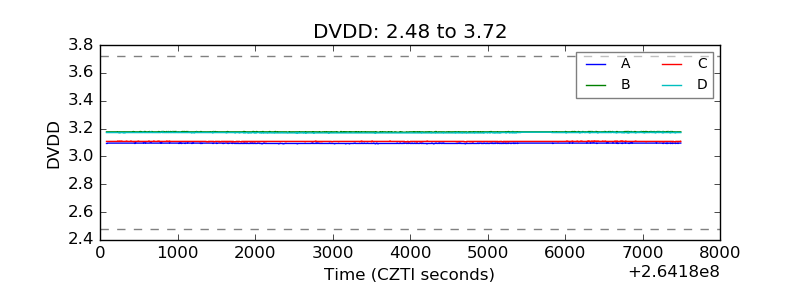 |
| Temperature 1 |  |
| Veto HV Monitor | 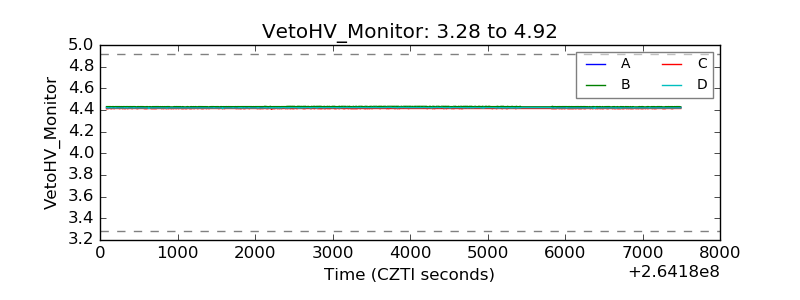 |
| Veto LLD | 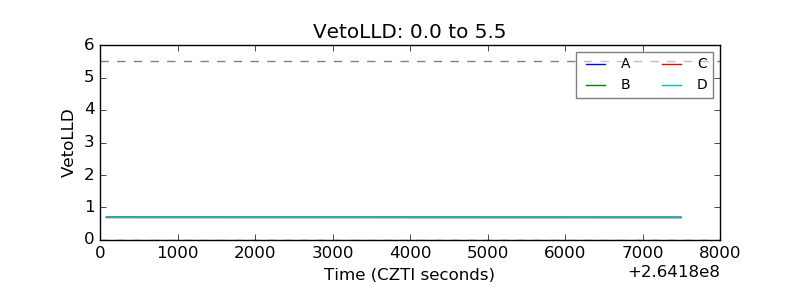 |
| Alpha Counter | 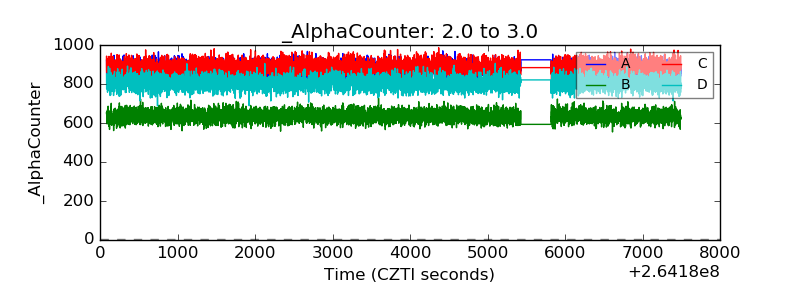 |
| _CPM_Rate | 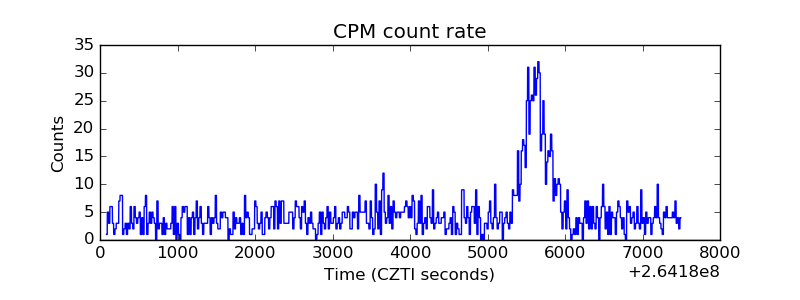 |
| CZT Counter | 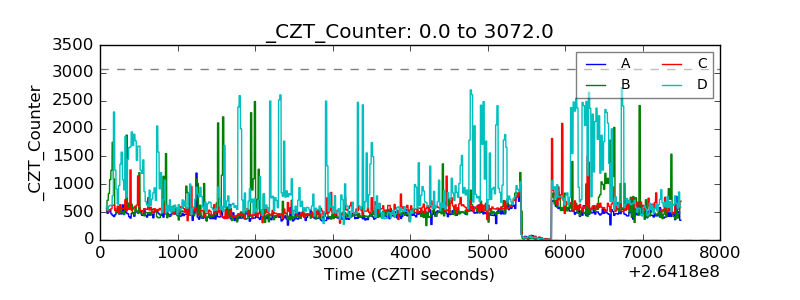 |
| +2.5 Volts monitor |  |
| +5 Volts monitor |  |
| _ROLL_ROT | 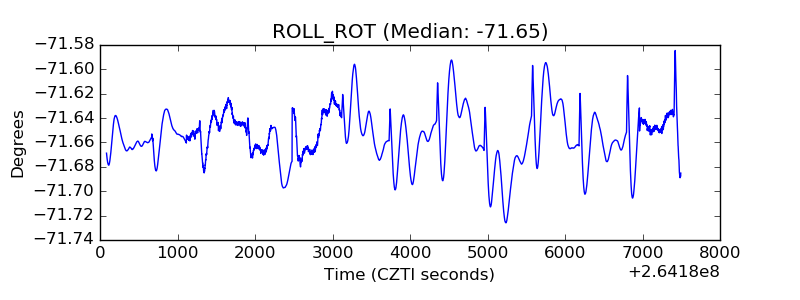 |
| _Roll_DEC | 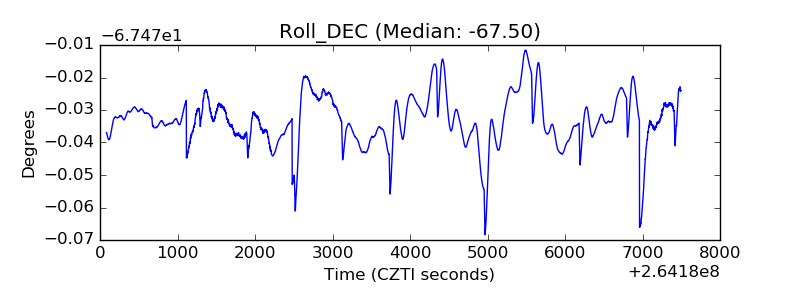 |
| _Roll_RA | 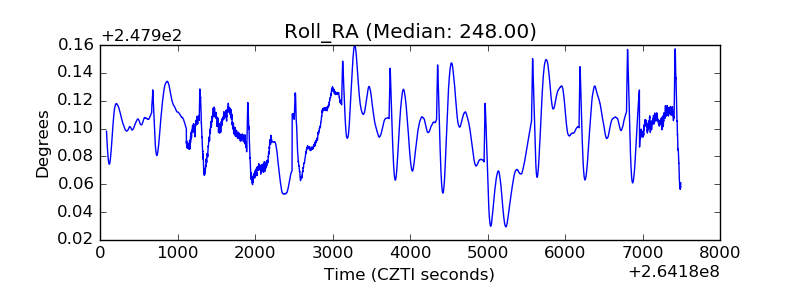 |
| Veto Counter | 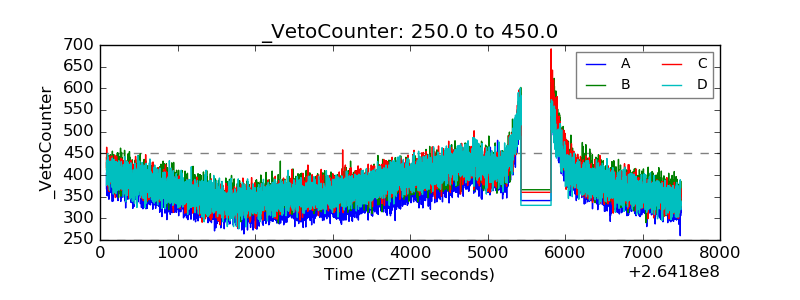 |