| Param | Original file | Final file |
|---|---|---|
| Filename | modeM0/AS1G08_084T01_9000002100_14233cztM0_level2.evt | modeM0/AS1G08_084T01_9000002100_14233cztM0_level2_quad_clean.evt |
| Size (bytes) | 634,783,680 | 113,163,840 |
| Size | 605.4 MB | 107.9 MB |
| Events in quadrant A | 3,647,315 | 755,226 |
| Events in quadrant B | 4,884,375 | 736,234 |
| Events in quadrant C | 4,463,252 | 728,222 |
| Events in quadrant D | 5,726,980 | 690,674 |
| Mode SS | |||
|---|---|---|---|
| Quadrant | BADHDUFLAG | Total packets | Discarded packets |
| A | 0 | 152 | 0 |
| B | 0 | 152 | 0 |
| C | 0 | 152 | 0 |
| D | 0 | 152 | 0 |
| Mode M0 | |||
|---|---|---|---|
| Quadrant | BADHDUFLAG | Total packets | Discarded packets |
| A | 0 | 15649 | 2 |
| B | 0 | 19472 | 1 |
| C | 0 | 18061 | 1 |
| D | 0 | 21962 | 1 |
| Mode M9 | |||
|---|---|---|---|
| Quadrant | BADHDUFLAG | Total packets | Discarded packets |
| A | 0 | 2 | 0 |
| B | 0 | 2 | 0 |
| C | 0 | 2 | 0 |
| D | 0 | 2 | 0 |
| Quadrant | Total seconds | Saturated seconds | Saturation percentage |
|---|---|---|---|
| A | 7419 | 47 | 0.633509% |
| B | 7419 | 455 | 6.132902% |
| C | 7419 | 50 | 0.673945% |
| D | 7419 | 492 | 6.631622% |
Noise dominated data is calculated using 1-second bins in cleaned event files. If a bin has >2000 counts, and if more than 50% of those come from <1% of pixels, then it is considered to be noise-dominated and hence unusable.
| Quadrant | # 1 sec bins | Bins with >0 counts | Bins with >2000 counts | High rate bins dominated by noise | Noise dominated (total time) | Noise dominated (detector-on time) | Marked lightcurve |
|---|---|---|---|---|---|---|---|
| A | 7680 | 7421 | 0 | 0 | 0.00% | 0.00% | 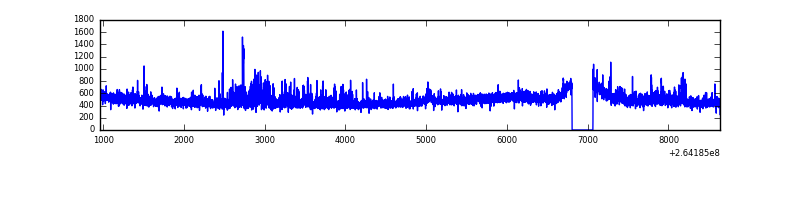 |
| B | 7680 | 7421 | 234 | 234 | 3.05% | 3.15% | 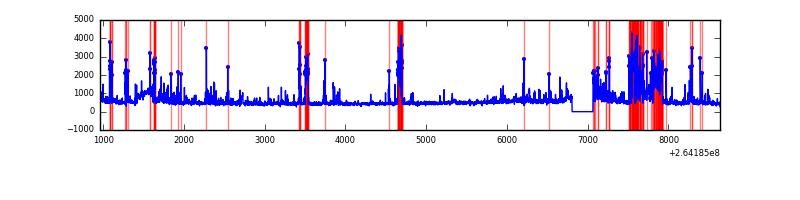 |
| C | 7680 | 7421 | 6 | 6 | 0.08% | 0.08% | 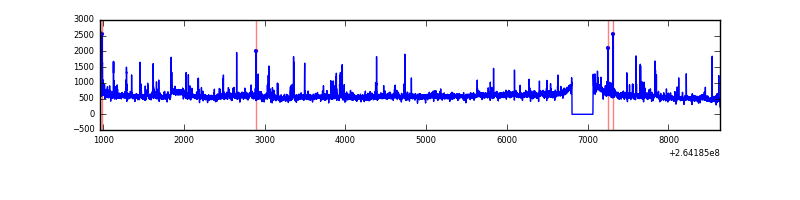 |
| D | 7680 | 7421 | 405 | 405 | 5.27% | 5.46% | 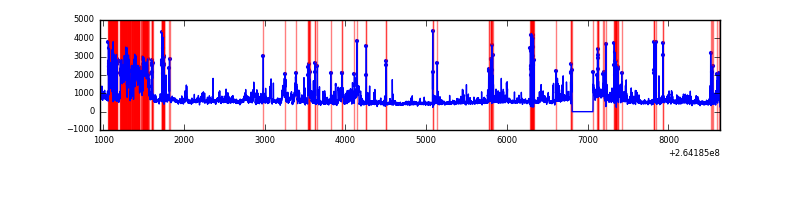 |
Top three noisy pixels from each quadrant. If the there are fewer than three noisy pixels in the level2.evt file, extra rows are filled as -1
| Pixel properties | Quadrant properties | ||||||
|---|---|---|---|---|---|---|---|
| Quadrant | DetID | PixID | Counts | Sigma | Mean | Median | Sigma |
| A | 14 | 111 | 108652 | 600.42 | 877 | 859 | 179.5 |
| A | 8 | 15 | 80231 | 442.11 | 877 | 859 | 179.5 |
| A | 12 | 189 | 76198 | 419.65 | 877 | 859 | 179.5 |
| B | 10 | 16 | 1000361 | 6153.5 | 859 | 836 | 162.4 |
| B | 0 | 229 | 248733 | 1526.16 | 859 | 836 | 162.4 |
| B | 4 | 48 | 55509 | 336.59 | 859 | 836 | 162.4 |
| C | 3 | 233 | 1165526 | 5981.27 | 841 | 844 | 194.7 |
| C | 14 | 234 | 8763 | 40.67 | 841 | 844 | 194.7 |
| C | 3 | 232 | 6415 | 28.61 | 841 | 844 | 194.7 |
| D | 12 | 110 | 1006753 | 4839.75 | 820 | 798 | 207.9 |
| D | 8 | 195 | 502586 | 2414.15 | 820 | 798 | 207.9 |
| D | 5 | 222 | 499976 | 2401.59 | 820 | 798 | 207.9 |
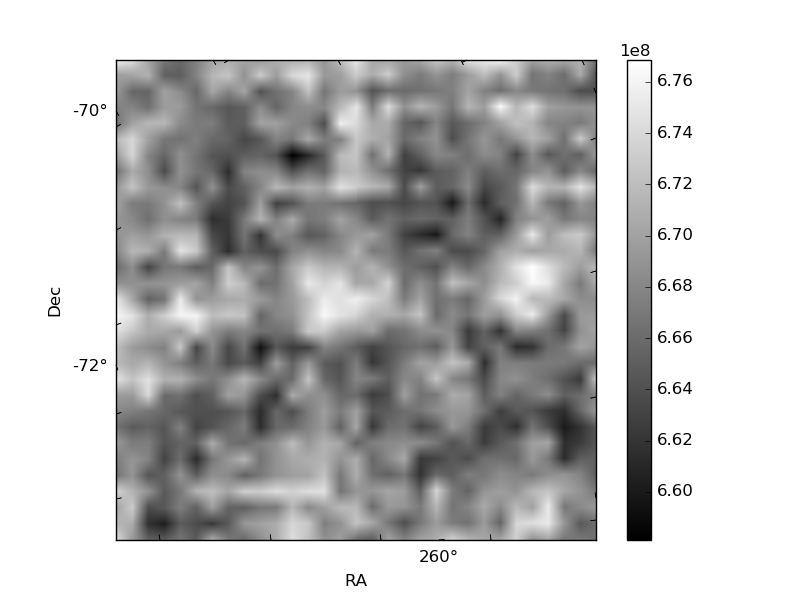
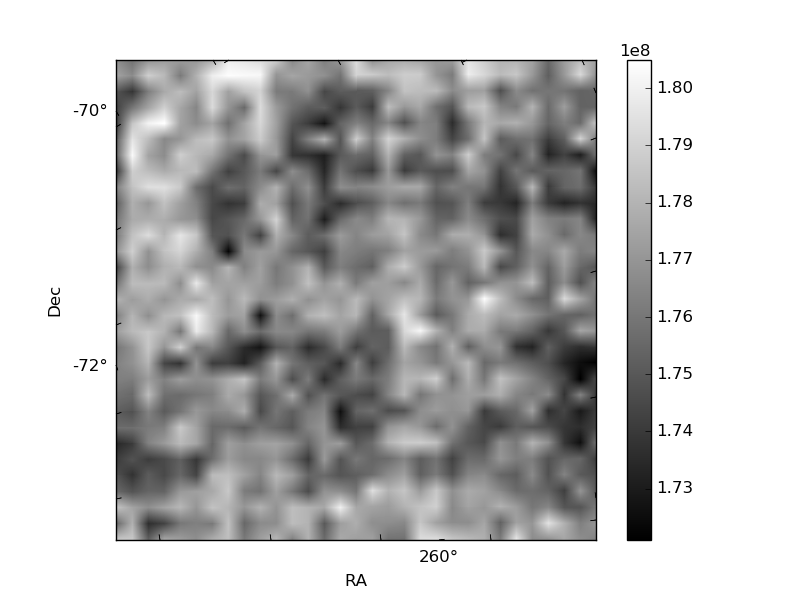
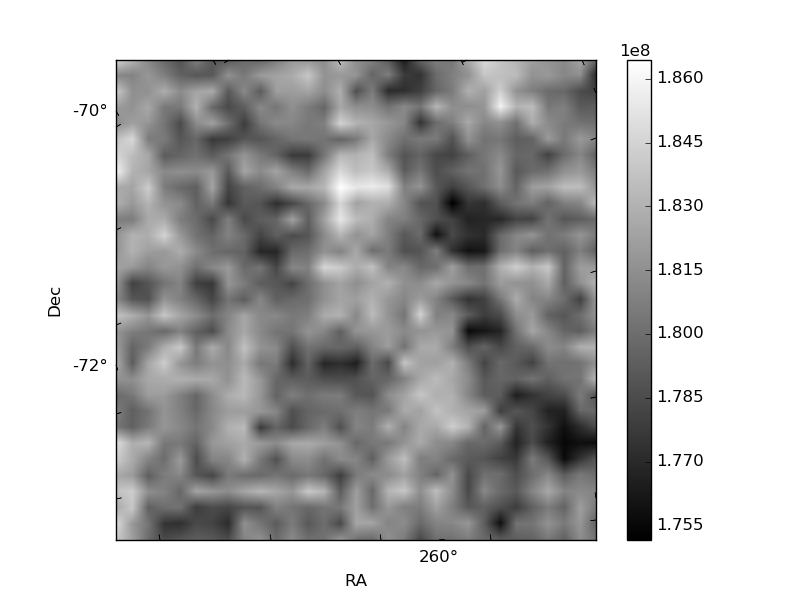
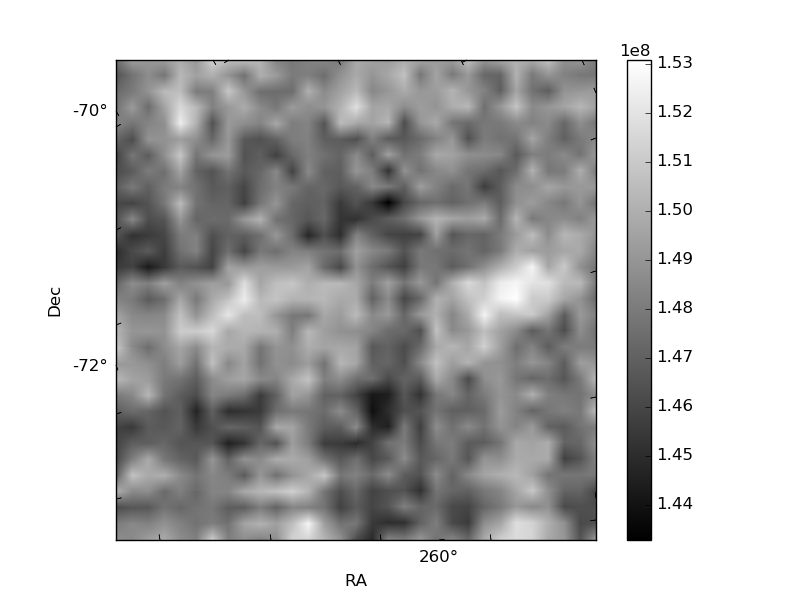
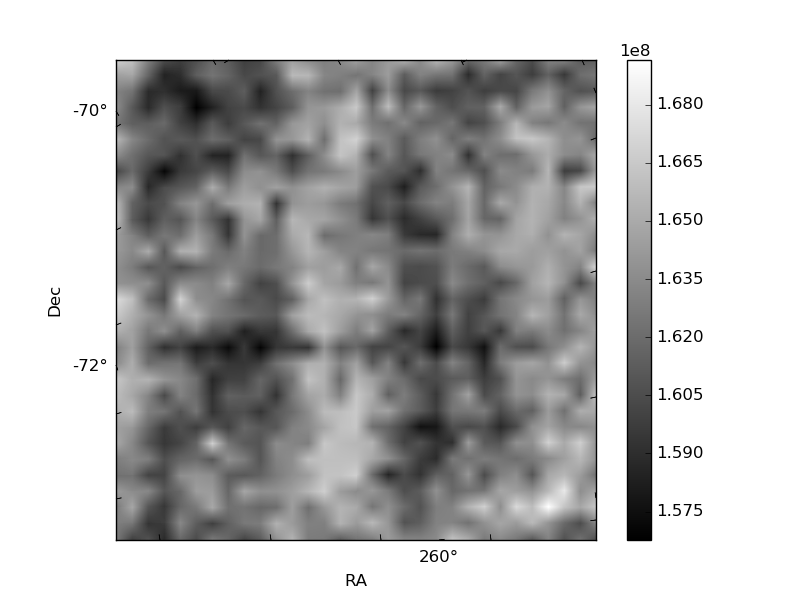
Histogram calculated using DETX and DETY for each event in the final _common_clean file
| Quadrant A | 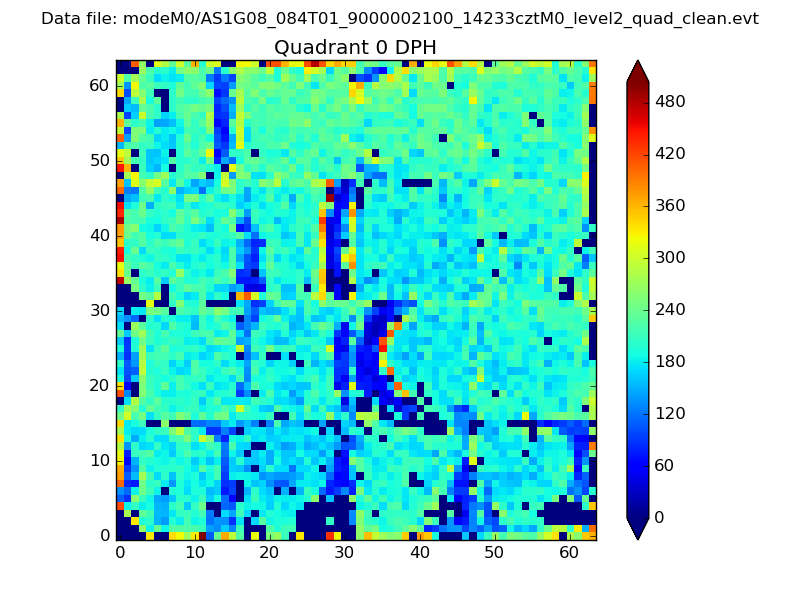 |
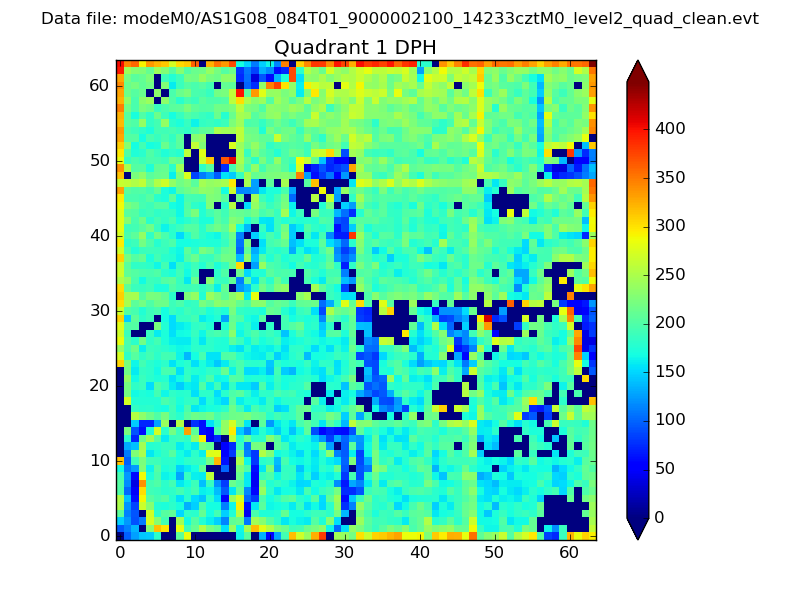 |
Quadrant B |
|---|---|---|---|
| Quadrant D |  |
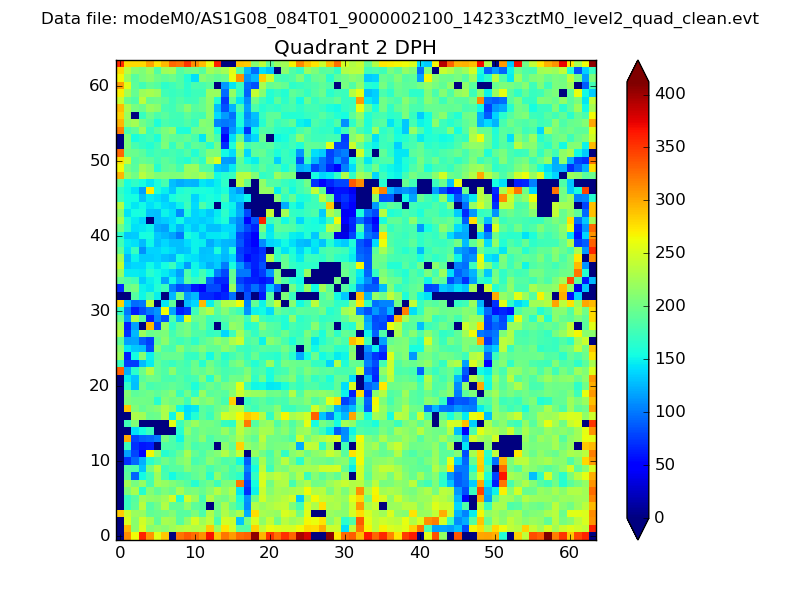 |
Quadrant C |
| Plot type | Count rate plots | Images |
|---|---|---|
| Comparison with Poisson distribution Blue bars denote a histogram of data divided into 1 sec bins. Red curve is a Poisson curve with rate = median count rate of data. |
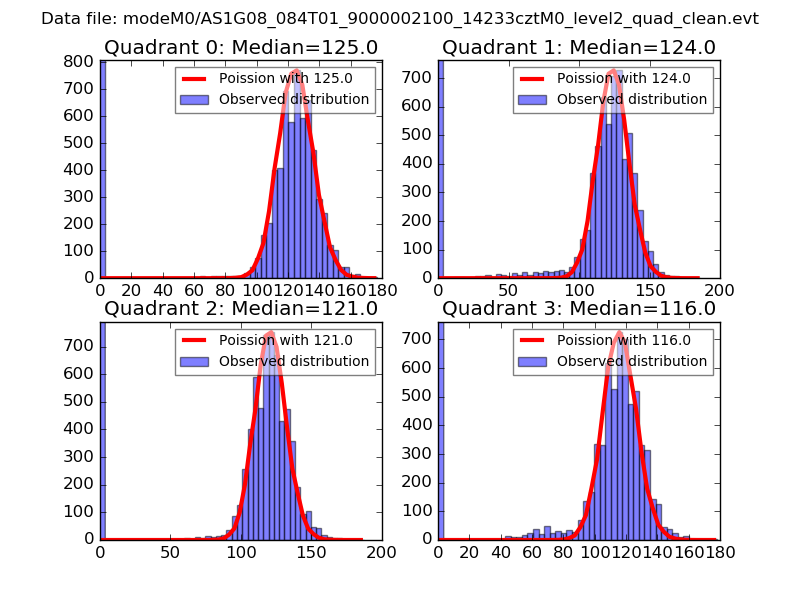 |
 |
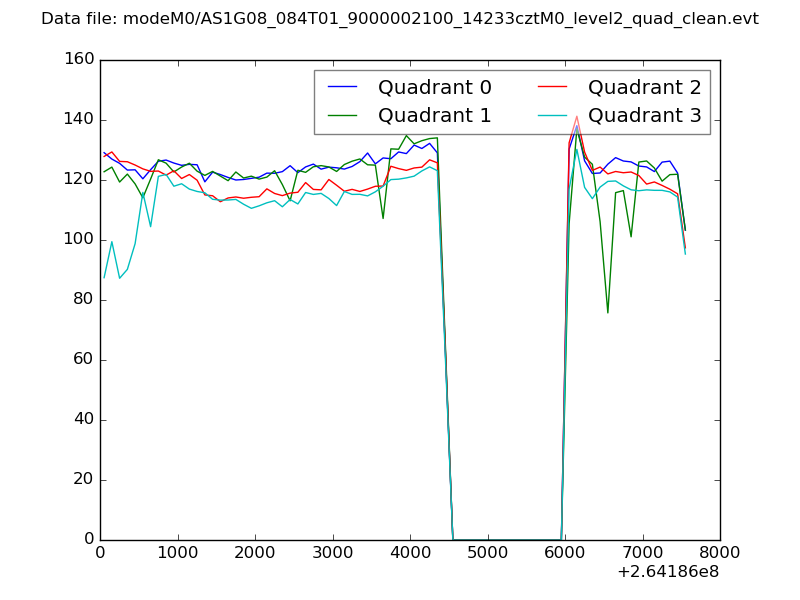
| Quadrant-wise count rates Data is divided into 100 sec bins |
 |
|
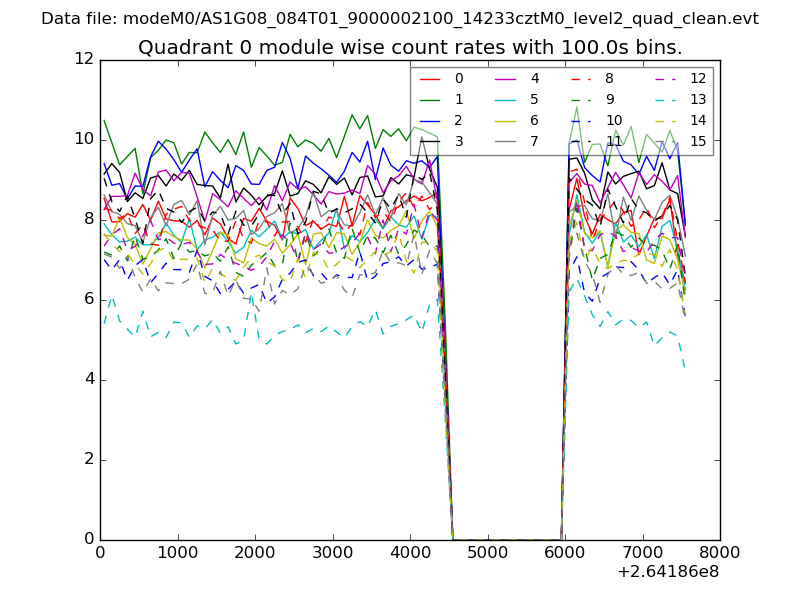
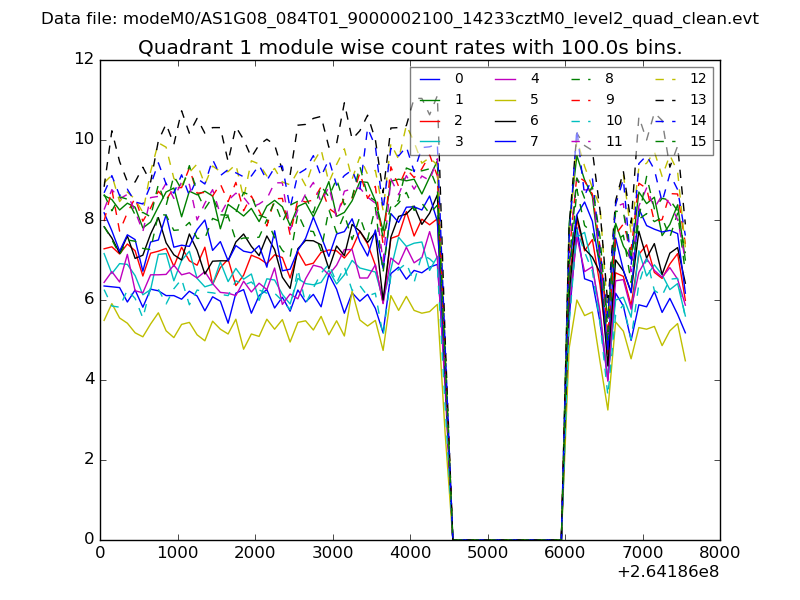
| Module-wise count rates for Quadrant A Data is divided into 100 sec bins |
 |
 |
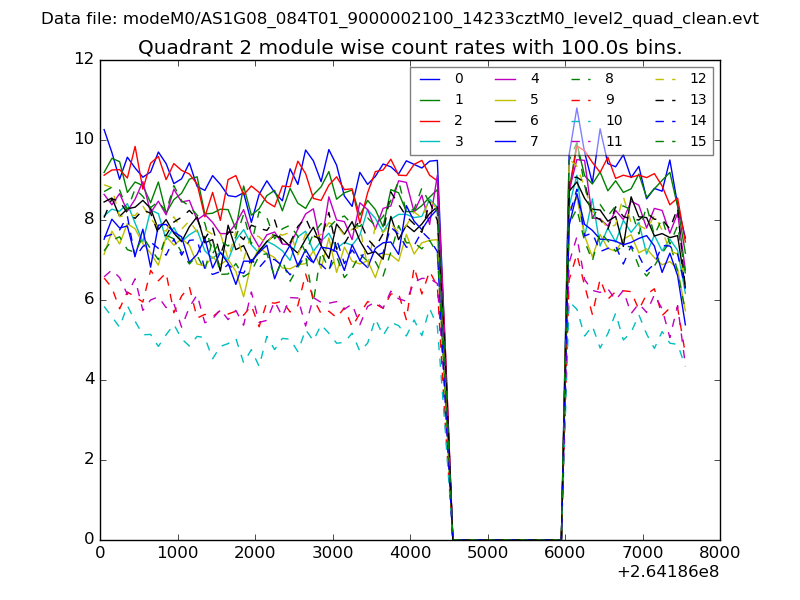
| Module-wise count rates for Quadrant B Data is divided into 100 sec bins |
 |
 |
| Module-wise count rates for Quadrant C Data is divided into 100 sec bins |
 |
 |
| Module-wise count rates for Quadrant D Data is divided into 100 sec bins |
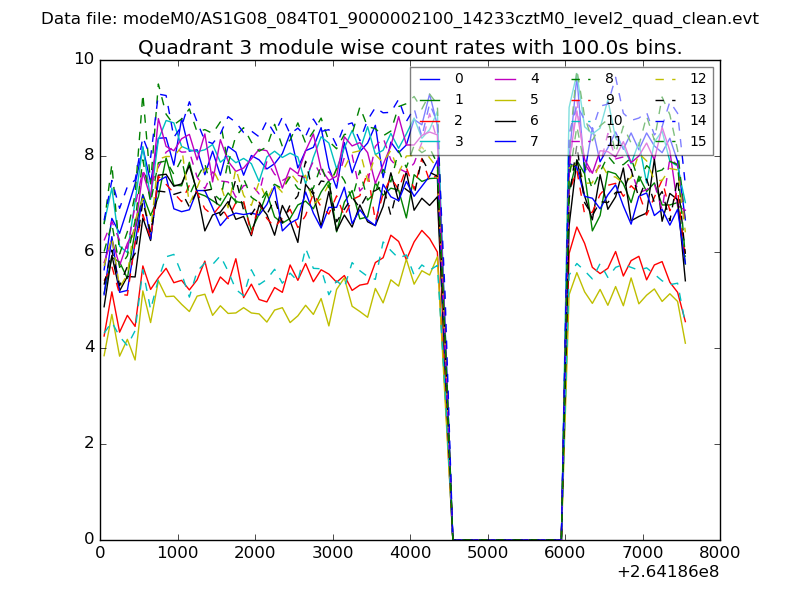 |
 |
| Parameter | Plot |
|---|---|
| CZT HV Monitor | 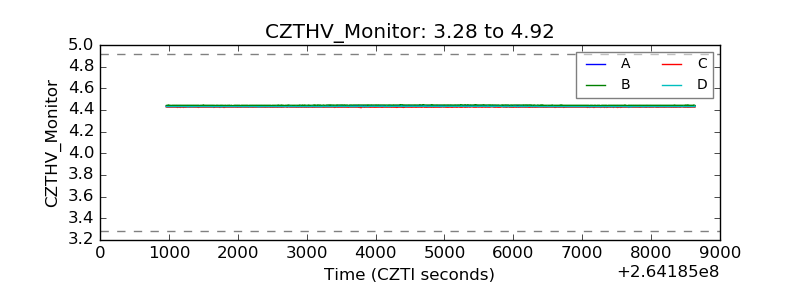 |
| D_VDD |  |
| Temperature 1 | 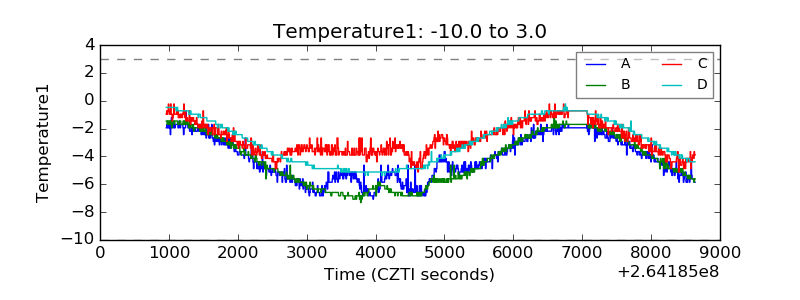 |
| Veto HV Monitor | 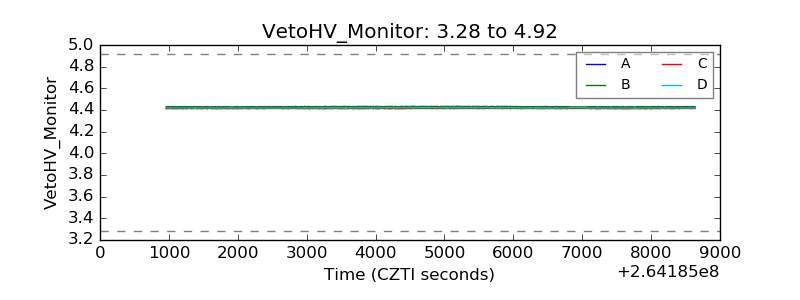 |
| Veto LLD | 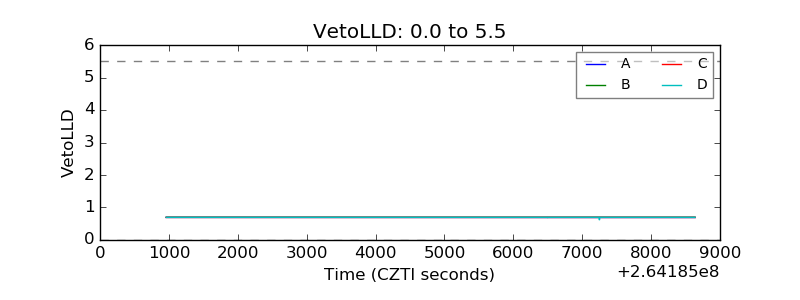 |
| Alpha Counter | 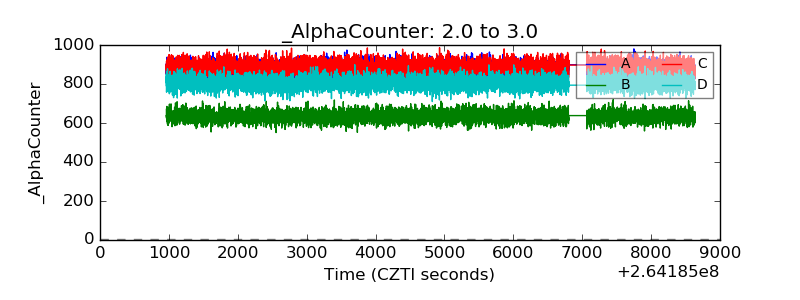 |
| _CPM_Rate | 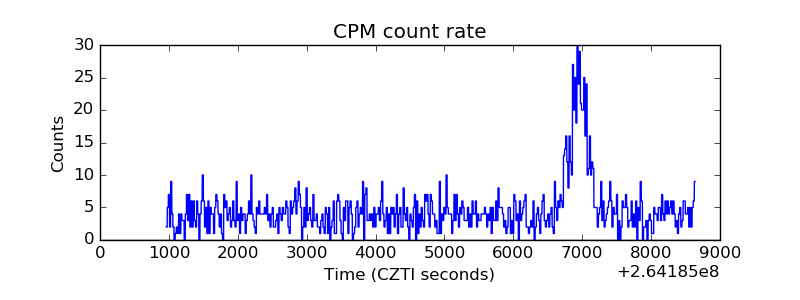 |
| CZT Counter | 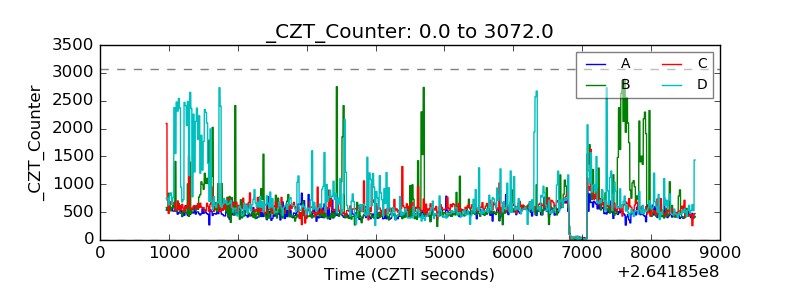 |
| +2.5 Volts monitor |  |
| +5 Volts monitor | 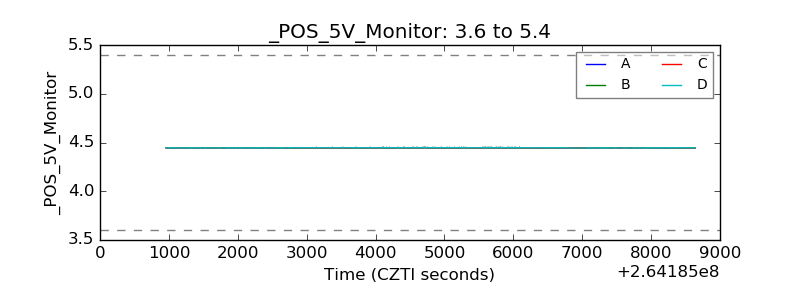 |
| _ROLL_ROT | 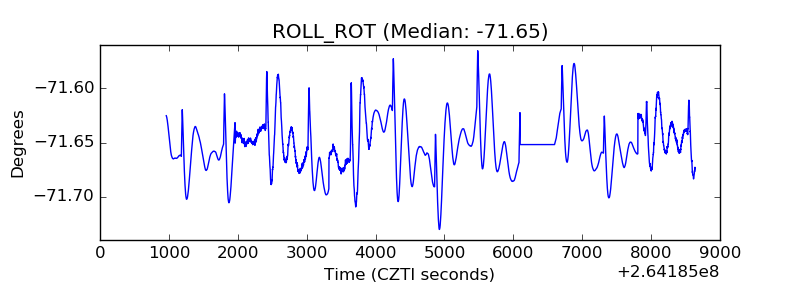 |
| _Roll_DEC | 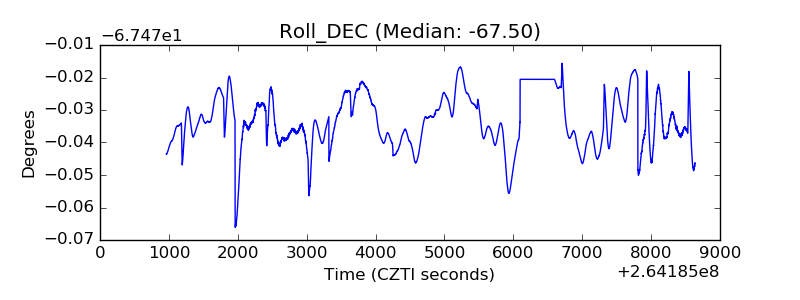 |
| _Roll_RA | 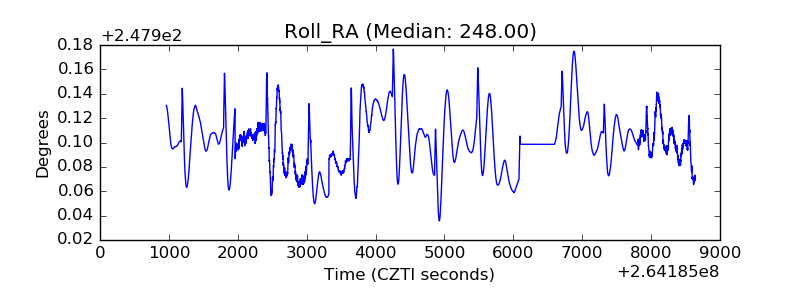 |
| Veto Counter | 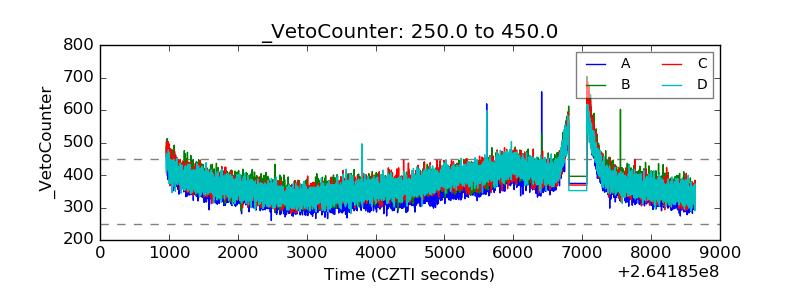 |