| Param | Original file | Final file |
|---|---|---|
| Filename | modeM0/AS1G08_084T01_9000002100_14236cztM0_level2.evt | modeM0/AS1G08_084T01_9000002100_14236cztM0_level2_quad_clean.evt |
| Size (bytes) | 214,280,640 | 42,261,120 |
| Size | 204.4 MB | 40.3 MB |
| Events in quadrant A | 1,229,371 | 286,225 |
| Events in quadrant B | 1,915,666 | 271,526 |
| Events in quadrant C | 1,423,491 | 277,051 |
| Events in quadrant D | 1,749,554 | 265,278 |
| Mode SS | |||
|---|---|---|---|
| Quadrant | BADHDUFLAG | Total packets | Discarded packets |
| A | 0 | 52 | 0 |
| B | 0 | 52 | 0 |
| C | 0 | 52 | 0 |
| D | 0 | 52 | 0 |
| Mode M0 | |||
|---|---|---|---|
| Quadrant | BADHDUFLAG | Total packets | Discarded packets |
| A | 0 | 5403 | 1 |
| B | 0 | 7405 | 1 |
| C | 0 | 5875 | 1 |
| D | 0 | 6914 | 1 |
| Mode M9 | |||
|---|---|---|---|
| Quadrant | BADHDUFLAG | Total packets | Discarded packets |
| A | 0 | 2 | 0 |
| B | 0 | 2 | 0 |
| C | 0 | 2 | 0 |
| D | 0 | 2 | 0 |
| Quadrant | Total seconds | Saturated seconds | Saturation percentage |
|---|---|---|---|
| A | 2496 | 37 | 1.482372% |
| B | 2496 | 320 | 12.820513% |
| C | 2496 | 36 | 1.442308% |
| D | 2496 | 125 | 5.008013% |
Noise dominated data is calculated using 1-second bins in cleaned event files. If a bin has >2000 counts, and if more than 50% of those come from <1% of pixels, then it is considered to be noise-dominated and hence unusable.
| Quadrant | # 1 sec bins | Bins with >0 counts | Bins with >2000 counts | High rate bins dominated by noise | Noise dominated (total time) | Noise dominated (detector-on time) | Marked lightcurve |
|---|---|---|---|---|---|---|---|
| A | 2757 | 2498 | 0 | 0 | 0.00% | 0.00% | 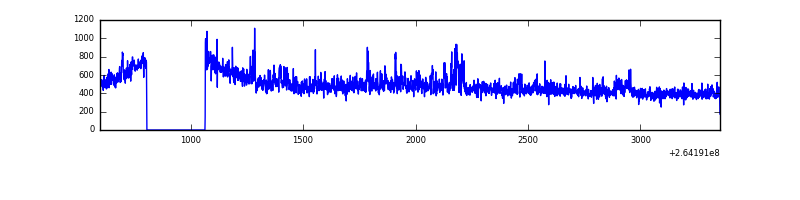 |
| B | 2757 | 2498 | 144 | 144 | 5.22% | 5.76% | 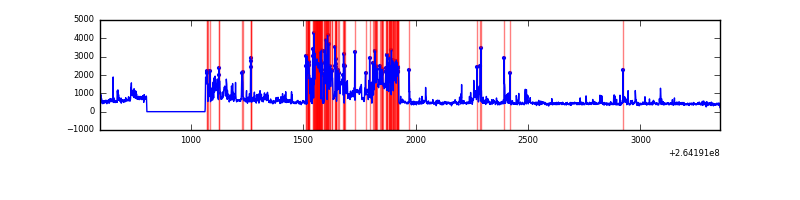 |
| C | 2757 | 2498 | 2 | 2 | 0.07% | 0.08% | 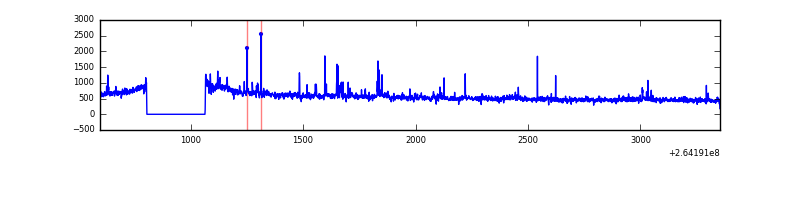 |
| D | 2757 | 2498 | 65 | 65 | 2.36% | 2.60% | 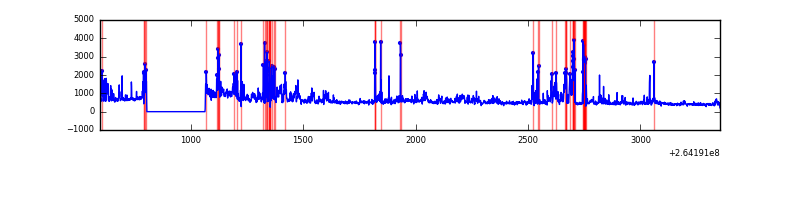 |
Top three noisy pixels from each quadrant. If the there are fewer than three noisy pixels in the level2.evt file, extra rows are filled as -1
| Pixel properties | Quadrant properties | ||||||
|---|---|---|---|---|---|---|---|
| Quadrant | DetID | PixID | Counts | Sigma | Mean | Median | Sigma |
| A | 8 | 15 | 58768 | 929.55 | 297 | 290 | 62.9 |
| A | 12 | 189 | 24852 | 390.43 | 297 | 290 | 62.9 |
| A | 0 | 226 | 2669 | 37.82 | 297 | 290 | 62.9 |
| B | 10 | 16 | 547339 | 9736.47 | 285 | 278 | 56.2 |
| B | 0 | 229 | 179625 | 3191.98 | 285 | 278 | 56.2 |
| B | 3 | 209 | 12257 | 213.2 | 285 | 278 | 56.2 |
| C | 3 | 233 | 322560 | 4874.98 | 281 | 282 | 66.1 |
| C | 14 | 234 | 3825 | 53.59 | 281 | 282 | 66.1 |
| C | 13 | 61 | 2047 | 26.7 | 281 | 282 | 66.1 |
| D | 5 | 222 | 369333 | 5444.22 | 275 | 267 | 67.8 |
| D | 1 | 52 | 183326 | 2700.36 | 275 | 267 | 67.8 |
| D | 8 | 195 | 41318 | 605.56 | 275 | 267 | 67.8 |
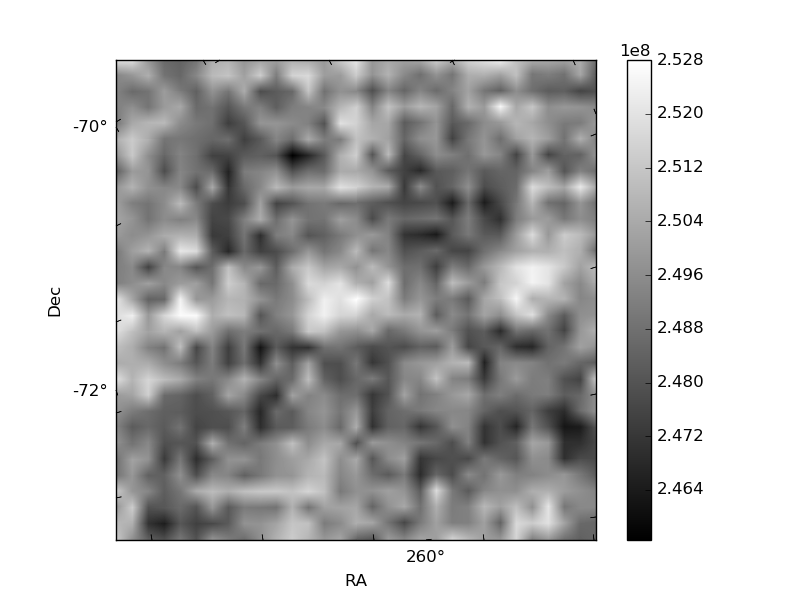
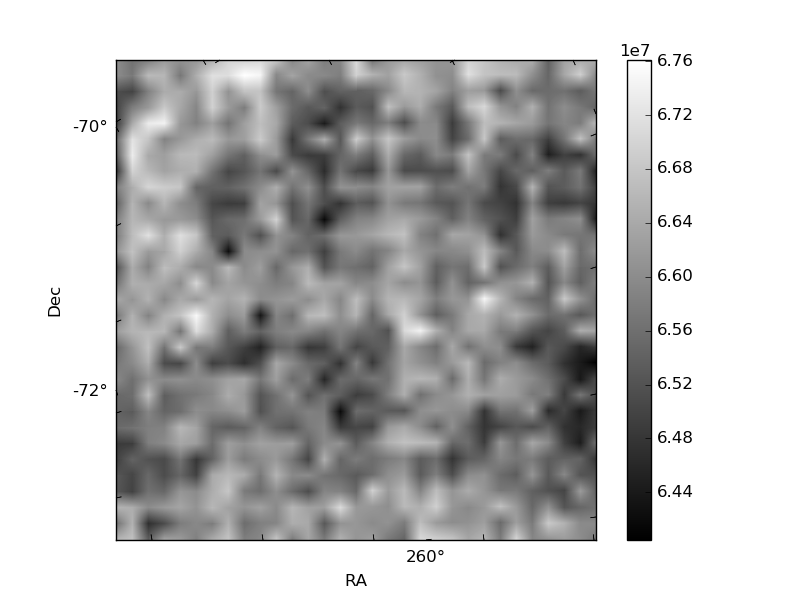
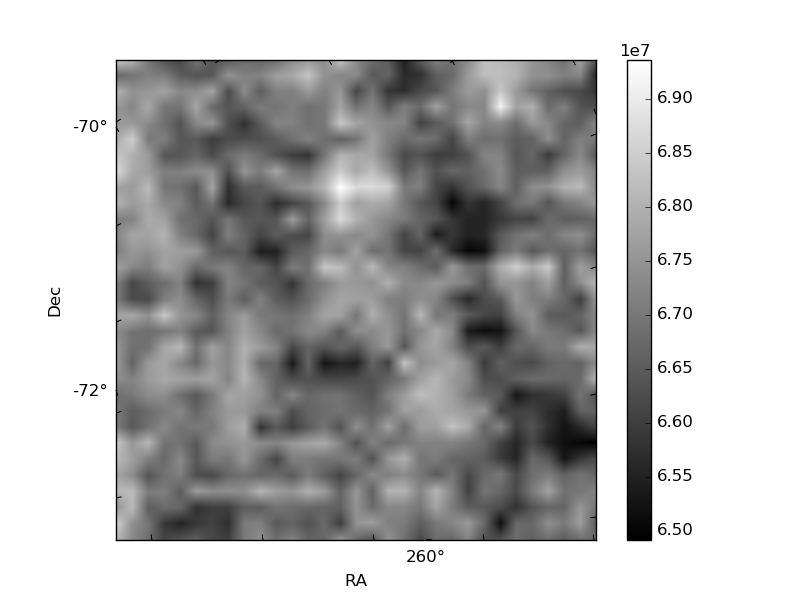
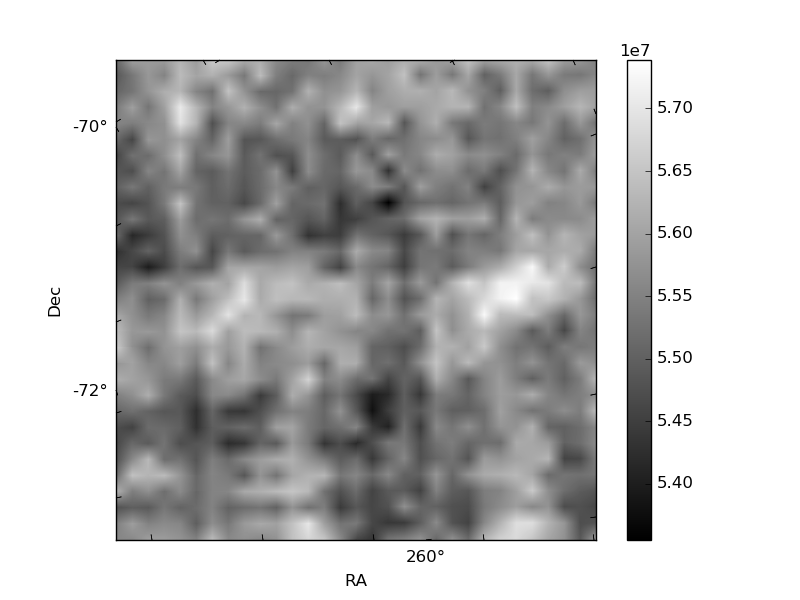
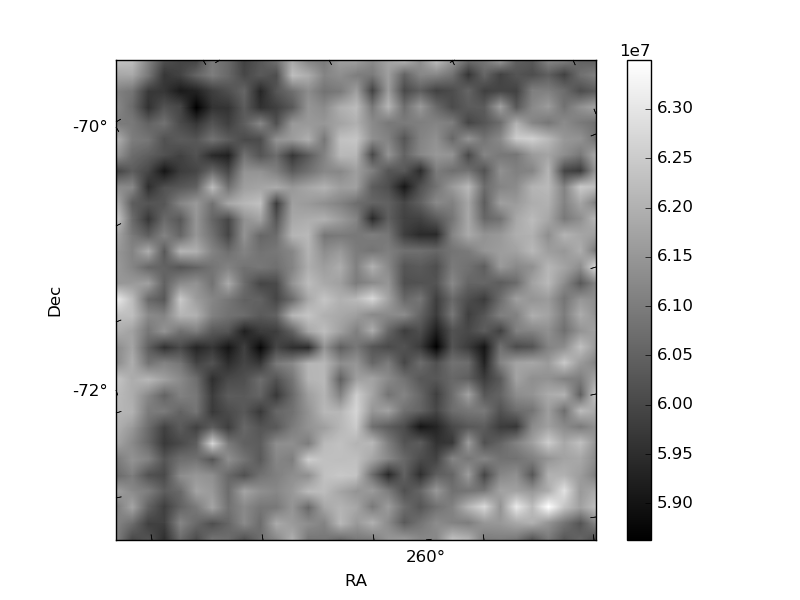
Histogram calculated using DETX and DETY for each event in the final _common_clean file
| Quadrant A | 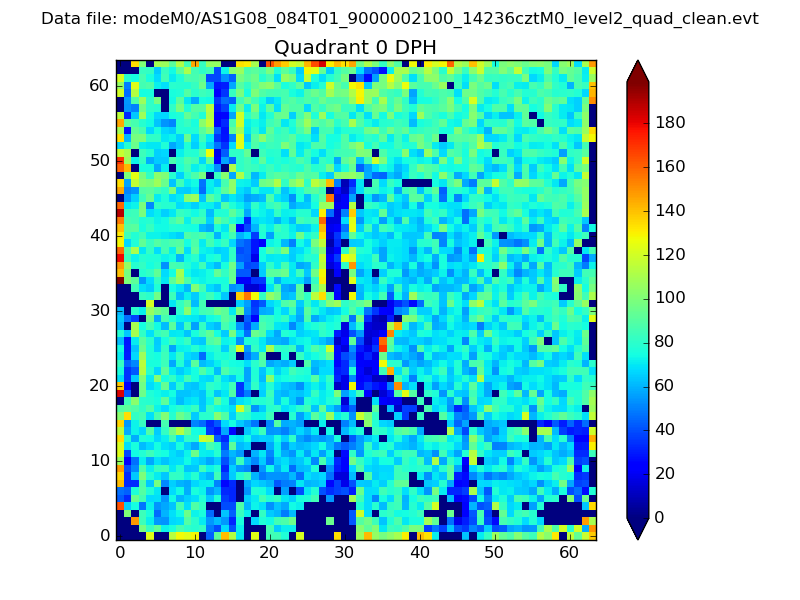 |
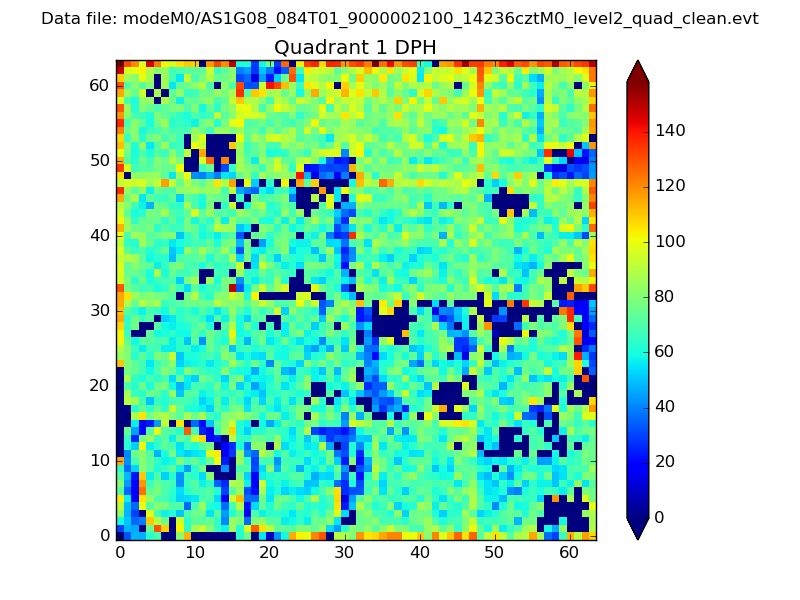 |
Quadrant B |
|---|---|---|---|
| Quadrant D | 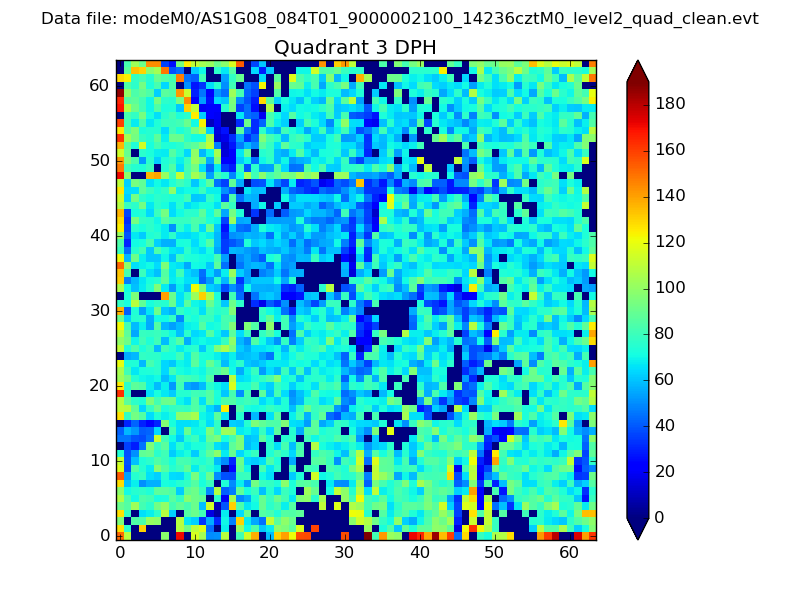 |
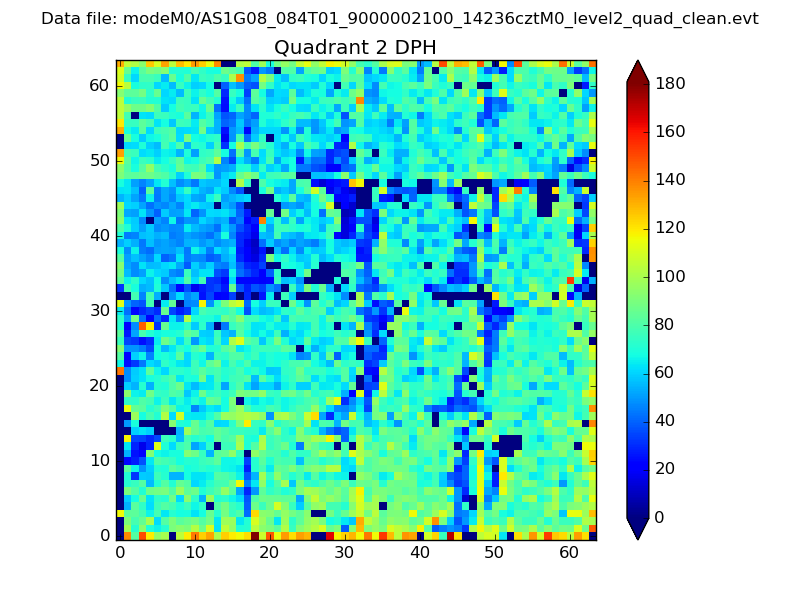 |
Quadrant C |
| Plot type | Count rate plots | Images |
|---|---|---|
| Comparison with Poisson distribution Blue bars denote a histogram of data divided into 1 sec bins. Red curve is a Poisson curve with rate = median count rate of data. |
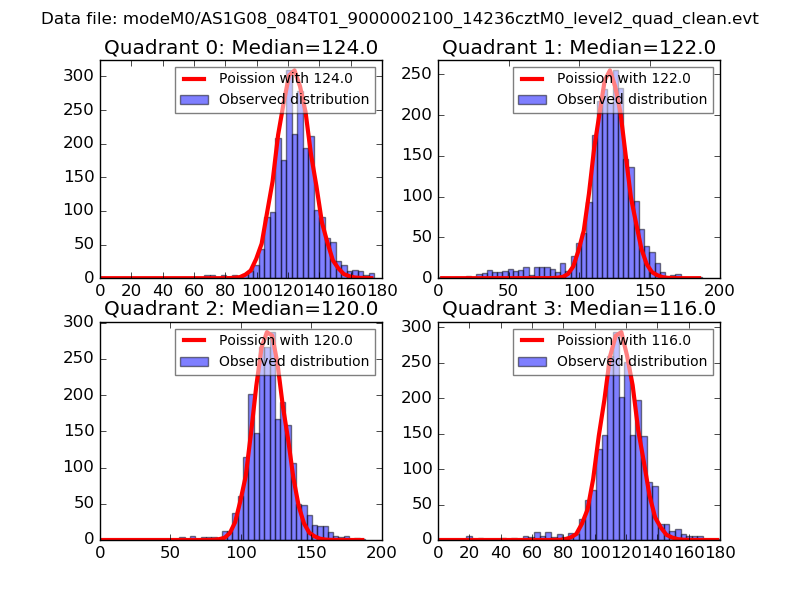 |
 |
| Quadrant-wise count rates Data is divided into 100 sec bins |
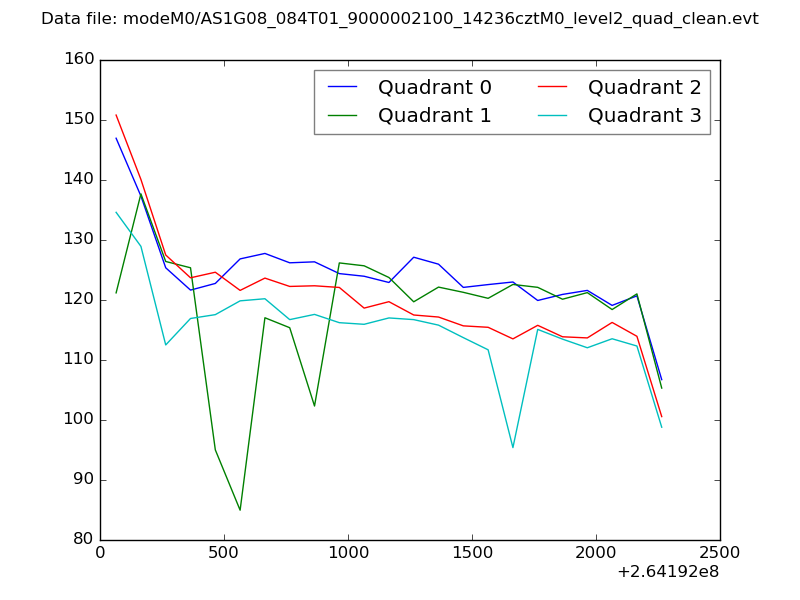 |
|
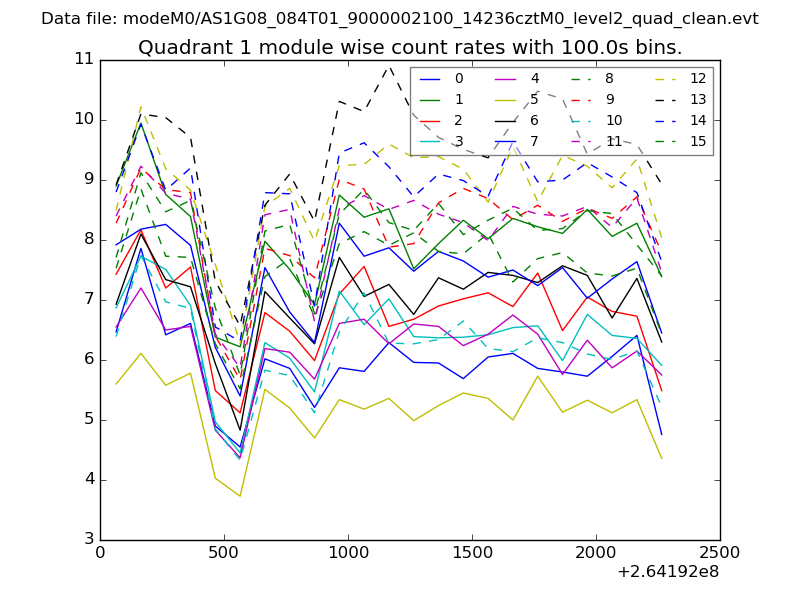
| Module-wise count rates for Quadrant A Data is divided into 100 sec bins |
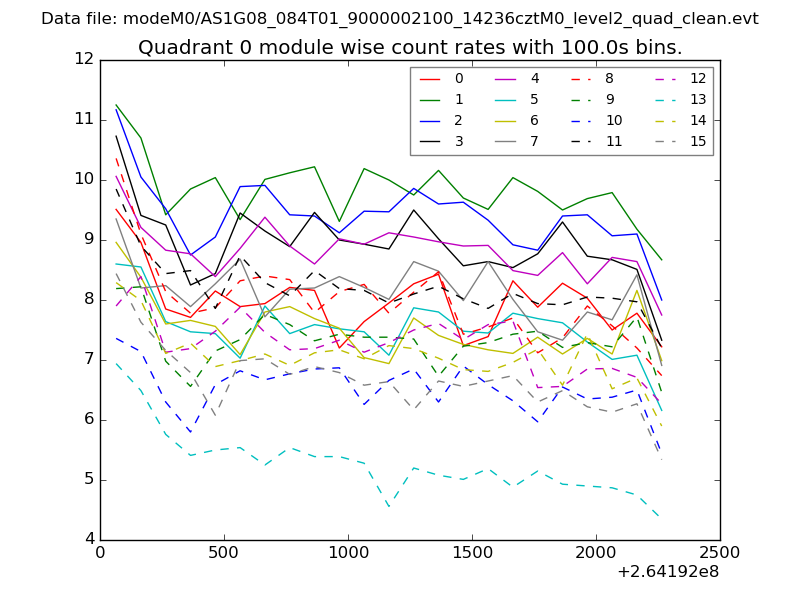 |
 |
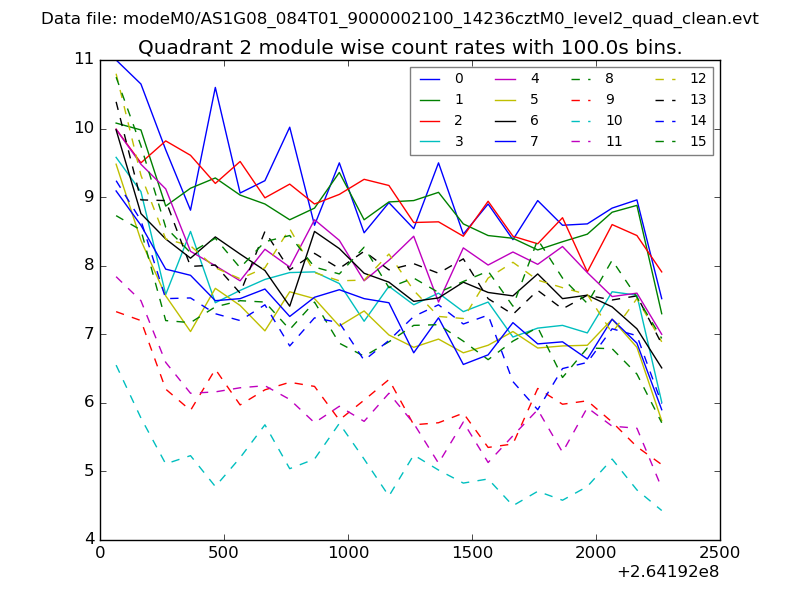
| Module-wise count rates for Quadrant B Data is divided into 100 sec bins |
 |
 |
| Module-wise count rates for Quadrant C Data is divided into 100 sec bins |
 |
 |
| Module-wise count rates for Quadrant D Data is divided into 100 sec bins |
 |
 |
| Parameter | Plot |
|---|---|
| CZT HV Monitor | 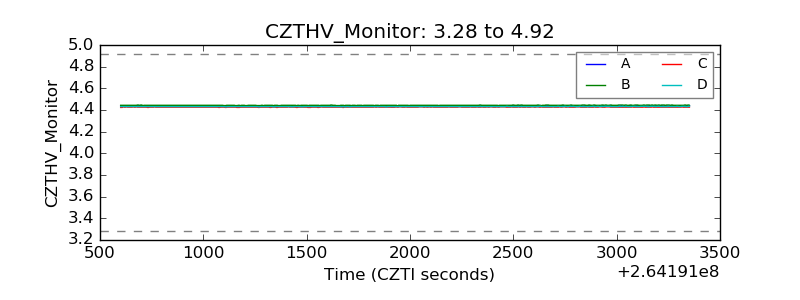 |
| D_VDD | 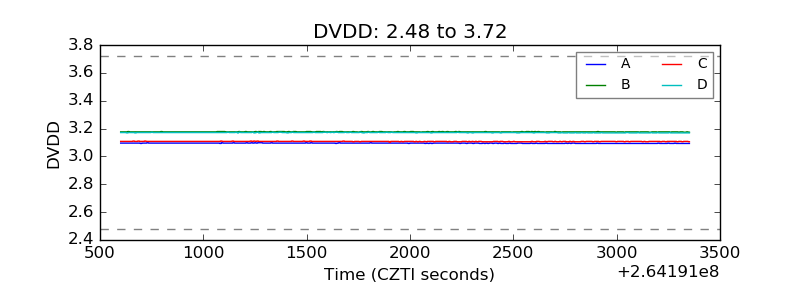 |
| Temperature 1 | 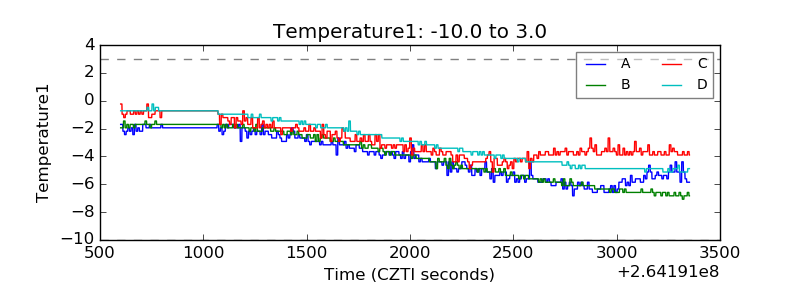 |
| Veto HV Monitor | 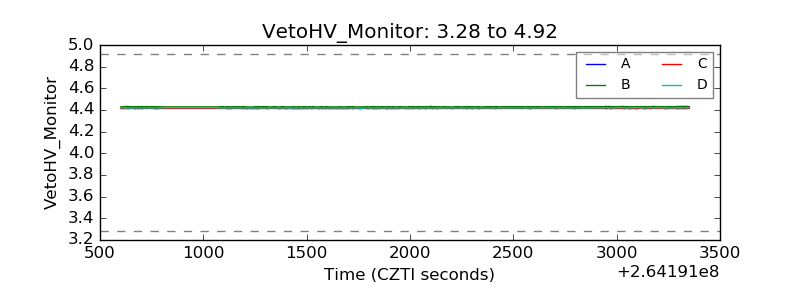 |
| Veto LLD | 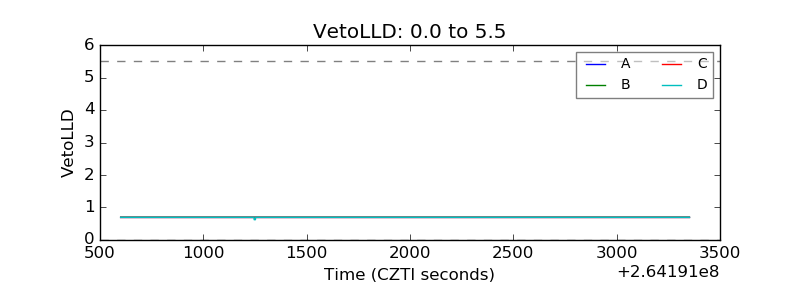 |
| Alpha Counter | 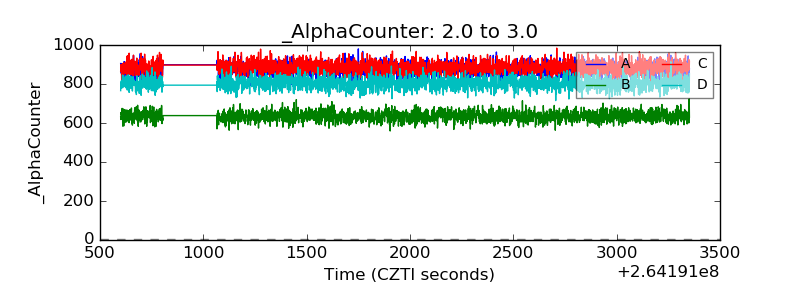 |
| _CPM_Rate | 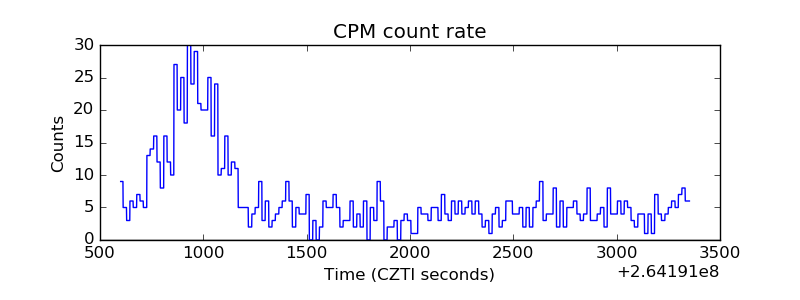 |
| CZT Counter | 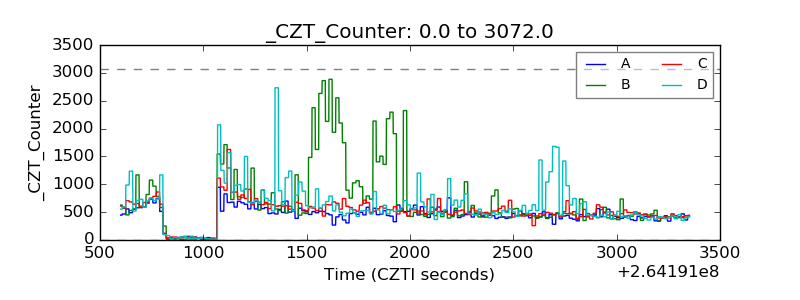 |
| +2.5 Volts monitor |  |
| +5 Volts monitor |  |
| _ROLL_ROT | 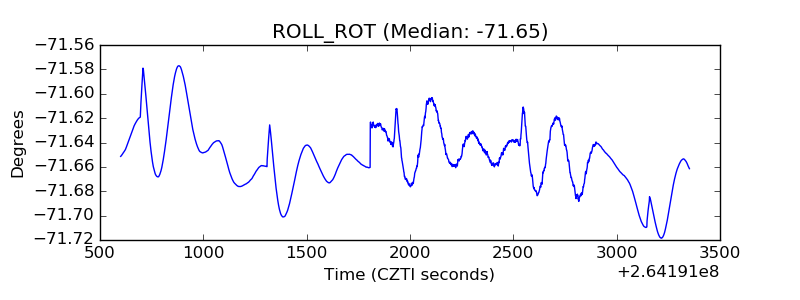 |
| _Roll_DEC | 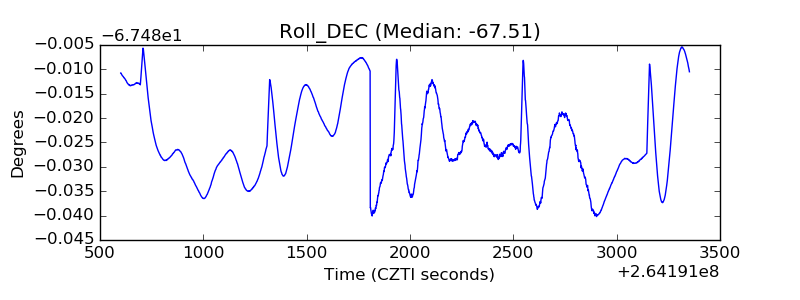 |
| _Roll_RA | 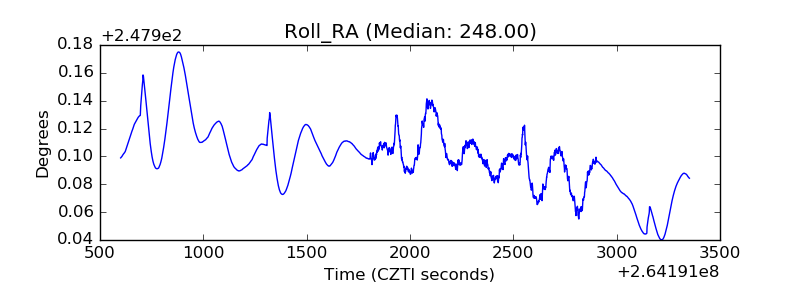 |
| Veto Counter | 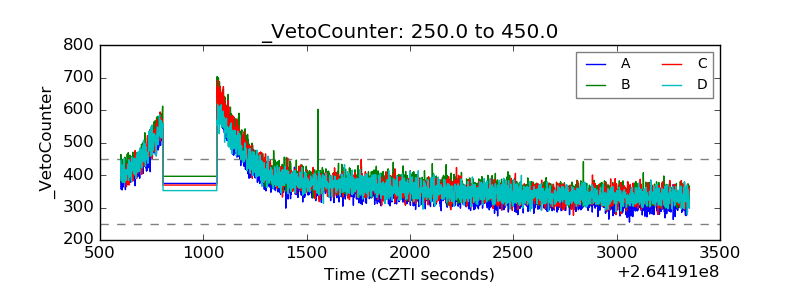 |