| Param | Original file | Final file |
|---|---|---|
| Filename | modeM0/AS1G08_069T01_9000002102_14236cztM0_level2.evt | modeM0/AS1G08_069T01_9000002102_14236cztM0_level2_quad_clean.evt |
| Size (bytes) | 499,777,920 | 82,080,000 |
| Size | 476.6 MB | 78.3 MB |
| Events in quadrant A | 2,857,009 | 548,661 |
| Events in quadrant B | 2,990,915 | 534,899 |
| Events in quadrant C | 2,989,276 | 512,616 |
| Events in quadrant D | 5,878,273 | 456,991 |
| Mode SS | |||
|---|---|---|---|
| Quadrant | BADHDUFLAG | Total packets | Discarded packets |
| A | 0 | 126 | 0 |
| B | 0 | 126 | 0 |
| C | 0 | 126 | 0 |
| D | 0 | 126 | 0 |
| Mode M0 | |||
|---|---|---|---|
| Quadrant | BADHDUFLAG | Total packets | Discarded packets |
| A | 0 | 12657 | 2 |
| B | 0 | 13073 | 1 |
| C | 0 | 12802 | 1 |
| D | 0 | 21600 | 1 |
| Mode M9 | |||
|---|---|---|---|
| Quadrant | BADHDUFLAG | Total packets | Discarded packets |
| A | 0 | 5 | 0 |
| B | 0 | 5 | 0 |
| C | 0 | 5 | 0 |
| D | 0 | 5 | 0 |
| Quadrant | Total seconds | Saturated seconds | Saturation percentage |
|---|---|---|---|
| A | 6190 | 10 | 0.161551% |
| B | 6190 | 26 | 0.420032% |
| C | 6190 | 9 | 0.145396% |
| D | 6190 | 981 | 15.848142% |
Noise dominated data is calculated using 1-second bins in cleaned event files. If a bin has >2000 counts, and if more than 50% of those come from <1% of pixels, then it is considered to be noise-dominated and hence unusable.
| Quadrant | # 1 sec bins | Bins with >0 counts | Bins with >2000 counts | High rate bins dominated by noise | Noise dominated (total time) | Noise dominated (detector-on time) | Marked lightcurve |
|---|---|---|---|---|---|---|---|
| A | 6661 | 6192 | 0 | 0 | 0.00% | 0.00% | 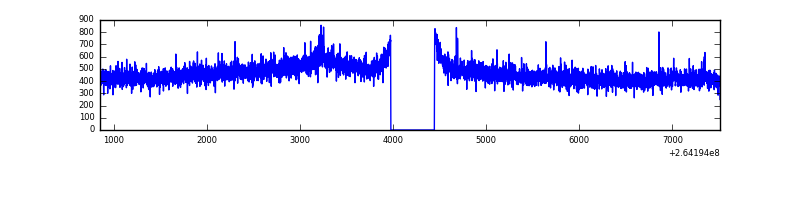 |
| B | 6661 | 6192 | 1 | 1 | 0.02% | 0.02% | 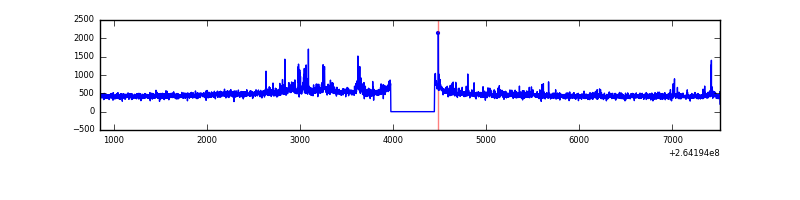 |
| C | 6661 | 6192 | 2 | 2 | 0.03% | 0.03% | 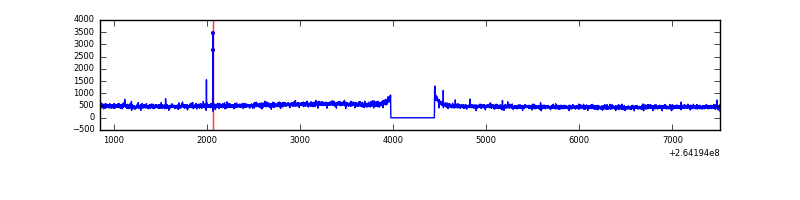 |
| D | 6661 | 6192 | 849 | 849 | 12.75% | 13.71% | 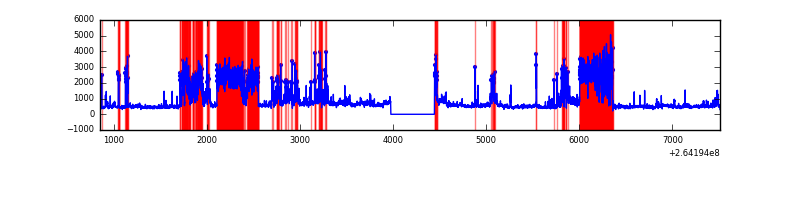 |
Top three noisy pixels from each quadrant. If the there are fewer than three noisy pixels in the level2.evt file, extra rows are filled as -1
| Pixel properties | Quadrant properties | ||||||
|---|---|---|---|---|---|---|---|
| Quadrant | DetID | PixID | Counts | Sigma | Mean | Median | Sigma |
| A | 12 | 189 | 21393 | 138.28 | 731 | 715 | 149.5 |
| A | 8 | 15 | 18930 | 121.81 | 731 | 715 | 149.5 |
| A | 0 | 226 | 6394 | 37.97 | 731 | 715 | 149.5 |
| B | 0 | 229 | 66994 | 466.09 | 727 | 706 | 142.2 |
| B | 4 | 97 | 30902 | 212.32 | 727 | 706 | 142.2 |
| B | 0 | 189 | 30461 | 209.22 | 727 | 706 | 142.2 |
| C | 3 | 233 | 226136 | 1372.77 | 706 | 710 | 164.2 |
| C | 14 | 234 | 9848 | 55.65 | 706 | 710 | 164.2 |
| C | 13 | 61 | 4968 | 25.93 | 706 | 710 | 164.2 |
| D | 12 | 110 | 1301754 | 7812.73 | 653 | 635 | 166.5 |
| D | 5 | 222 | 1147483 | 6886.39 | 653 | 635 | 166.5 |
| D | 1 | 52 | 386996 | 2319.95 | 653 | 635 | 166.5 |
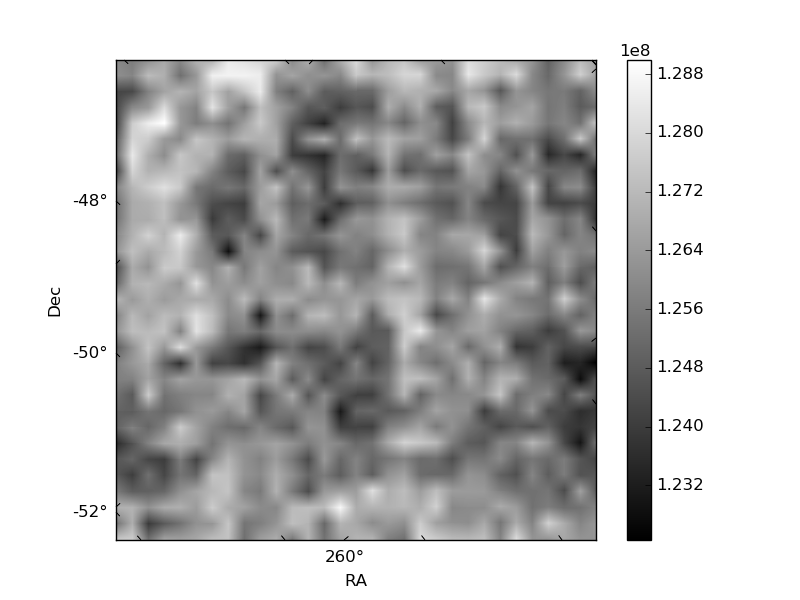
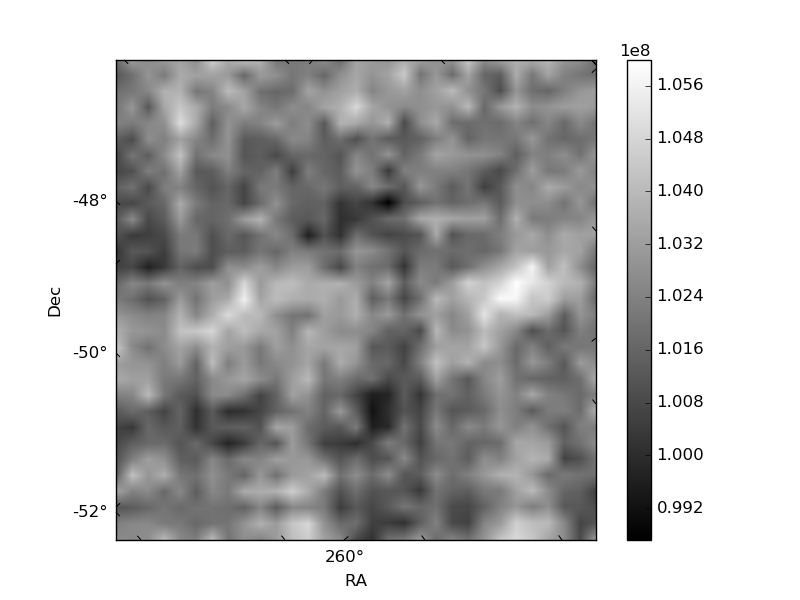
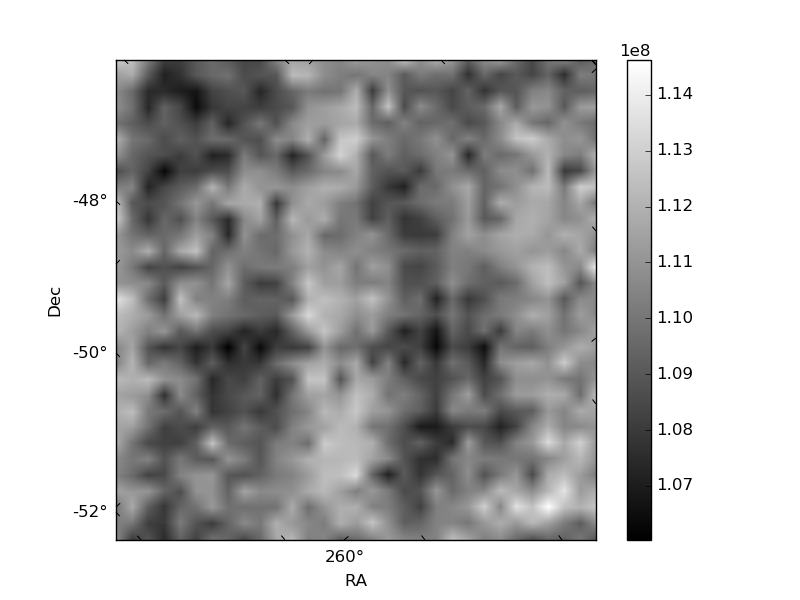
Histogram calculated using DETX and DETY for each event in the final _common_clean file
| Quadrant A | 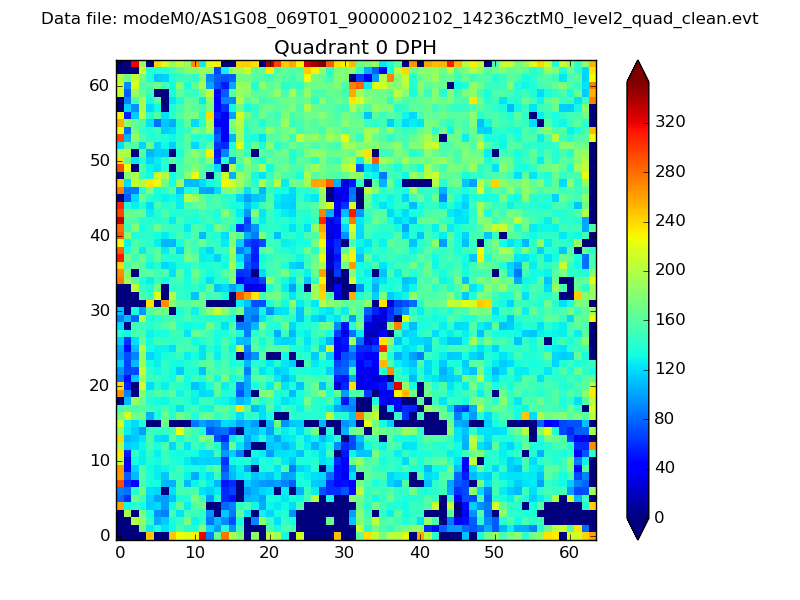 |
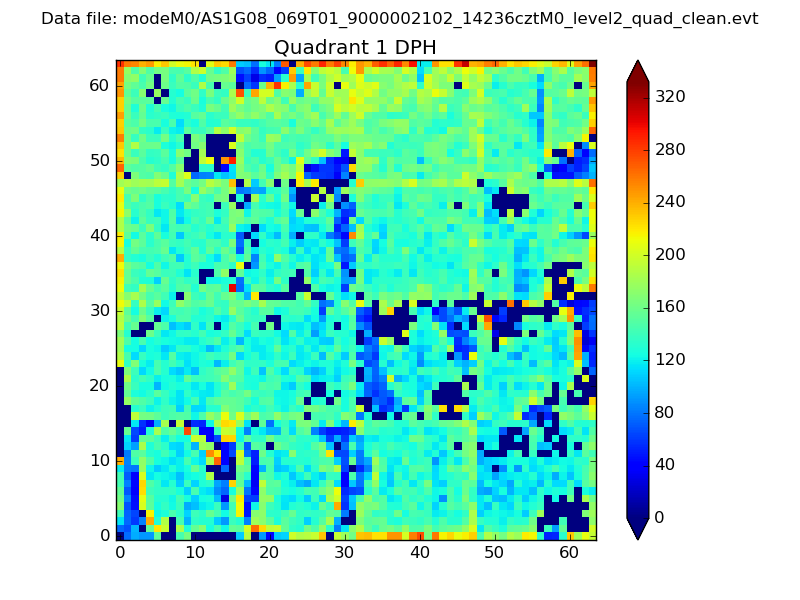 |
Quadrant B |
|---|---|---|---|
| Quadrant D | 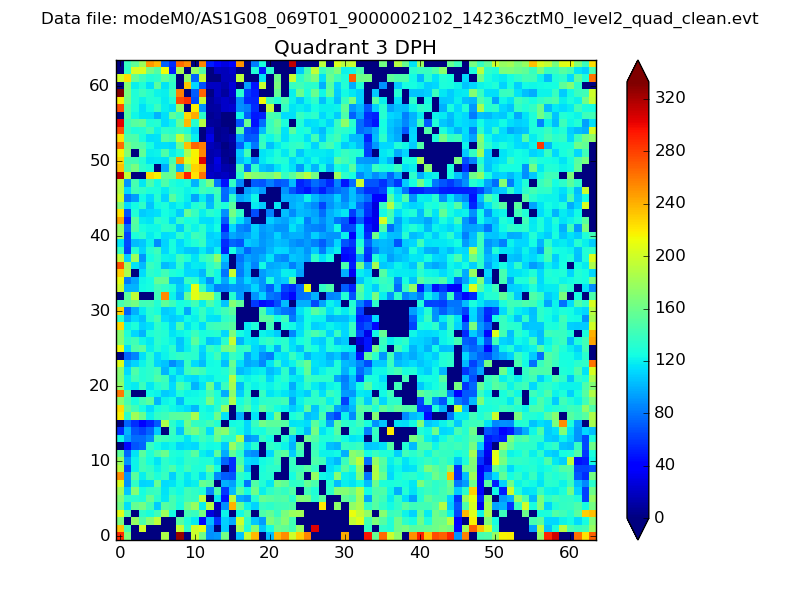 |
 |
Quadrant C |
| Plot type | Count rate plots | Images |
|---|---|---|
| Comparison with Poisson distribution Blue bars denote a histogram of data divided into 1 sec bins. Red curve is a Poisson curve with rate = median count rate of data. |
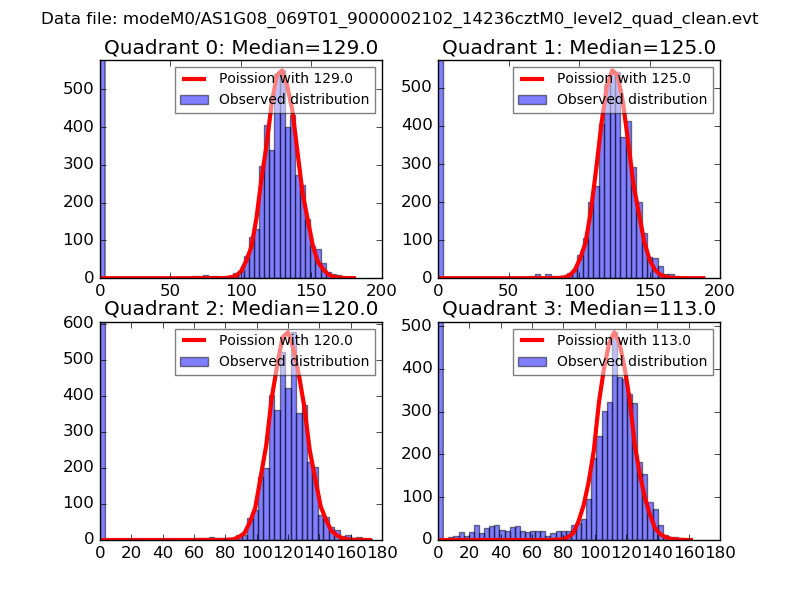 |
 |
| Quadrant-wise count rates Data is divided into 100 sec bins |
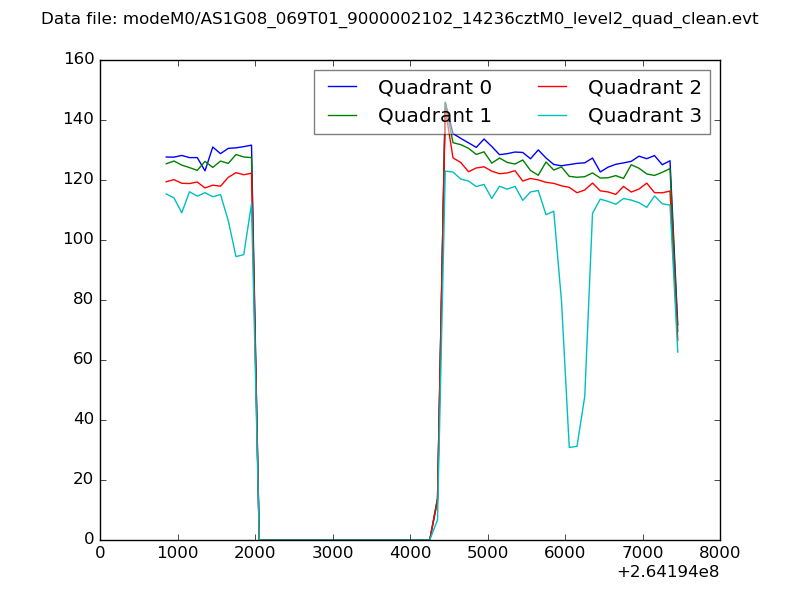 |
|
| Module-wise count rates for Quadrant A Data is divided into 100 sec bins |
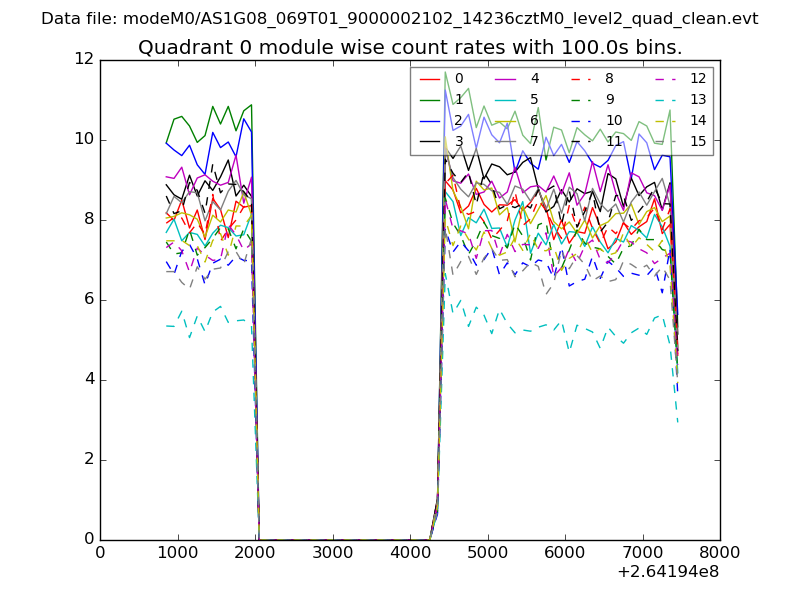 |
 |
| Module-wise count rates for Quadrant B Data is divided into 100 sec bins |
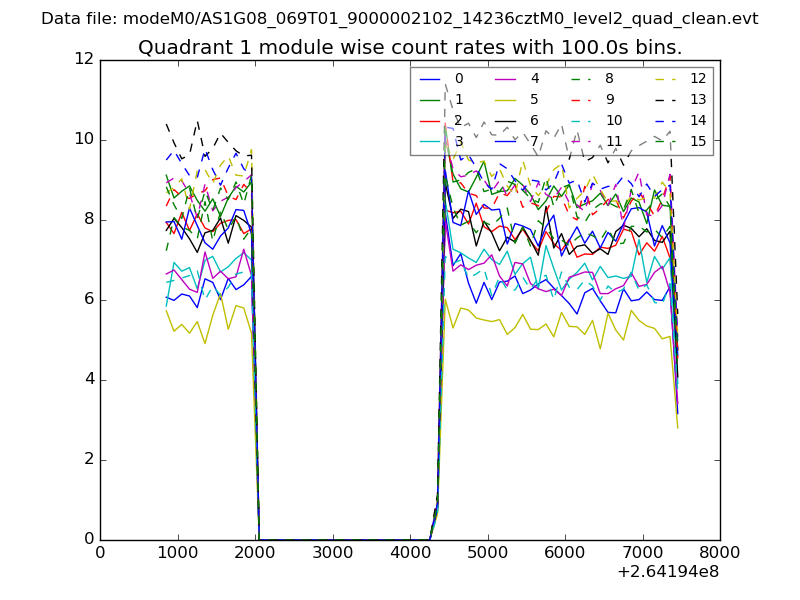 |
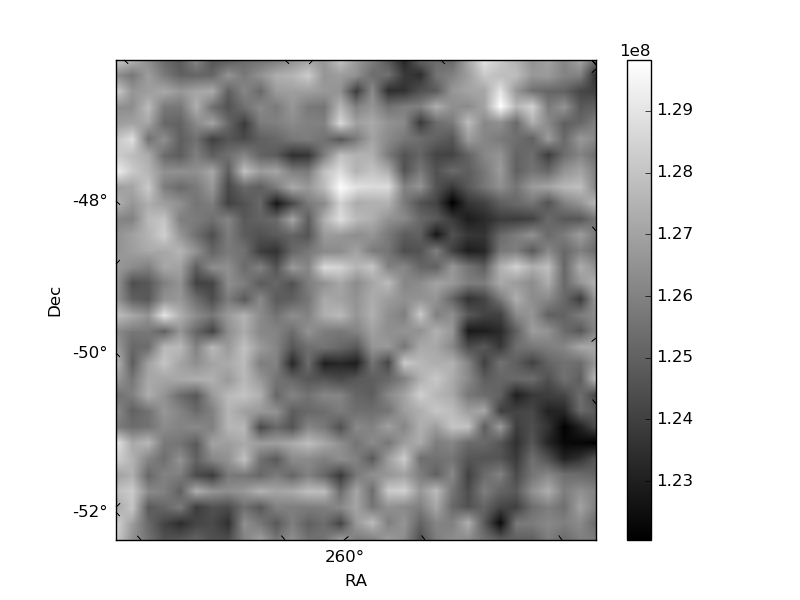 |
| Module-wise count rates for Quadrant C Data is divided into 100 sec bins |
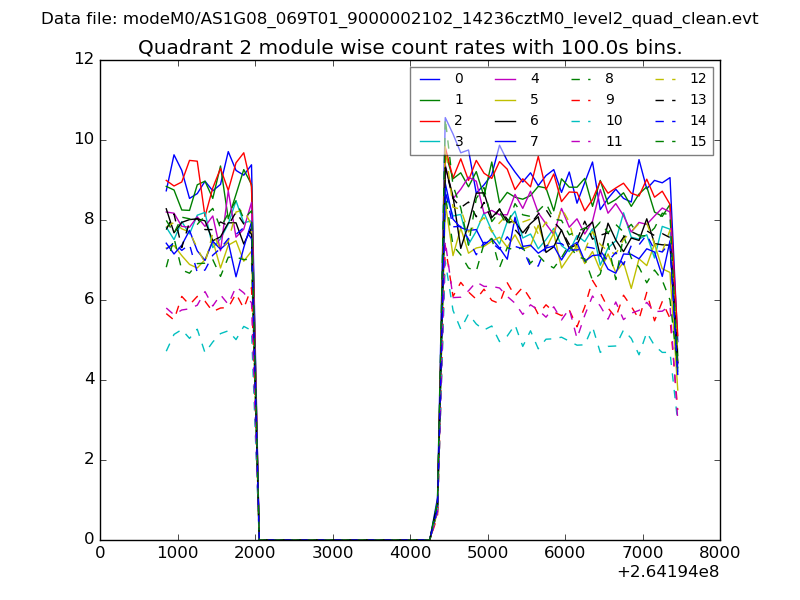 |
 |
| Module-wise count rates for Quadrant D Data is divided into 100 sec bins |
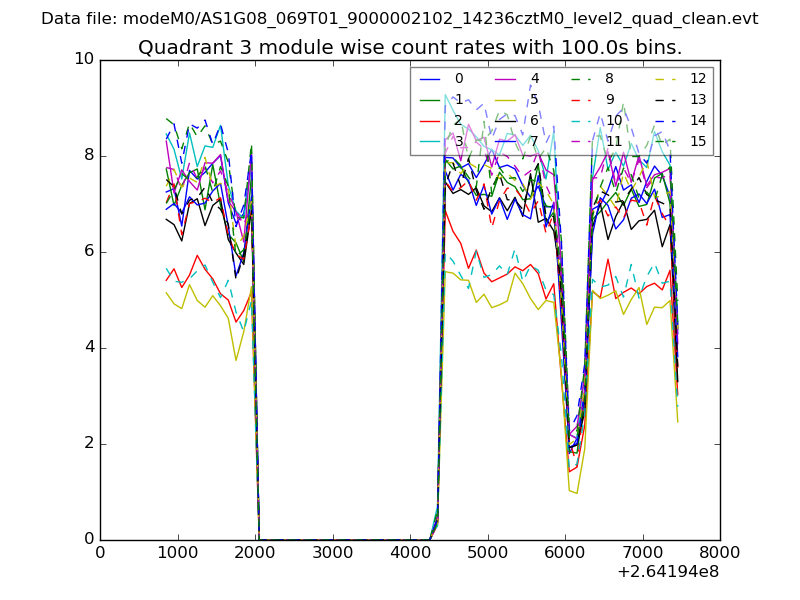 |
 |
| Parameter | Plot |
|---|---|
| CZT HV Monitor | 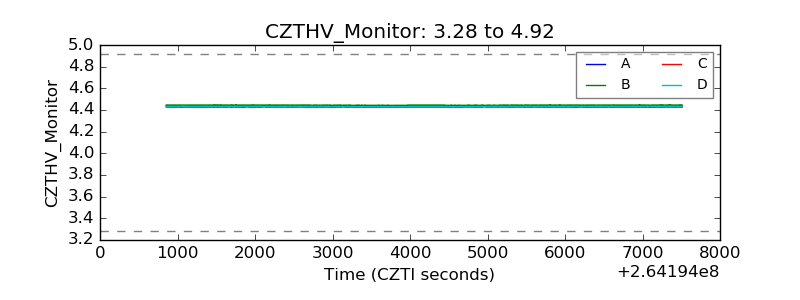 |
| D_VDD | 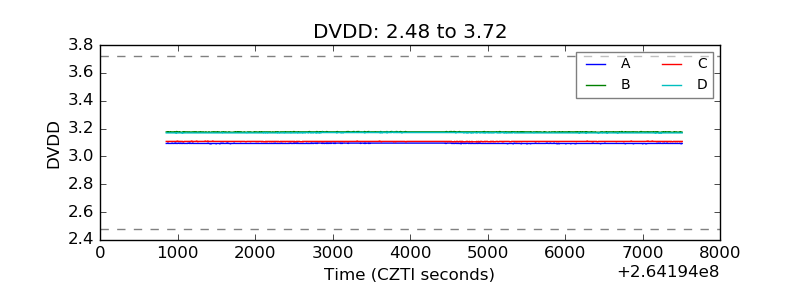 |
| Temperature 1 | 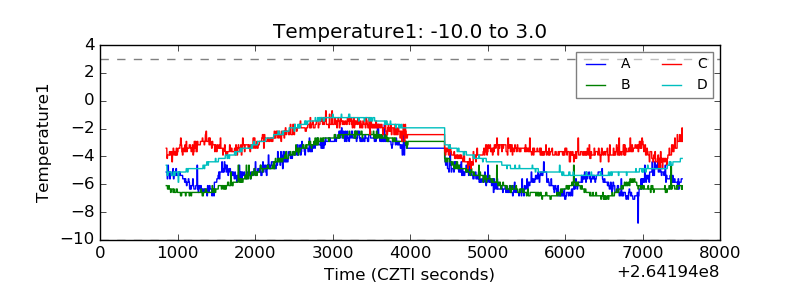 |
| Veto HV Monitor | 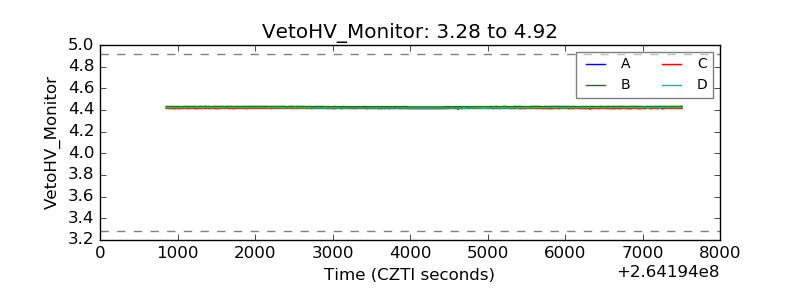 |
| Veto LLD | 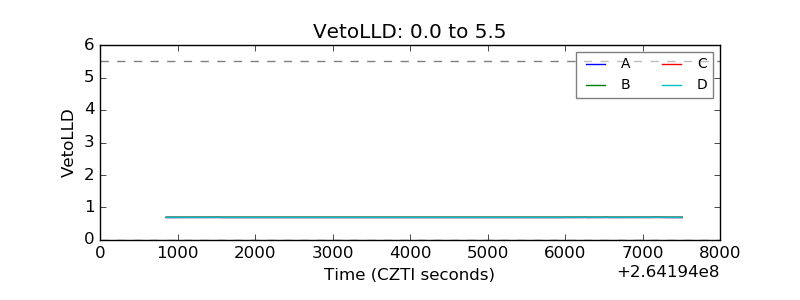 |
| Alpha Counter | 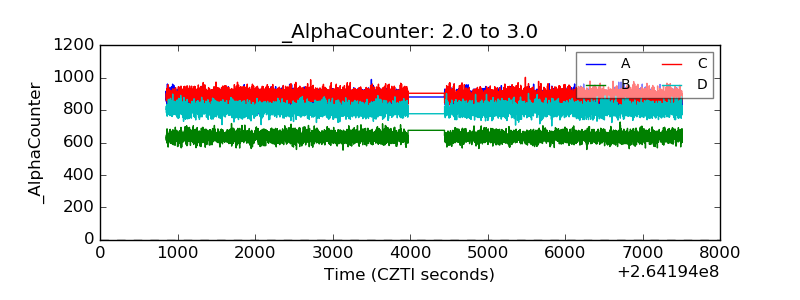 |
| _CPM_Rate | 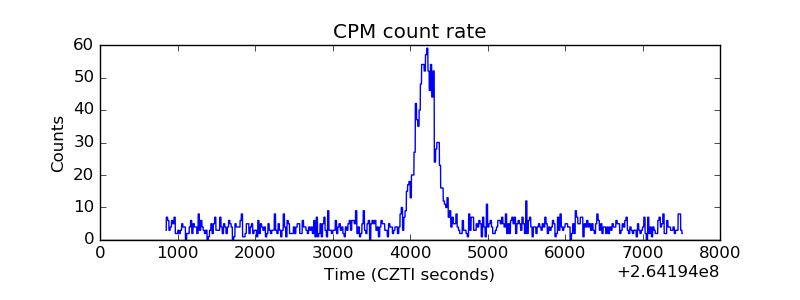 |
| CZT Counter |  |
| +2.5 Volts monitor | 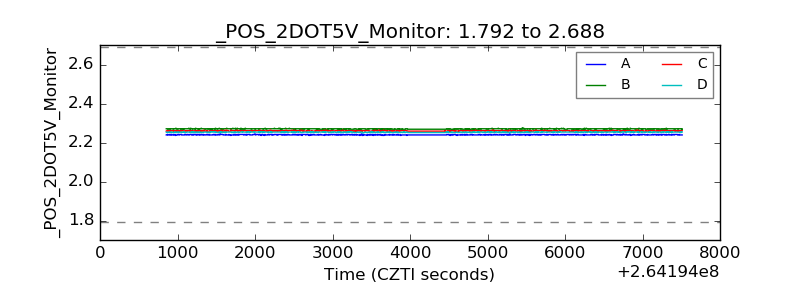 |
| +5 Volts monitor |  |
| _ROLL_ROT | 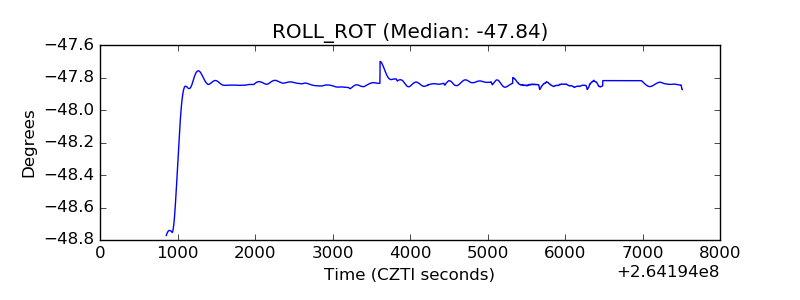 |
| _Roll_DEC | 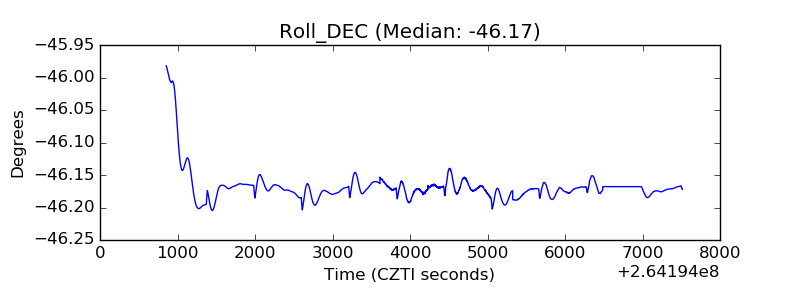 |
| _Roll_RA | 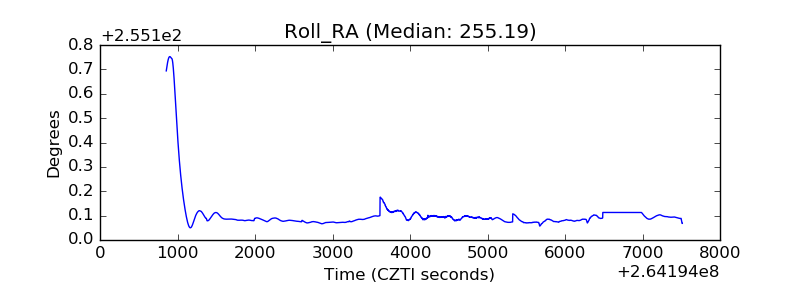 |
| Veto Counter | 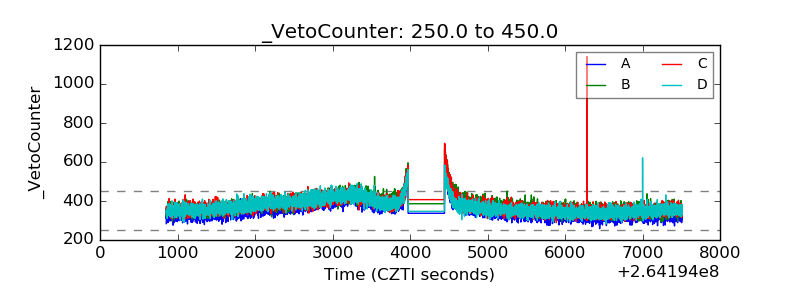 |