| Param | Original file | Final file |
|---|---|---|
| Filename | modeM0/AS1G08_069T01_9000002102_14237cztM0_level2.evt | modeM0/AS1G08_069T01_9000002102_14237cztM0_level2_quad_clean.evt |
| Size (bytes) | 1,172,744,640 | 192,121,920 |
| Size | 1.1 GB | 183.2 MB |
| Events in quadrant A | 7,688,273 | 1,234,576 |
| Events in quadrant B | 8,021,975 | 1,211,242 |
| Events in quadrant C | 7,706,135 | 1,171,450 |
| Events in quadrant D | 11,044,575 | 1,123,212 |
| Mode SS | |||
|---|---|---|---|
| Quadrant | BADHDUFLAG | Total packets | Discarded packets |
| A | 0 | 320 | 0 |
| B | 0 | 320 | 0 |
| C | 0 | 320 | 0 |
| D | 0 | 320 | 0 |
| Mode M0 | |||
|---|---|---|---|
| Quadrant | BADHDUFLAG | Total packets | Discarded packets |
| A | 0 | 32673 | 4 |
| B | 0 | 33883 | 3 |
| C | 0 | 32040 | 3 |
| D | 0 | 43015 | 3 |
| Mode M9 | |||
|---|---|---|---|
| Quadrant | BADHDUFLAG | Total packets | Discarded packets |
| A | 0 | 23 | 0 |
| B | 0 | 23 | 0 |
| C | 0 | 23 | 0 |
| D | 0 | 23 | 0 |
| Quadrant | Total seconds | Saturated seconds | Saturation percentage |
|---|---|---|---|
| A | 15625 | 55 | 0.352000% |
| B | 15625 | 151 | 0.966400% |
| C | 15625 | 35 | 0.224000% |
| D | 15625 | 464 | 2.969600% |
Noise dominated data is calculated using 1-second bins in cleaned event files. If a bin has >2000 counts, and if more than 50% of those come from <1% of pixels, then it is considered to be noise-dominated and hence unusable.
| Quadrant | # 1 sec bins | Bins with >0 counts | Bins with >2000 counts | High rate bins dominated by noise | Noise dominated (total time) | Noise dominated (detector-on time) | Marked lightcurve |
|---|---|---|---|---|---|---|---|
| A | 17936 | 15629 | 8 | 8 | 0.04% | 0.05% | 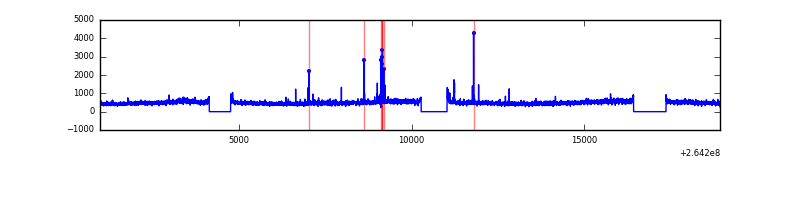 |
| B | 17936 | 15629 | 40 | 40 | 0.22% | 0.26% | 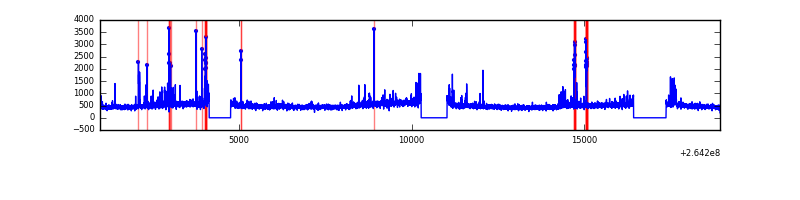 |
| C | 17936 | 15629 | 0 | 0 | 0.00% | 0.00% | 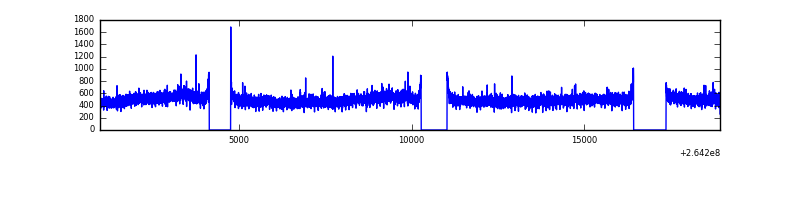 |
| D | 17936 | 15629 | 331 | 331 | 1.85% | 2.12% | 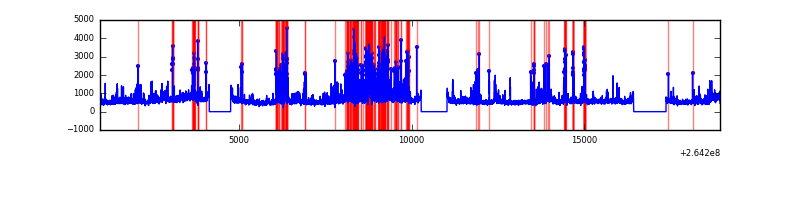 |
Top three noisy pixels from each quadrant. If the there are fewer than three noisy pixels in the level2.evt file, extra rows are filled as -1
| Pixel properties | Quadrant properties | ||||||
|---|---|---|---|---|---|---|---|
| Quadrant | DetID | PixID | Counts | Sigma | Mean | Median | Sigma |
| A | 8 | 15 | 267184 | 703.39 | 1874 | 1832 | 377.2 |
| A | 12 | 189 | 111303 | 290.18 | 1874 | 1832 | 377.2 |
| A | 9 | 143 | 61369 | 157.82 | 1874 | 1832 | 377.2 |
| B | 0 | 229 | 312525 | 880.28 | 1859 | 1810 | 353.0 |
| B | 5 | 175 | 166367 | 466.2 | 1859 | 1810 | 353.0 |
| B | 0 | 189 | 79125 | 219.04 | 1859 | 1810 | 353.0 |
| C | 3 | 233 | 593450 | 1406.23 | 1823 | 1831 | 420.7 |
| C | 13 | 61 | 13083 | 26.75 | 1823 | 1831 | 420.7 |
| C | 14 | 234 | 9895 | 19.17 | 1823 | 1831 | 420.7 |
| D | 8 | 195 | 1282571 | 2967.11 | 1789 | 1747 | 431.7 |
| D | 1 | 52 | 1247157 | 2885.07 | 1789 | 1747 | 431.7 |
| D | 5 | 222 | 704334 | 1627.59 | 1789 | 1747 | 431.7 |
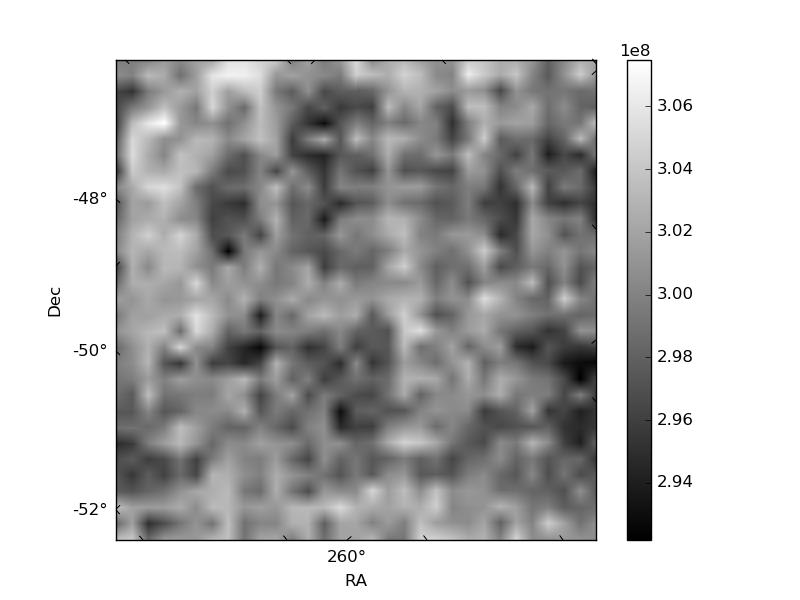
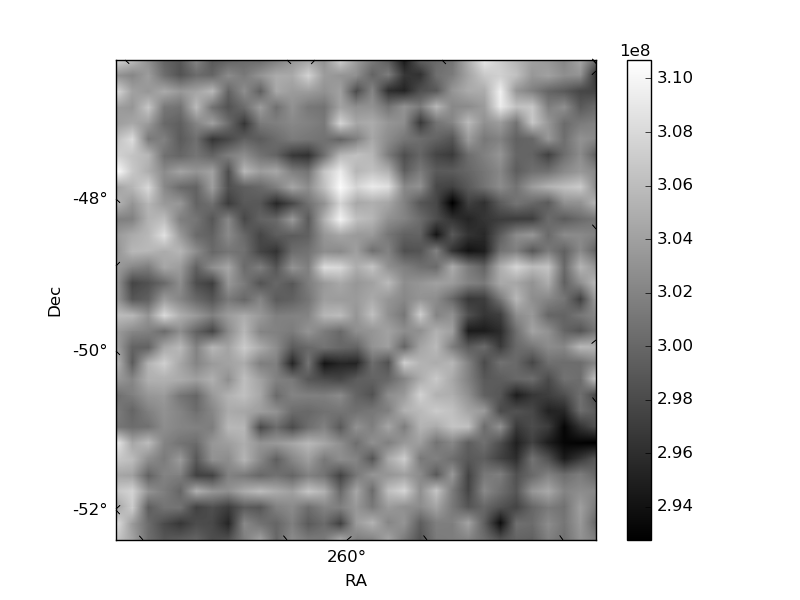
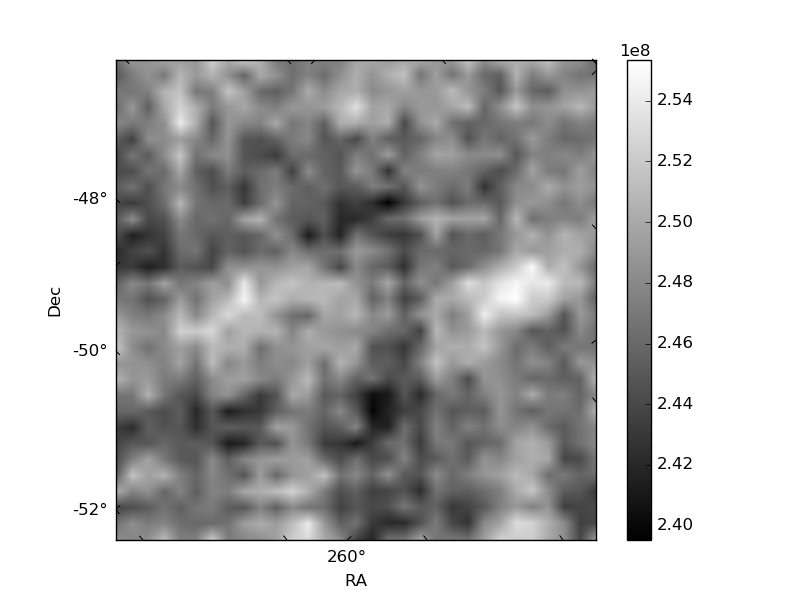
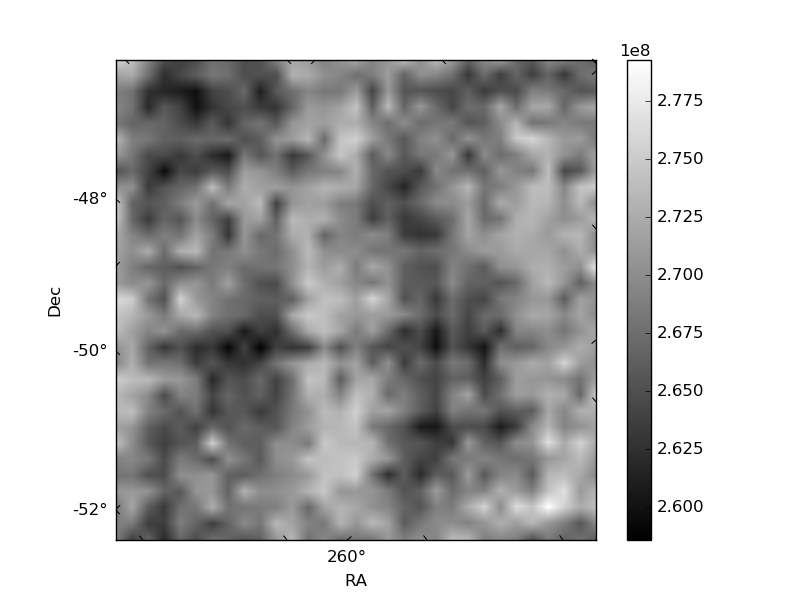
Histogram calculated using DETX and DETY for each event in the final _common_clean file
| Quadrant A | 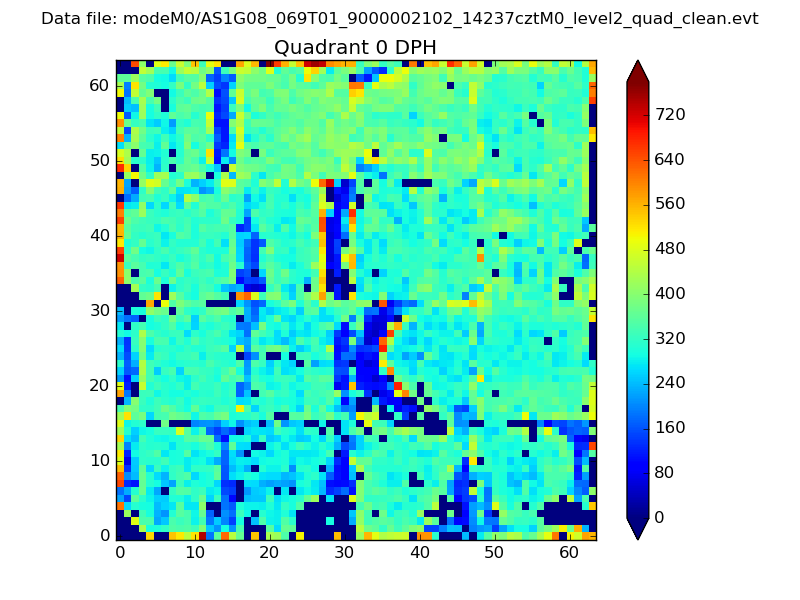 |
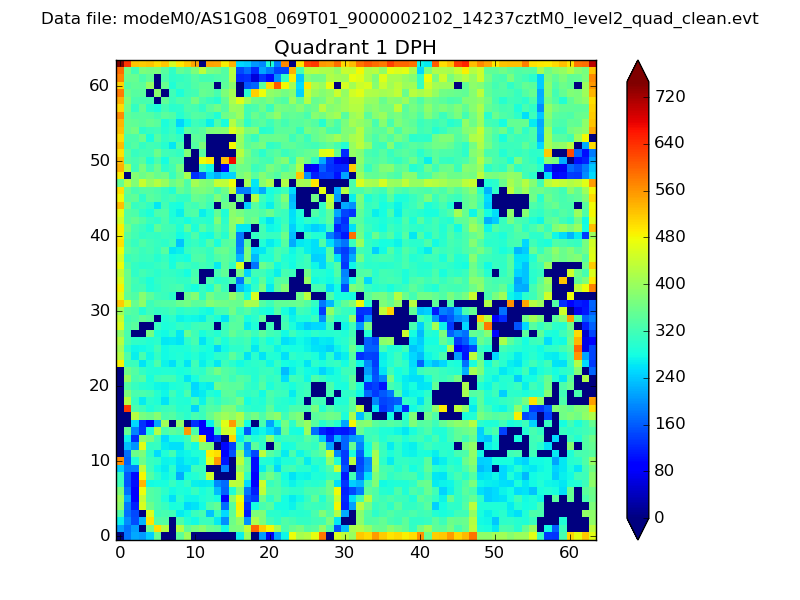 |
Quadrant B |
|---|---|---|---|
| Quadrant D | 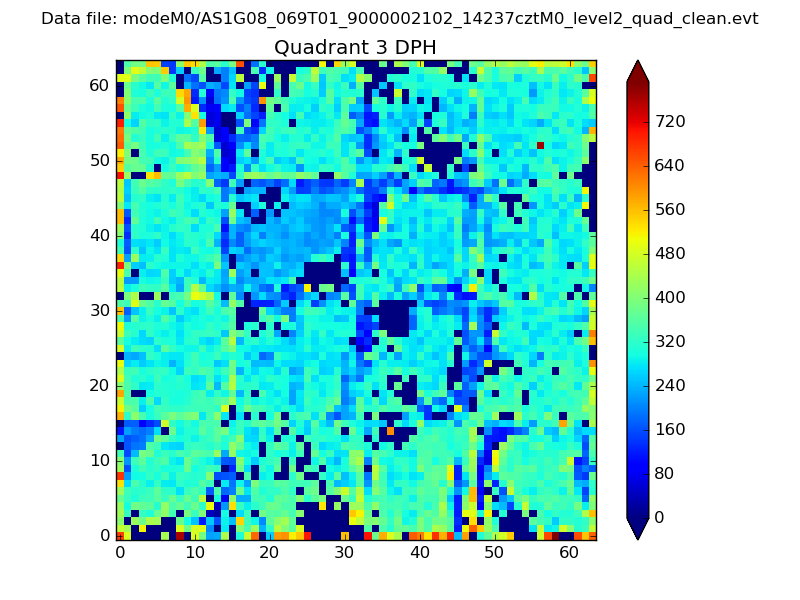 |
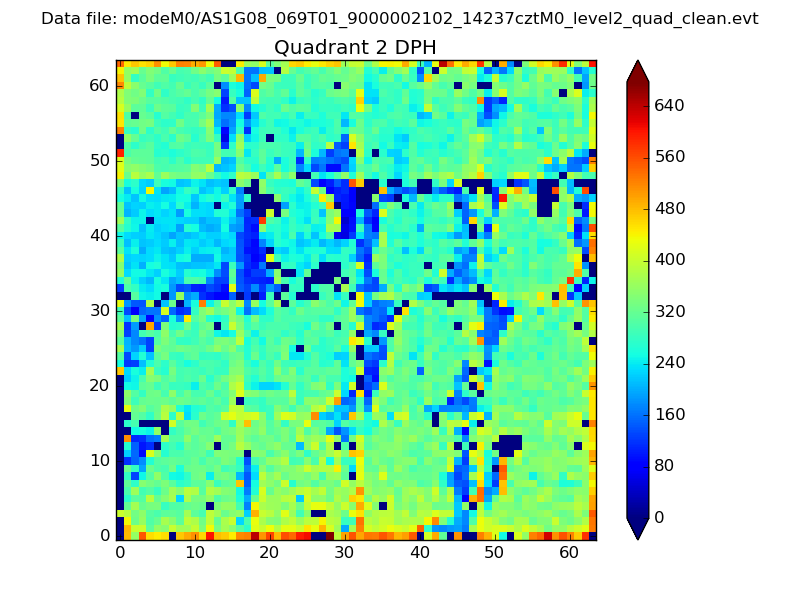 |
Quadrant C |
| Plot type | Count rate plots | Images |
|---|---|---|
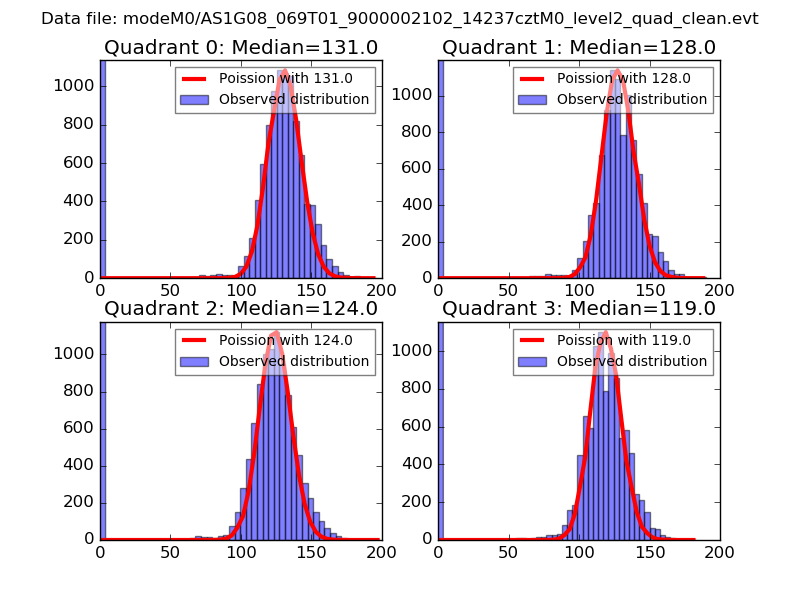
| Comparison with Poisson distribution Blue bars denote a histogram of data divided into 1 sec bins. Red curve is a Poisson curve with rate = median count rate of data. |
 |
 |
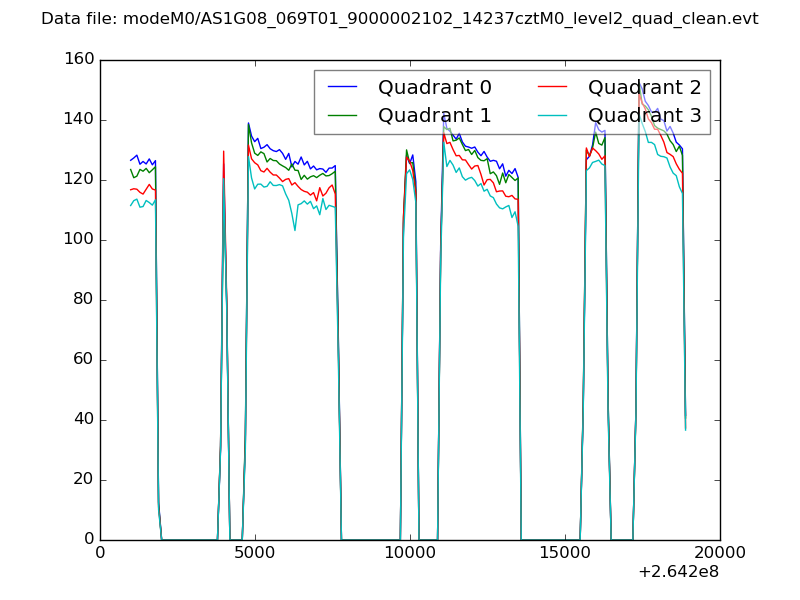
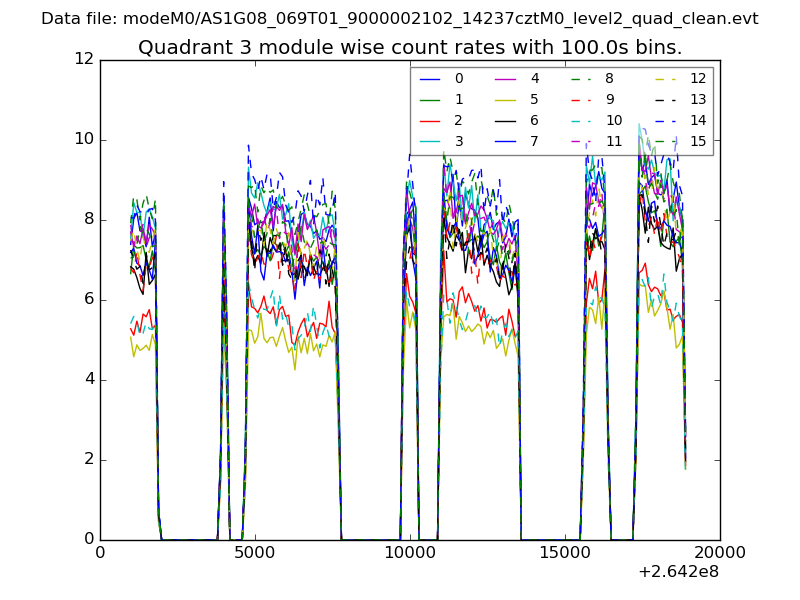
| Quadrant-wise count rates Data is divided into 100 sec bins |
 |
|
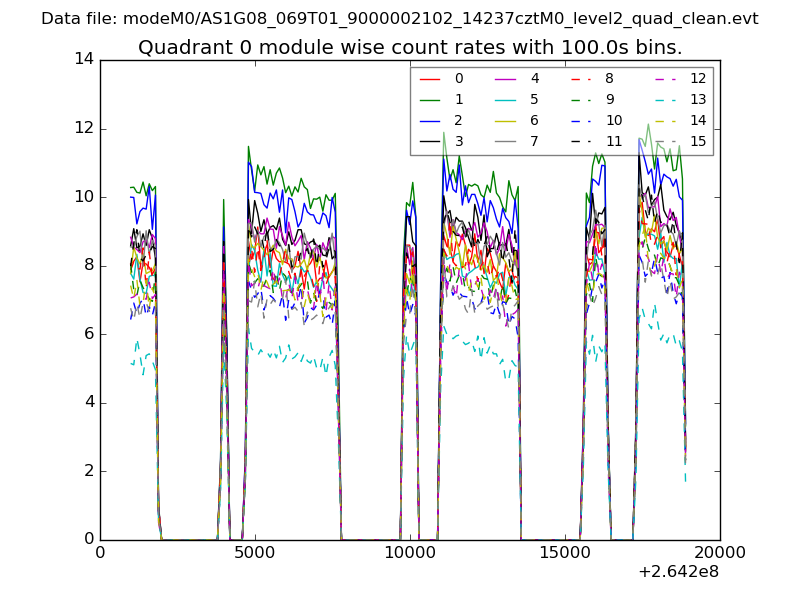
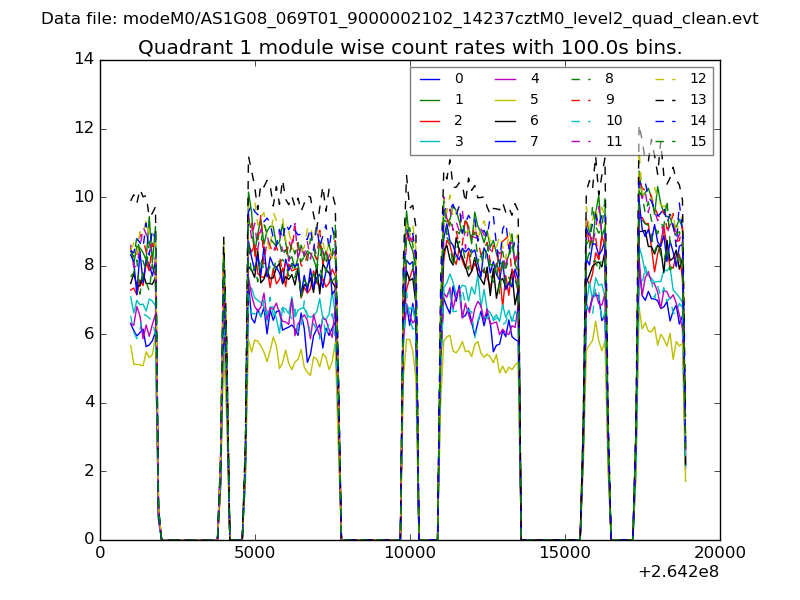
| Module-wise count rates for Quadrant A Data is divided into 100 sec bins |
 |
 |
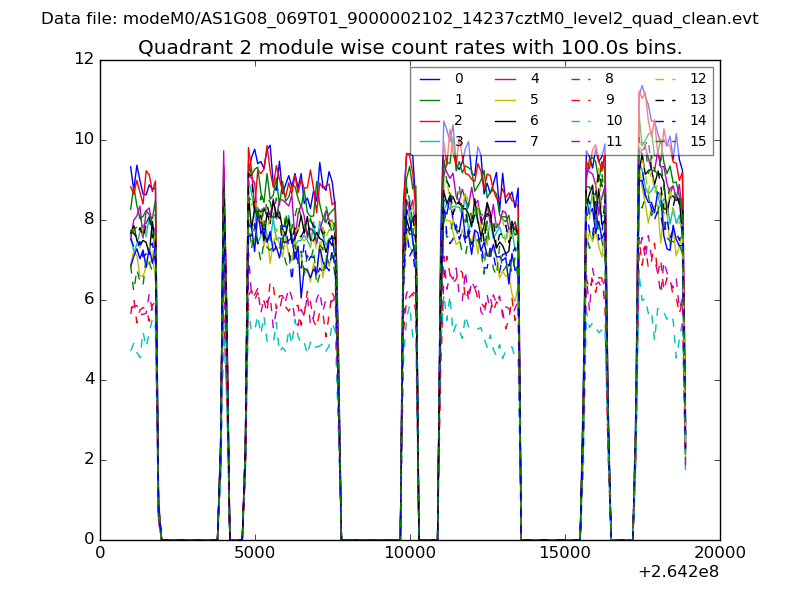
| Module-wise count rates for Quadrant B Data is divided into 100 sec bins |
 |
 |
| Module-wise count rates for Quadrant C Data is divided into 100 sec bins |
 |
 |
| Module-wise count rates for Quadrant D Data is divided into 100 sec bins |
 |
 |
| Parameter | Plot |
|---|---|
| CZT HV Monitor | 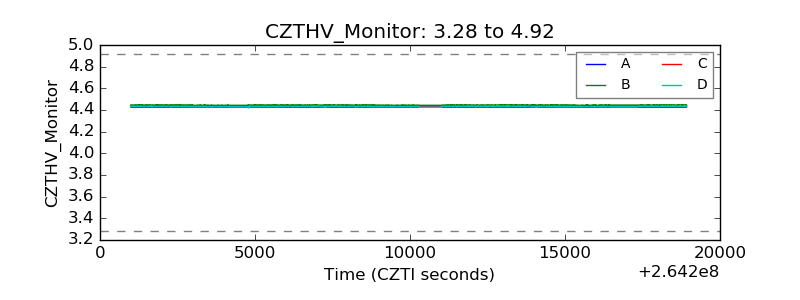 |
| D_VDD |  |
| Temperature 1 |  |
| Veto HV Monitor |  |
| Veto LLD |  |
| Alpha Counter |  |
| _CPM_Rate | 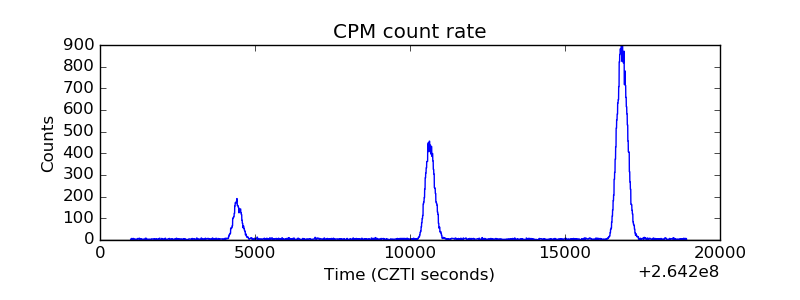 |
| CZT Counter | 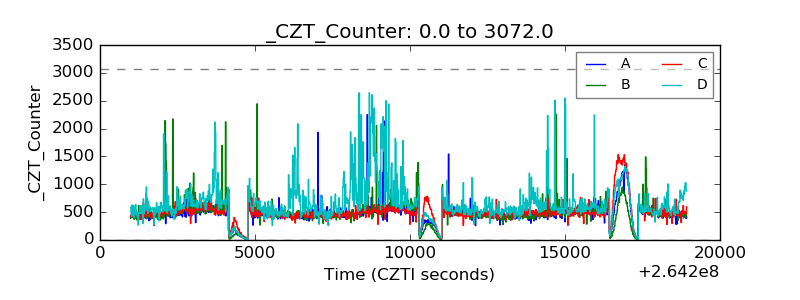 |
| +2.5 Volts monitor | 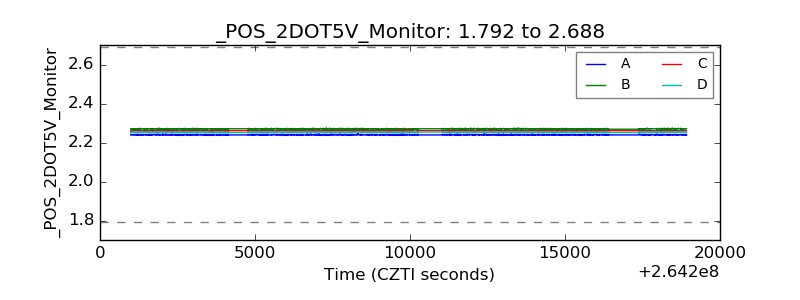 |
| +5 Volts monitor |  |
| _ROLL_ROT | 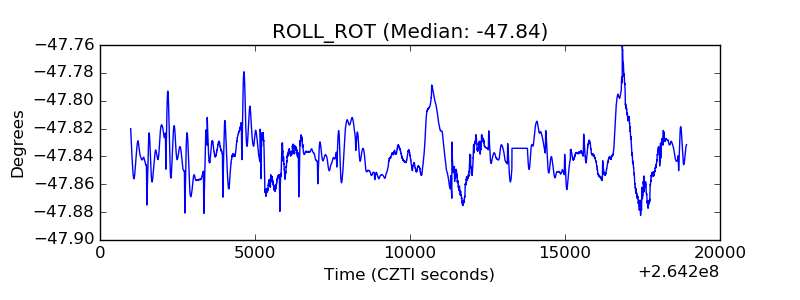 |
| _Roll_DEC | 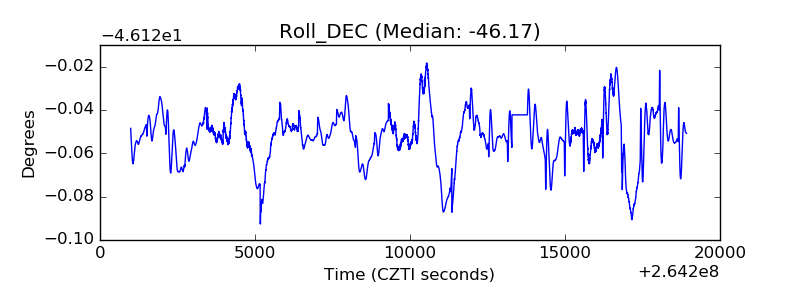 |
| _Roll_RA | 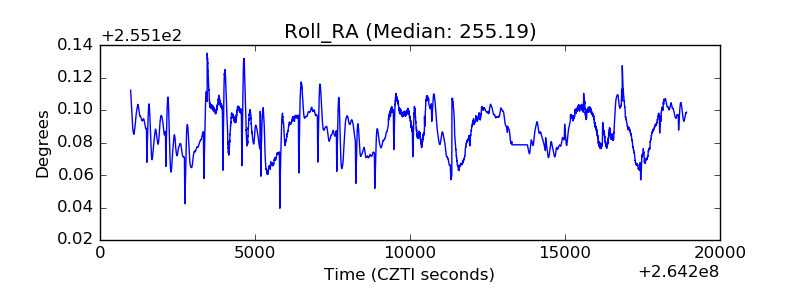 |
| Veto Counter | 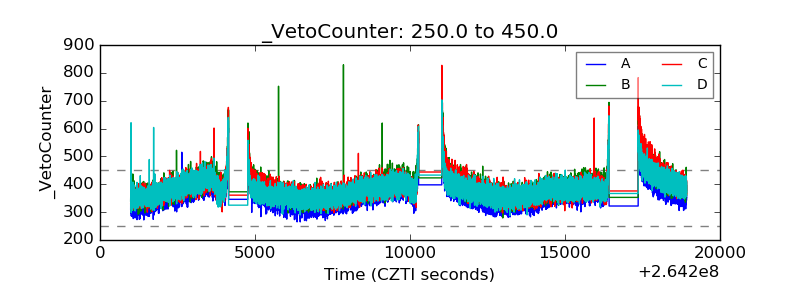 |