| Param | Original file | Final file |
|---|---|---|
| Filename | modeM0/AS1G08_069T01_9000002102_14238cztM0_level2.evt | modeM0/AS1G08_069T01_9000002102_14238cztM0_level2_quad_clean.evt |
| Size (bytes) | 461,871,360 | 92,914,560 |
| Size | 440.5 MB | 88.6 MB |
| Events in quadrant A | 3,404,938 | 610,610 |
| Events in quadrant B | 3,302,255 | 603,921 |
| Events in quadrant C | 3,217,757 | 587,577 |
| Events in quadrant D | 3,628,614 | 565,629 |
| Mode SS | |||
|---|---|---|---|
| Quadrant | BADHDUFLAG | Total packets | Discarded packets |
| A | 0 | 130 | 0 |
| B | 0 | 130 | 0 |
| C | 0 | 130 | 0 |
| D | 0 | 130 | 0 |
| Mode M0 | |||
|---|---|---|---|
| Quadrant | BADHDUFLAG | Total packets | Discarded packets |
| A | 0 | 14094 | 2 |
| B | 0 | 13722 | 1 |
| C | 0 | 13218 | 1 |
| D | 0 | 14842 | 1 |
| Mode M9 | |||
|---|---|---|---|
| Quadrant | BADHDUFLAG | Total packets | Discarded packets |
| A | 0 | 11 | 0 |
| B | 0 | 11 | 0 |
| C | 0 | 11 | 0 |
| D | 0 | 11 | 0 |
| Quadrant | Total seconds | Saturated seconds | Saturation percentage |
|---|---|---|---|
| A | 6394 | 28 | 0.437911% |
| B | 6394 | 79 | 1.235533% |
| C | 6394 | 29 | 0.453550% |
| D | 6394 | 39 | 0.609947% |
Noise dominated data is calculated using 1-second bins in cleaned event files. If a bin has >2000 counts, and if more than 50% of those come from <1% of pixels, then it is considered to be noise-dominated and hence unusable.
| Quadrant | # 1 sec bins | Bins with >0 counts | Bins with >2000 counts | High rate bins dominated by noise | Noise dominated (total time) | Noise dominated (detector-on time) | Marked lightcurve |
|---|---|---|---|---|---|---|---|
| A | 7435 | 6396 | 0 | 0 | 0.00% | 0.00% | 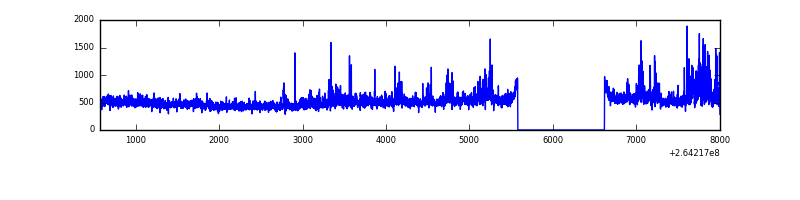 |
| B | 7435 | 6396 | 30 | 30 | 0.40% | 0.47% | 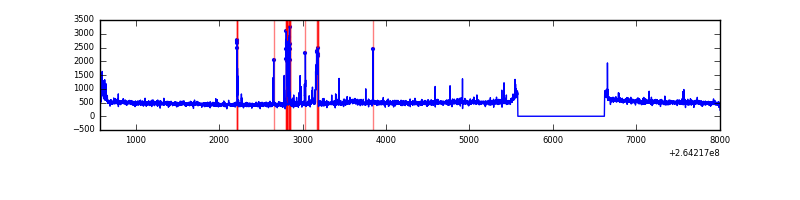 |
| C | 7435 | 6396 | 0 | 0 | 0.00% | 0.00% | 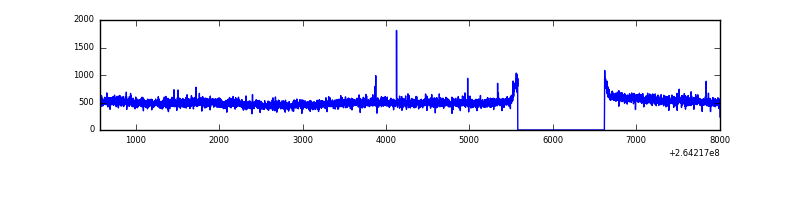 |
| D | 7435 | 6396 | 8 | 8 | 0.11% | 0.13% | 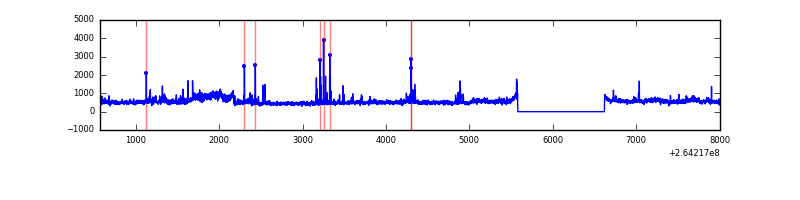 |
Top three noisy pixels from each quadrant. If the there are fewer than three noisy pixels in the level2.evt file, extra rows are filled as -1
| Pixel properties | Quadrant properties | ||||||
|---|---|---|---|---|---|---|---|
| Quadrant | DetID | PixID | Counts | Sigma | Mean | Median | Sigma |
| A | 9 | 143 | 290272 | 1827.02 | 782 | 765 | 158.5 |
| A | 8 | 15 | 89167 | 557.89 | 782 | 765 | 158.5 |
| A | 15 | 222 | 8946 | 51.63 | 782 | 765 | 158.5 |
| B | 0 | 229 | 117469 | 780.63 | 775 | 756 | 149.5 |
| B | 15 | 201 | 72587 | 480.44 | 775 | 756 | 149.5 |
| B | 4 | 97 | 26689 | 173.45 | 775 | 756 | 149.5 |
| C | 3 | 233 | 227324 | 1275.64 | 766 | 768 | 177.6 |
| C | 13 | 61 | 5432 | 26.26 | 766 | 768 | 177.6 |
| C | 14 | 234 | 4386 | 20.37 | 766 | 768 | 177.6 |
| D | 5 | 222 | 328236 | 1818.97 | 755 | 736 | 180.0 |
| D | 8 | 195 | 325239 | 1802.32 | 755 | 736 | 180.0 |
| D | 10 | 199 | 82014 | 451.43 | 755 | 736 | 180.0 |
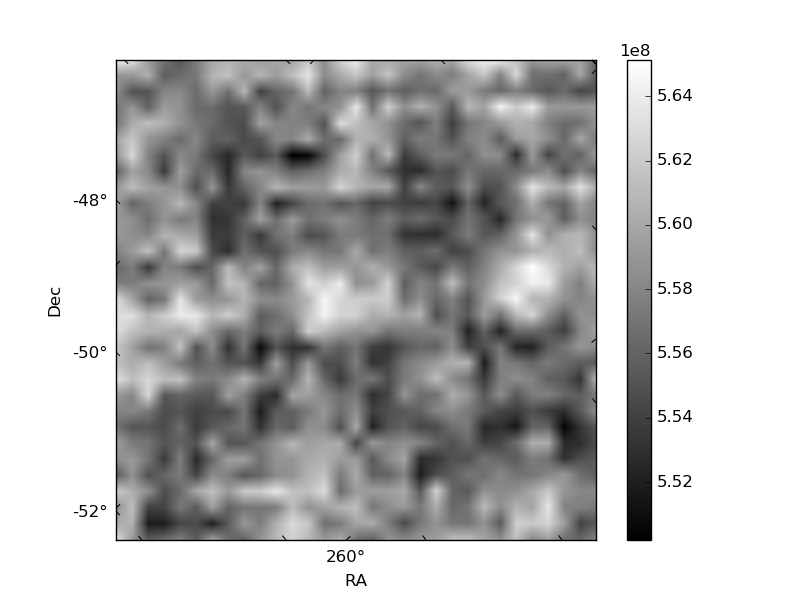
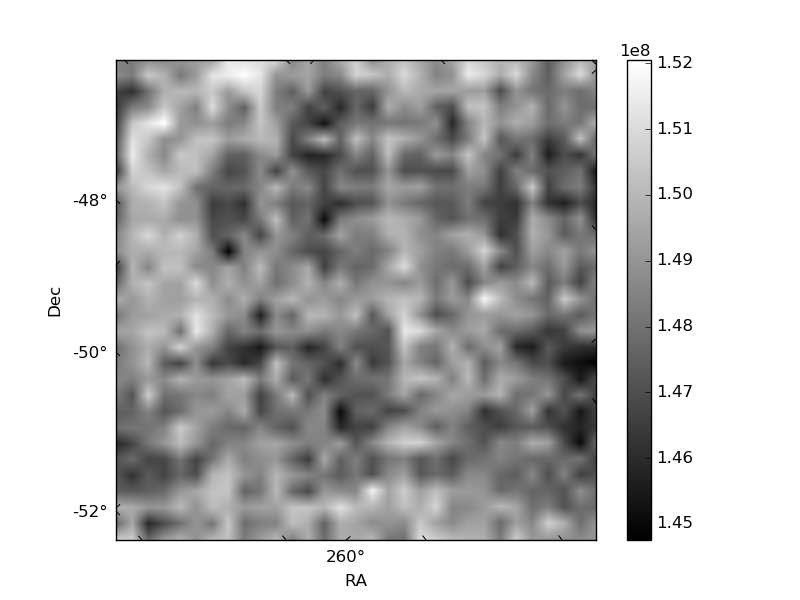
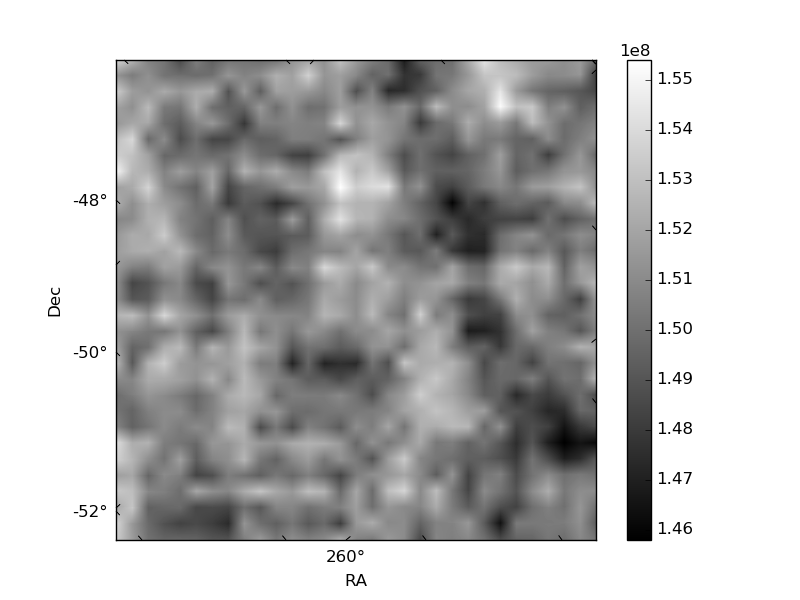
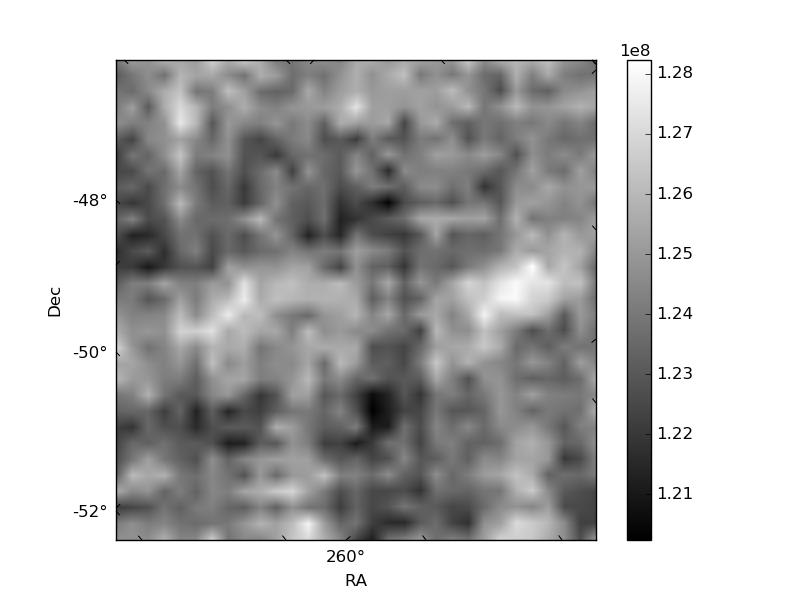
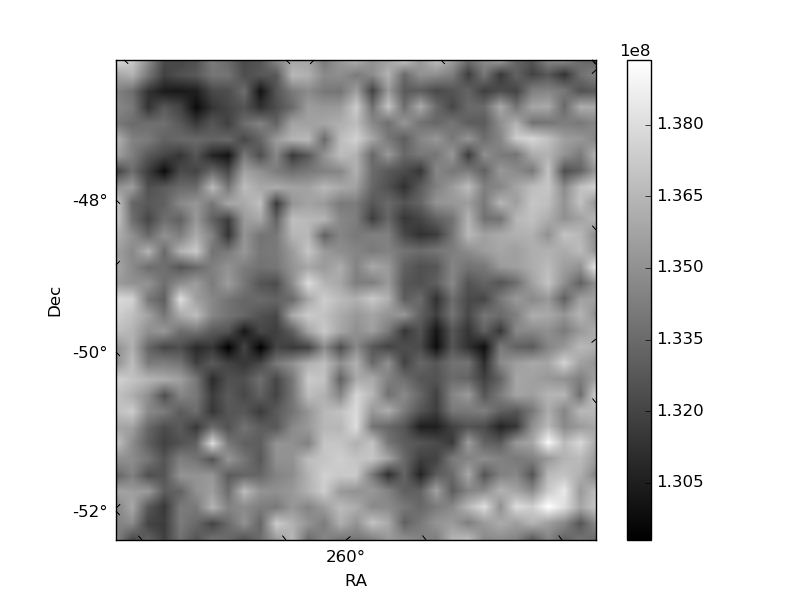
Histogram calculated using DETX and DETY for each event in the final _common_clean file
| Quadrant A | 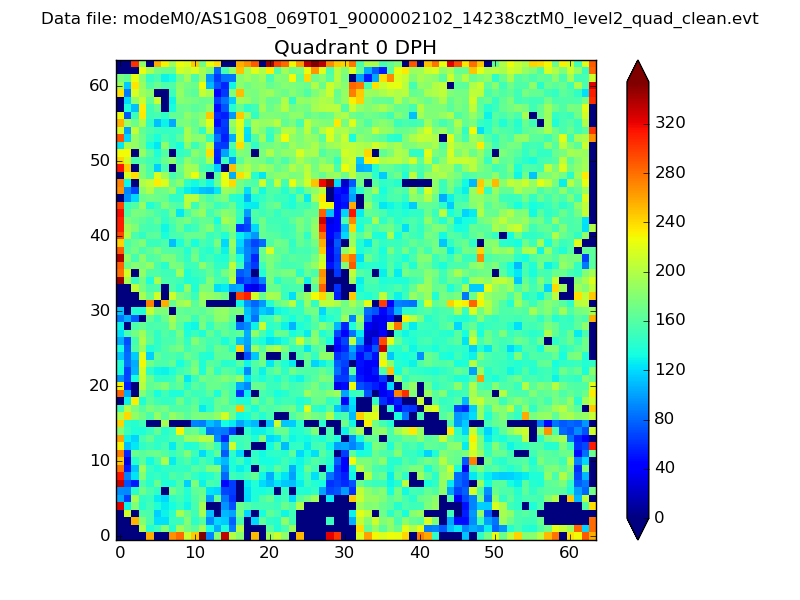 |
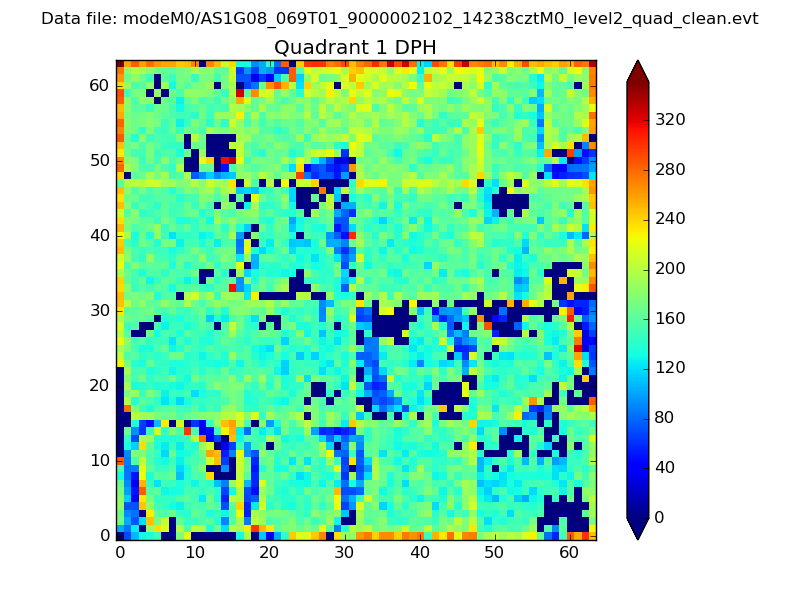 |
Quadrant B |
|---|---|---|---|
| Quadrant D | 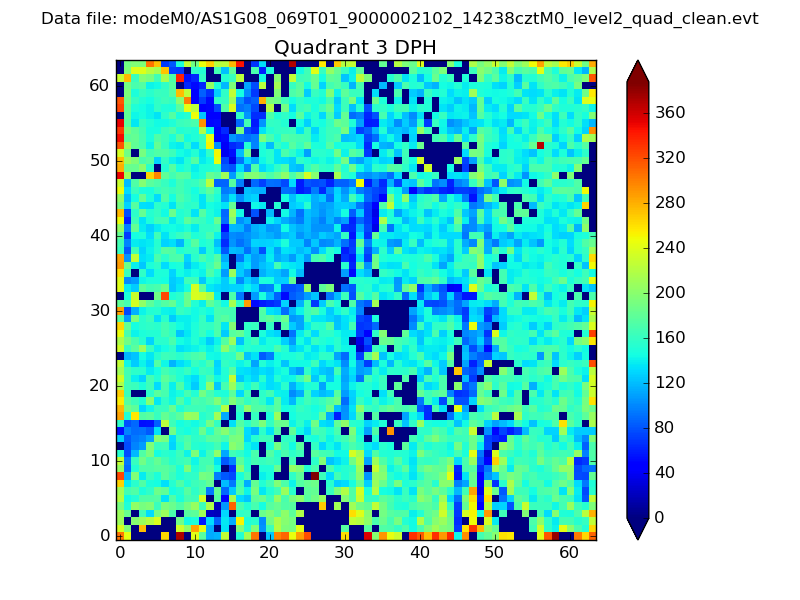 |
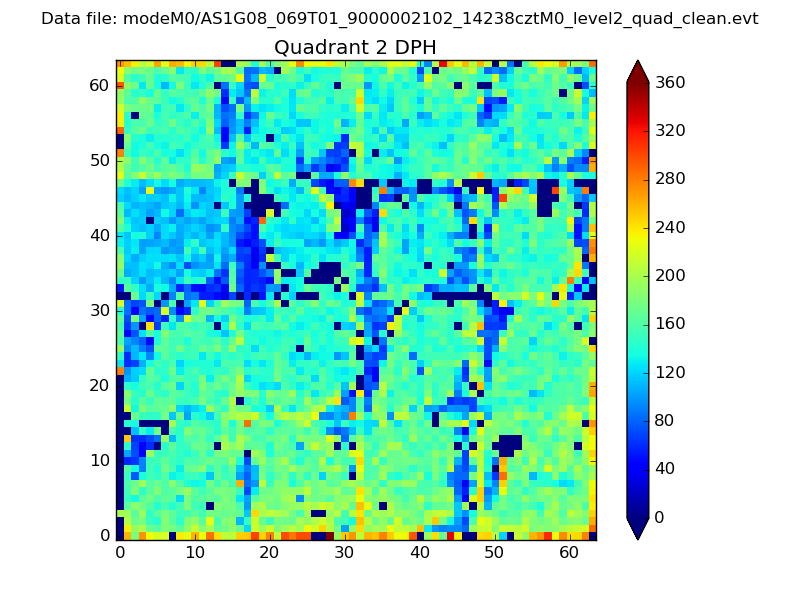 |
Quadrant C |
| Plot type | Count rate plots | Images |
|---|---|---|
| Comparison with Poisson distribution Blue bars denote a histogram of data divided into 1 sec bins. Red curve is a Poisson curve with rate = median count rate of data. |
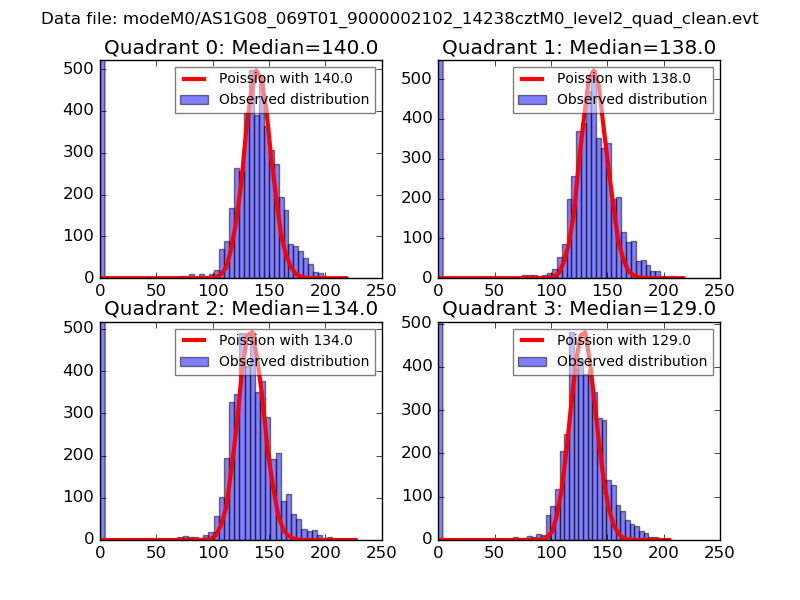 |
 |
| Quadrant-wise count rates Data is divided into 100 sec bins |
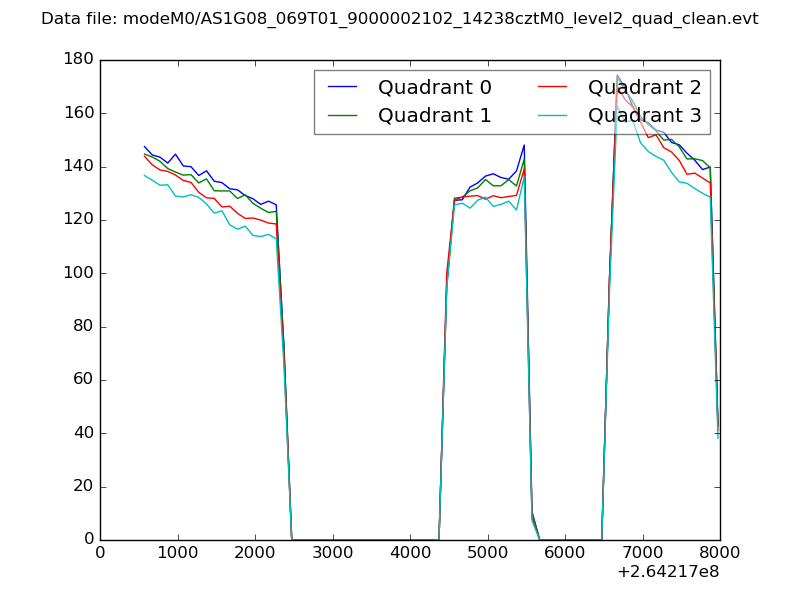 |
|
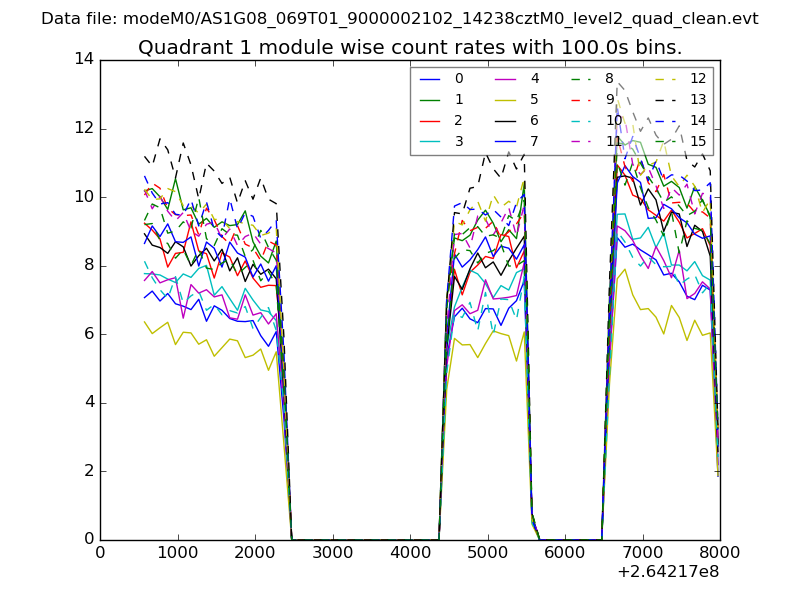
| Module-wise count rates for Quadrant A Data is divided into 100 sec bins |
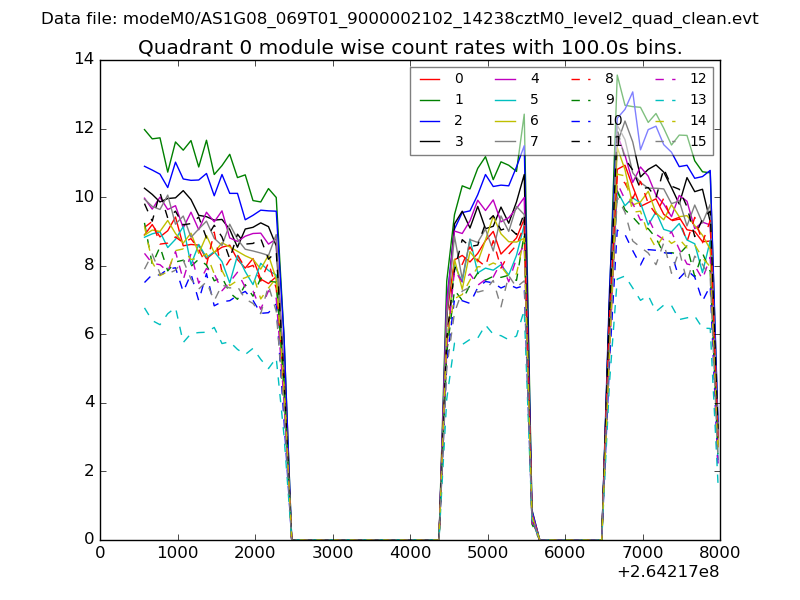 |
 |
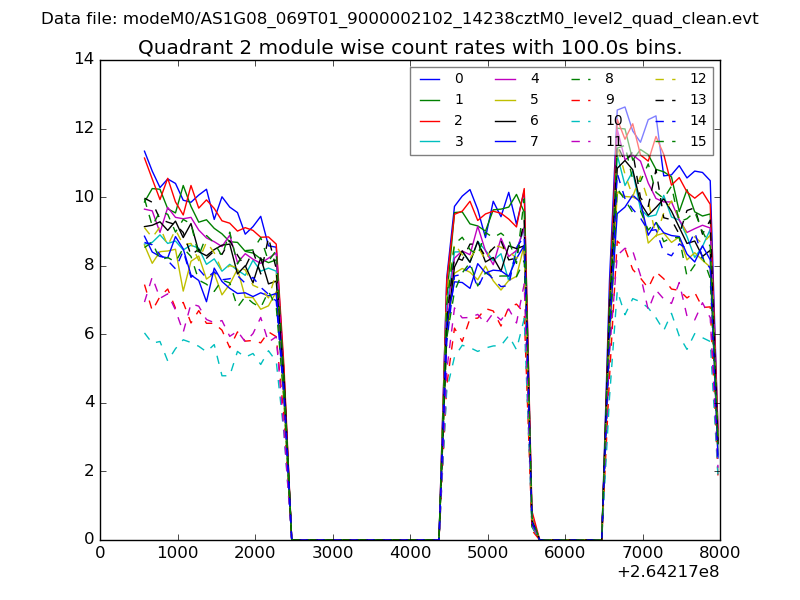
| Module-wise count rates for Quadrant B Data is divided into 100 sec bins |
 |
 |
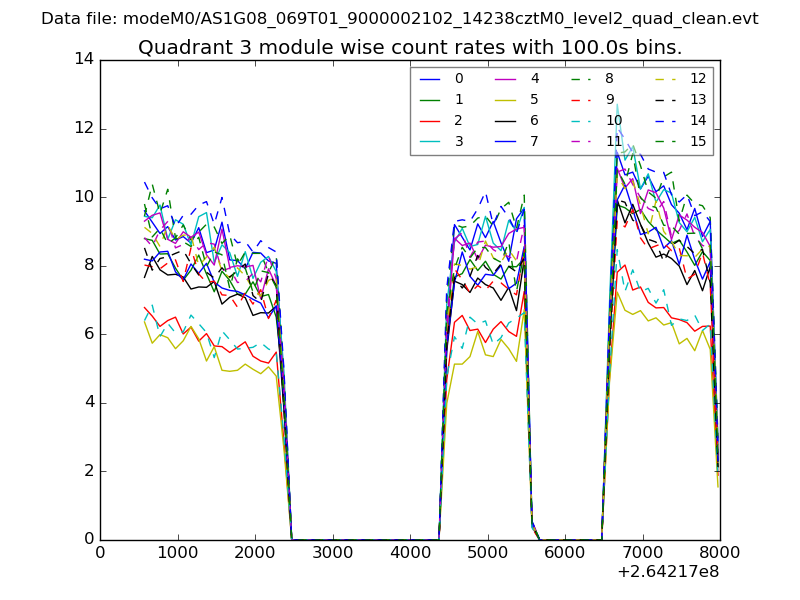
| Module-wise count rates for Quadrant C Data is divided into 100 sec bins |
 |
 |
| Module-wise count rates for Quadrant D Data is divided into 100 sec bins |
 |
 |
| Parameter | Plot |
|---|---|
| CZT HV Monitor | 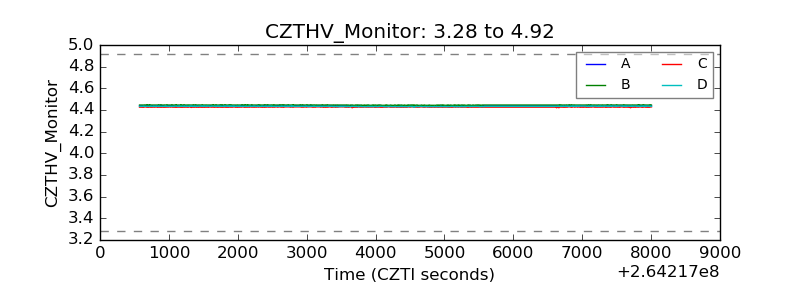 |
| D_VDD | 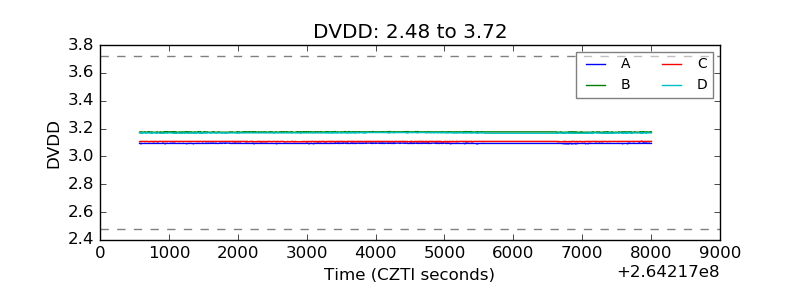 |
| Temperature 1 | 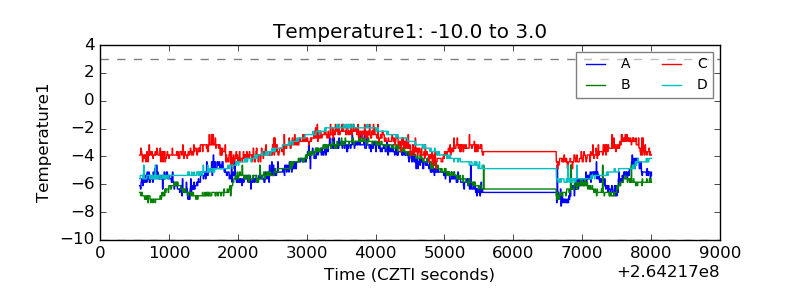 |
| Veto HV Monitor | 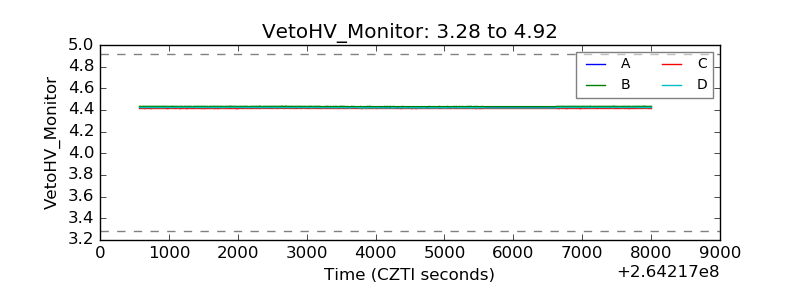 |
| Veto LLD |  |
| Alpha Counter | 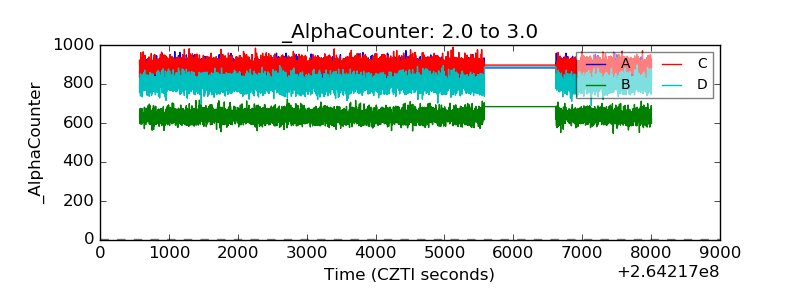 |
| _CPM_Rate | 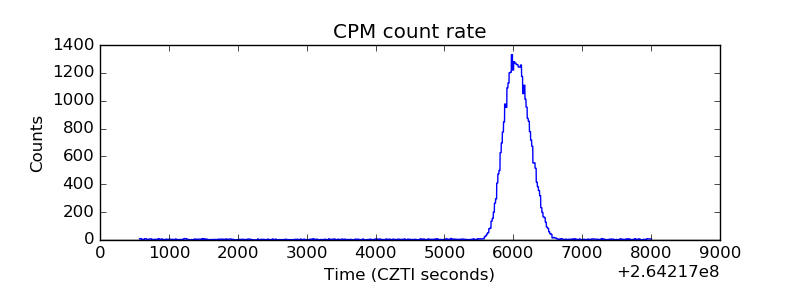 |
| CZT Counter | 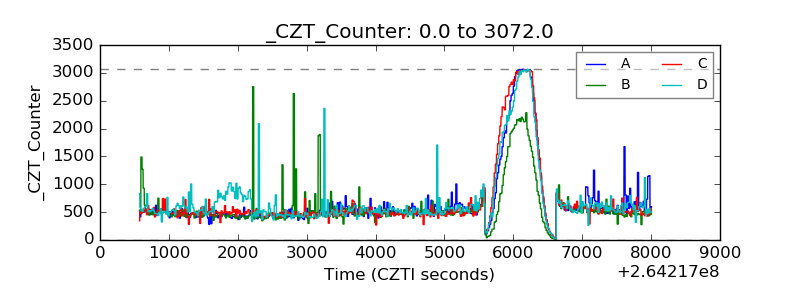 |
| +2.5 Volts monitor |  |
| +5 Volts monitor |  |
| _ROLL_ROT | 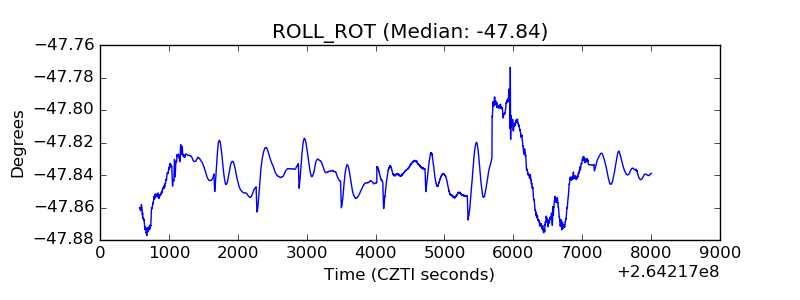 |
| _Roll_DEC | 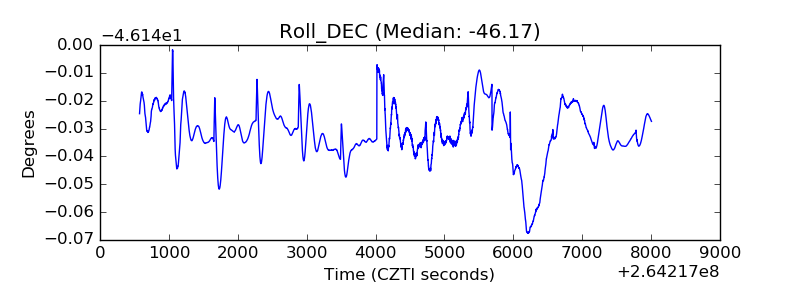 |
| _Roll_RA | 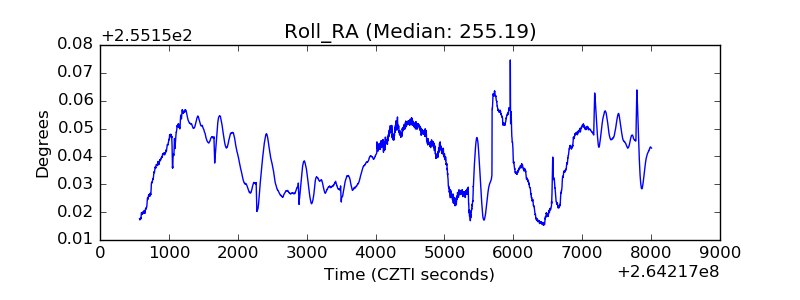 |
| Veto Counter | 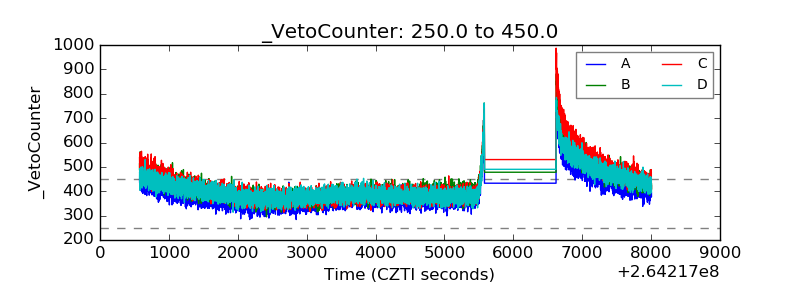 |