| Param | Original file | Final file |
|---|---|---|
| Filename | modeM0/AS1G08_069T01_9000002102_14239cztM0_level2.evt | modeM0/AS1G08_069T01_9000002102_14239cztM0_level2_quad_clean.evt |
| Size (bytes) | 583,819,200 | 97,891,200 |
| Size | 556.8 MB | 93.4 MB |
| Events in quadrant A | 5,045,333 | 646,560 |
| Events in quadrant B | 3,357,741 | 646,048 |
| Events in quadrant C | 3,362,803 | 629,173 |
| Events in quadrant D | 5,484,235 | 598,771 |
| Mode SS | |||
|---|---|---|---|
| Quadrant | BADHDUFLAG | Total packets | Discarded packets |
| A | 0 | 128 | 0 |
| B | 0 | 128 | 0 |
| C | 0 | 128 | 0 |
| D | 0 | 128 | 0 |
| Mode M0 | |||
|---|---|---|---|
| Quadrant | BADHDUFLAG | Total packets | Discarded packets |
| A | 0 | 19015 | 3 |
| B | 0 | 13819 | 2 |
| C | 0 | 13757 | 2 |
| D | 0 | 20627 | 2 |
| Mode M9 | |||
|---|---|---|---|
| Quadrant | BADHDUFLAG | Total packets | Discarded packets |
| A | 0 | 17 | 0 |
| B | 0 | 17 | 0 |
| C | 0 | 17 | 0 |
| D | 0 | 18 | 0 |
| Quadrant | Total seconds | Saturated seconds | Saturation percentage |
|---|---|---|---|
| A | 6369 | 539 | 8.462867% |
| B | 6369 | 62 | 0.973465% |
| C | 6369 | 40 | 0.628042% |
| D | 6369 | 319 | 5.008636% |
Noise dominated data is calculated using 1-second bins in cleaned event files. If a bin has >2000 counts, and if more than 50% of those come from <1% of pixels, then it is considered to be noise-dominated and hence unusable.
| Quadrant | # 1 sec bins | Bins with >0 counts | Bins with >2000 counts | High rate bins dominated by noise | Noise dominated (total time) | Noise dominated (detector-on time) | Marked lightcurve |
|---|---|---|---|---|---|---|---|
| A | 7525 | 6371 | 365 | 365 | 4.85% | 5.73% | 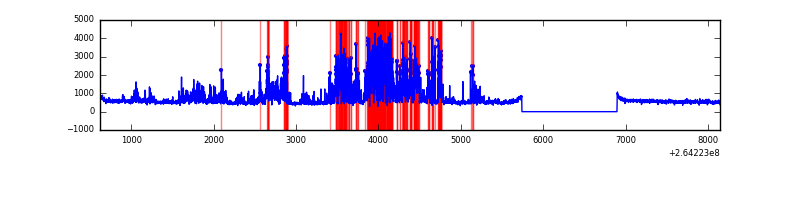 |
| B | 7525 | 6371 | 17 | 17 | 0.23% | 0.27% | 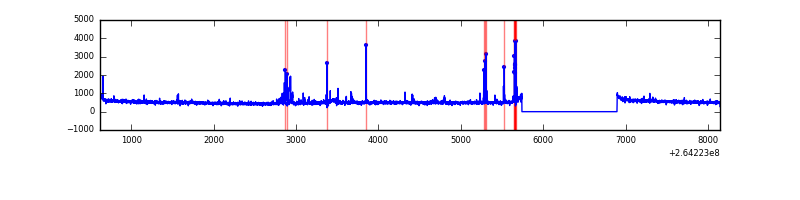 |
| C | 7525 | 6371 | 0 | 0 | 0.00% | 0.00% | 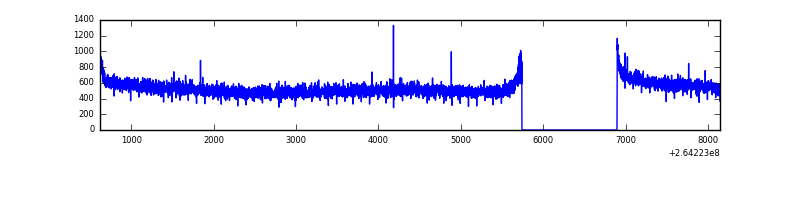 |
| D | 7525 | 6371 | 280 | 280 | 3.72% | 4.39% | 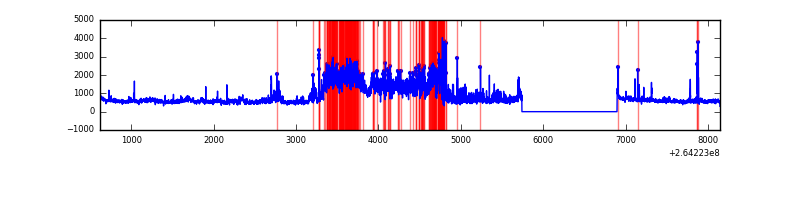 |
Top three noisy pixels from each quadrant. If the there are fewer than three noisy pixels in the level2.evt file, extra rows are filled as -1
| Pixel properties | Quadrant properties | ||||||
|---|---|---|---|---|---|---|---|
| Quadrant | DetID | PixID | Counts | Sigma | Mean | Median | Sigma |
| A | 9 | 143 | 1931697 | 12113.6 | 792 | 775 | 159.4 |
| A | 8 | 15 | 52594 | 325.09 | 792 | 775 | 159.4 |
| A | 12 | 189 | 15510 | 92.44 | 792 | 775 | 159.4 |
| B | 0 | 229 | 125429 | 819.24 | 805 | 783 | 152.1 |
| B | 4 | 97 | 37083 | 238.58 | 805 | 783 | 152.1 |
| B | 4 | 48 | 24195 | 153.88 | 805 | 783 | 152.1 |
| C | 3 | 233 | 249158 | 1353.48 | 798 | 803 | 183.5 |
| C | 13 | 61 | 5422 | 25.17 | 798 | 803 | 183.5 |
| C | 14 | 234 | 2758 | 10.65 | 798 | 803 | 183.5 |
| D | 5 | 222 | 1898667 | 10344.25 | 783 | 767 | 183.5 |
| D | 8 | 195 | 493447 | 2685.29 | 783 | 767 | 183.5 |
| D | 10 | 199 | 85706 | 462.95 | 783 | 767 | 183.5 |
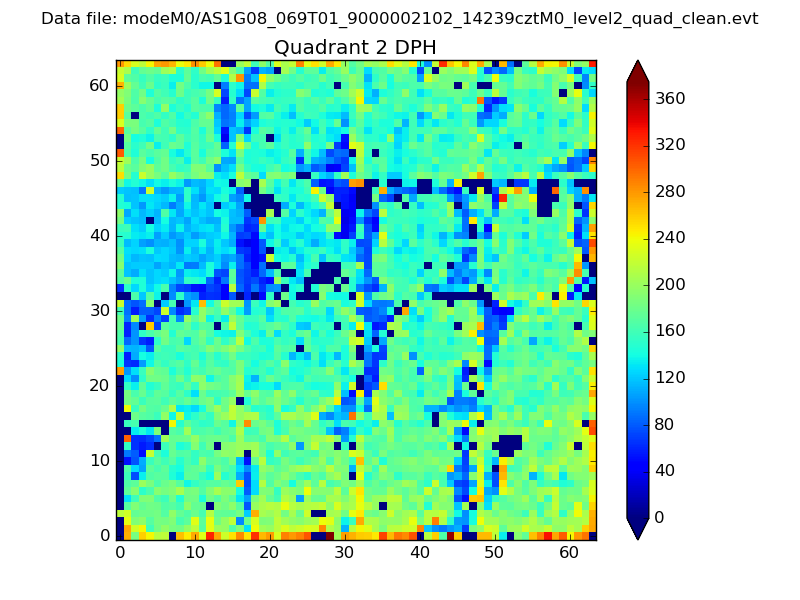
Histogram calculated using DETX and DETY for each event in the final _common_clean file
| Quadrant A | 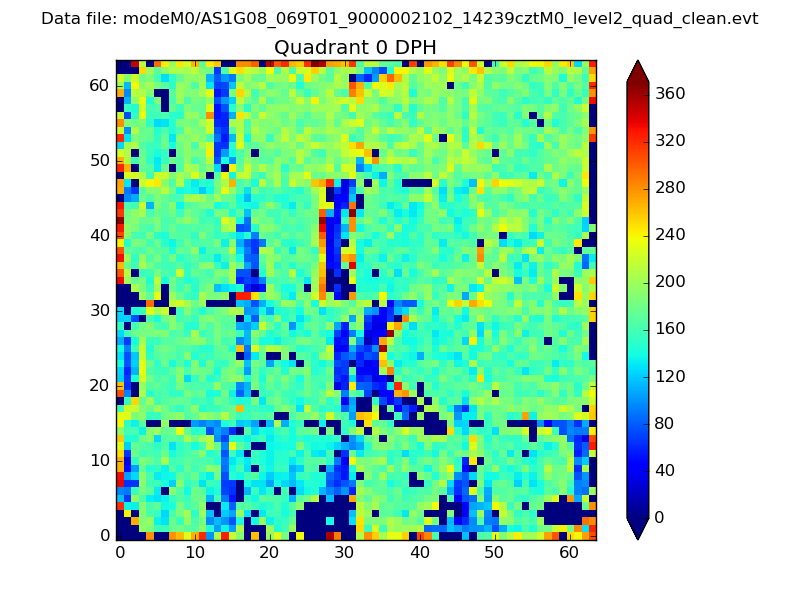 |
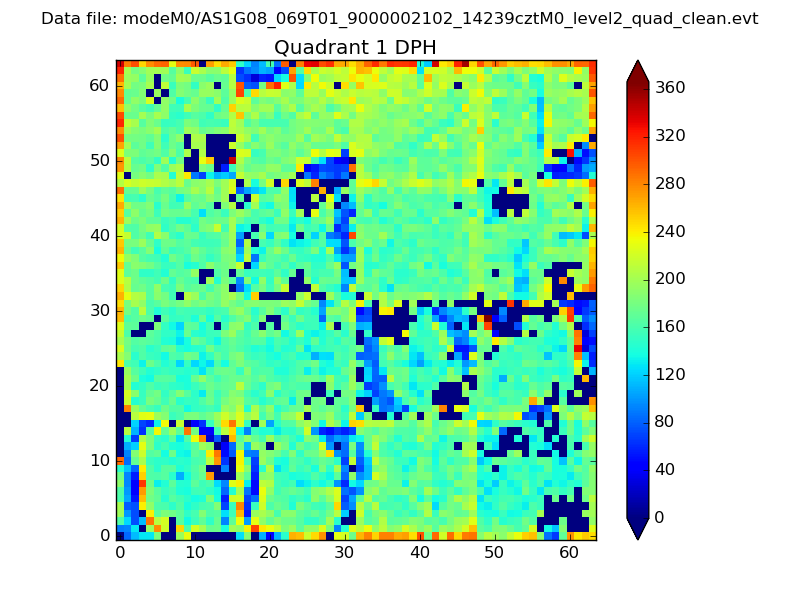 |
Quadrant B |
|---|---|---|---|
| Quadrant D | 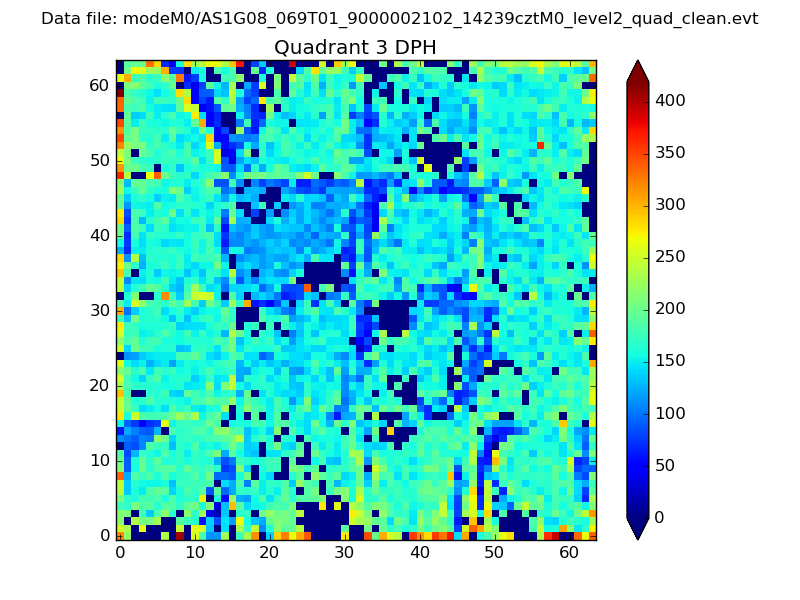 |
 |
Quadrant C |
| Plot type | Count rate plots | Images |
|---|---|---|
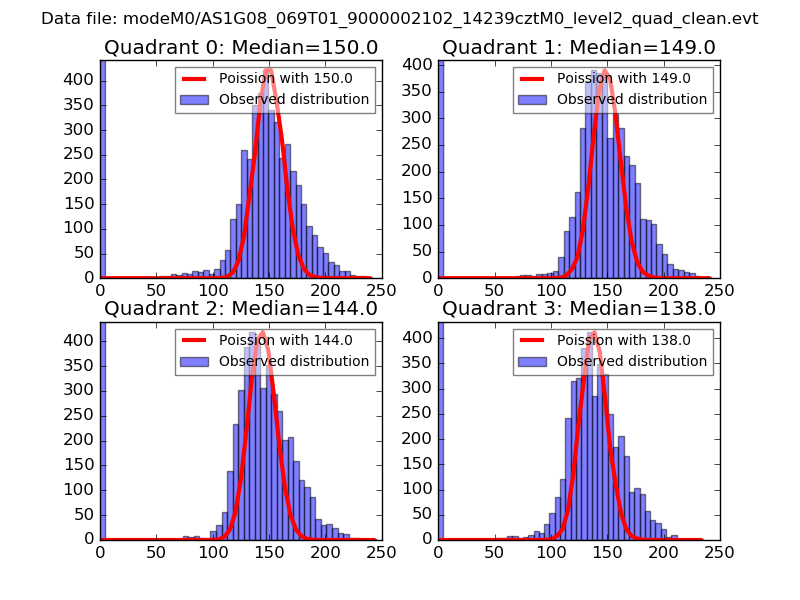
| Comparison with Poisson distribution Blue bars denote a histogram of data divided into 1 sec bins. Red curve is a Poisson curve with rate = median count rate of data. |
 |
 |
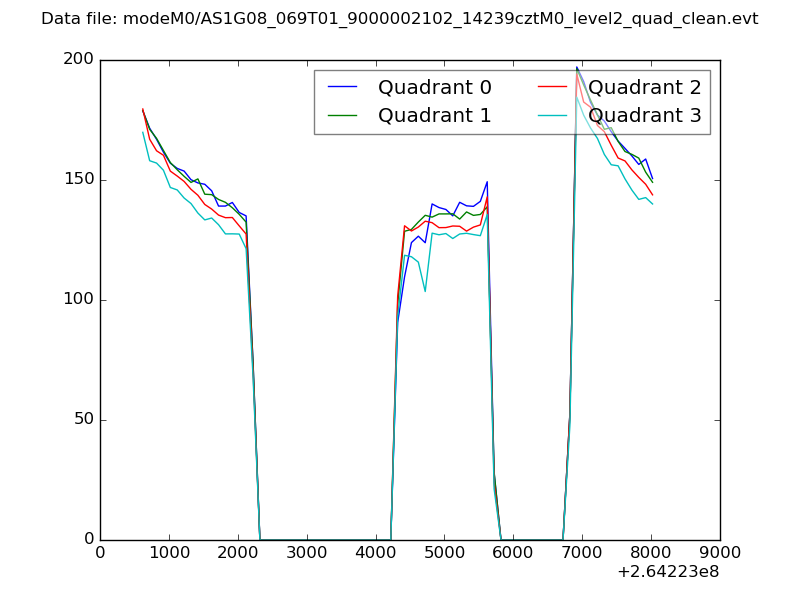
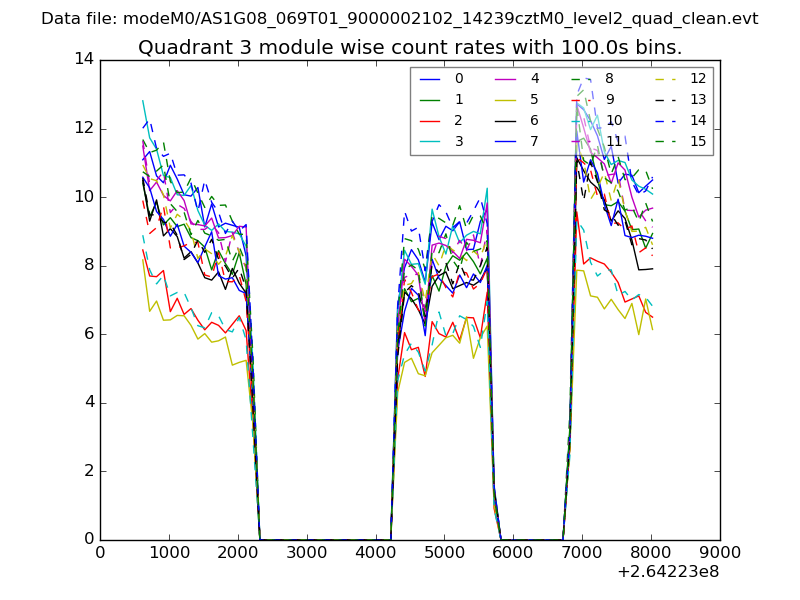
| Quadrant-wise count rates Data is divided into 100 sec bins |
 |
|
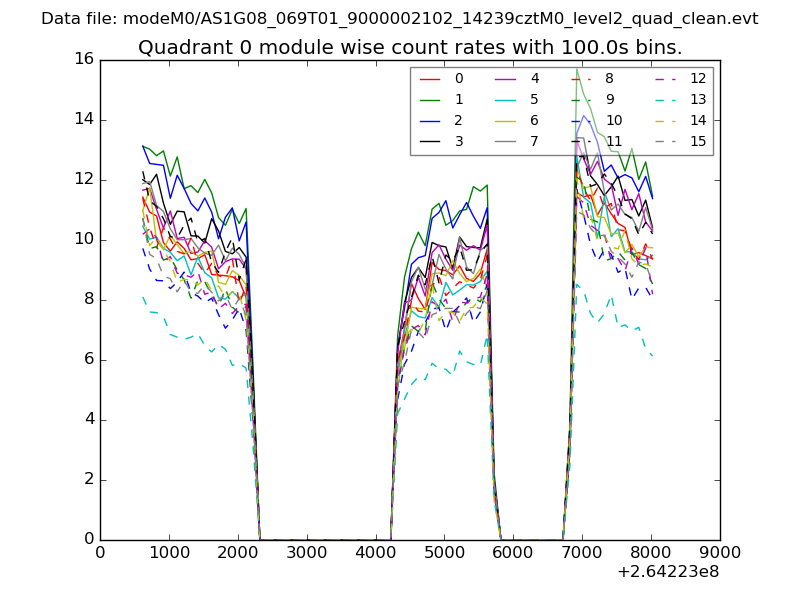
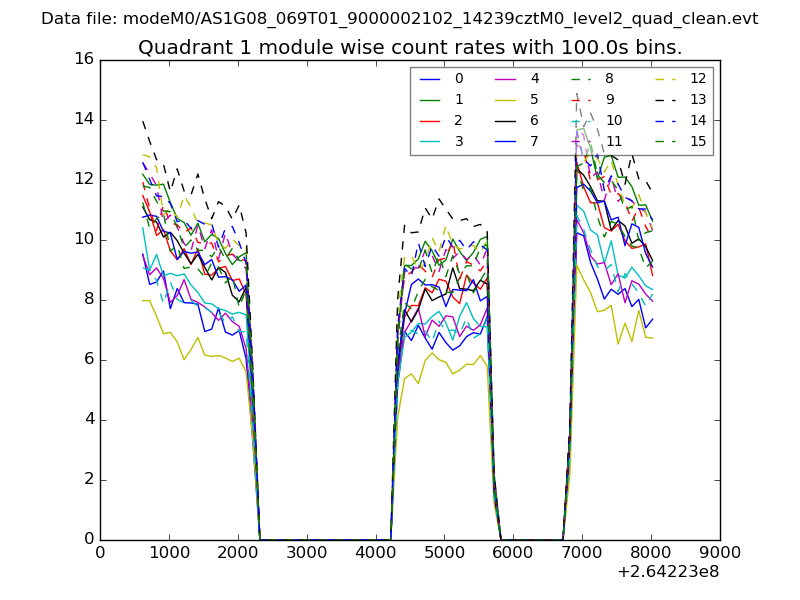
| Module-wise count rates for Quadrant A Data is divided into 100 sec bins |
 |
 |
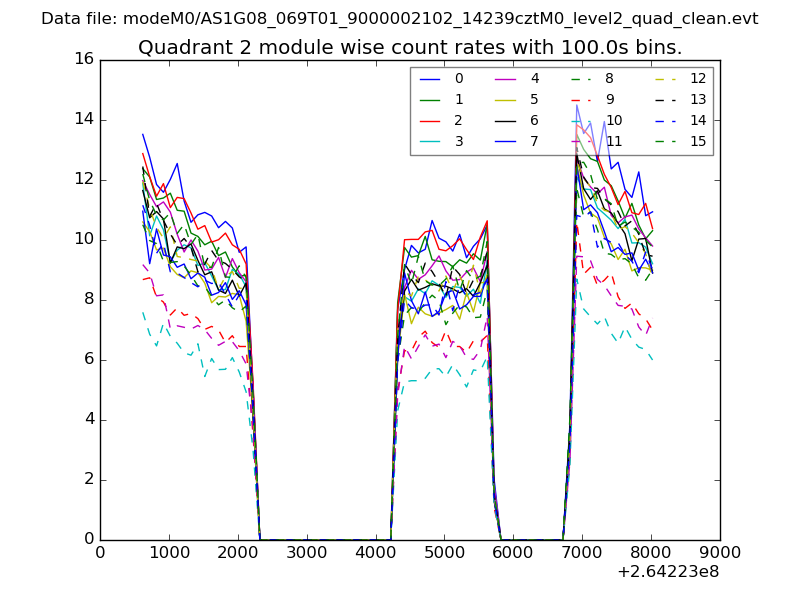
| Module-wise count rates for Quadrant B Data is divided into 100 sec bins |
 |
 |
| Module-wise count rates for Quadrant C Data is divided into 100 sec bins |
 |
 |
| Module-wise count rates for Quadrant D Data is divided into 100 sec bins |
 |
 |
| Parameter | Plot |
|---|---|
| CZT HV Monitor | 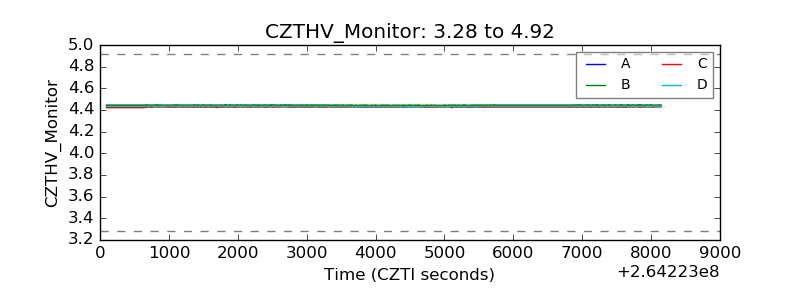 |
| D_VDD | 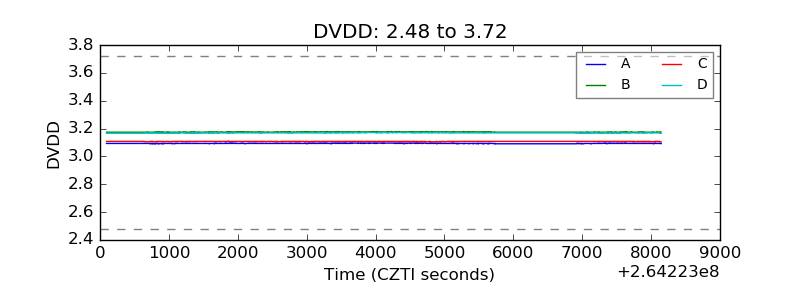 |
| Temperature 1 | 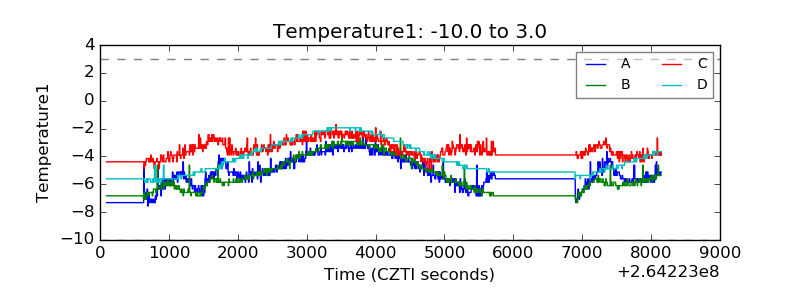 |
| Veto HV Monitor | 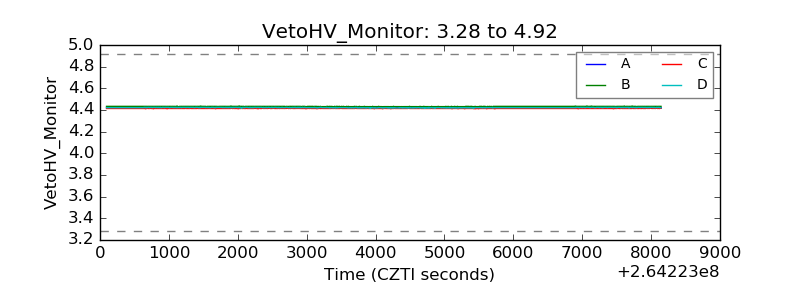 |
| Veto LLD | 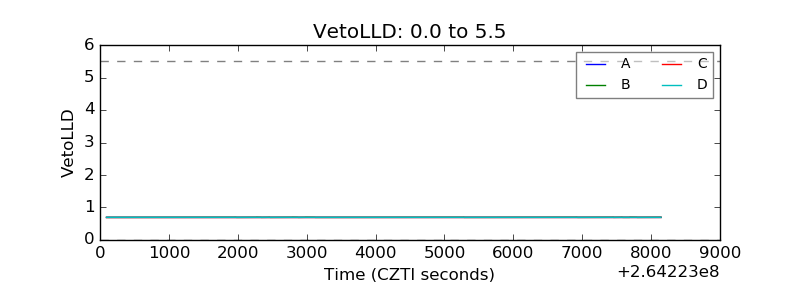 |
| Alpha Counter | 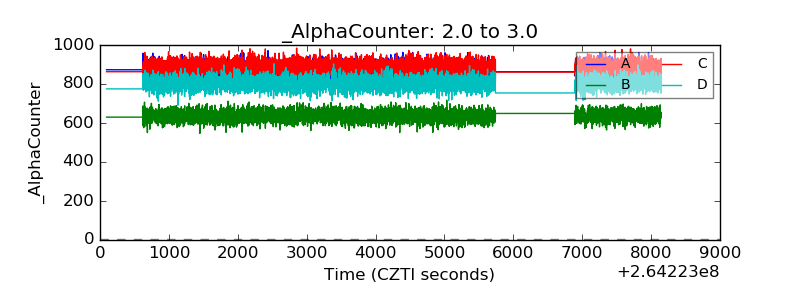 |
| _CPM_Rate | 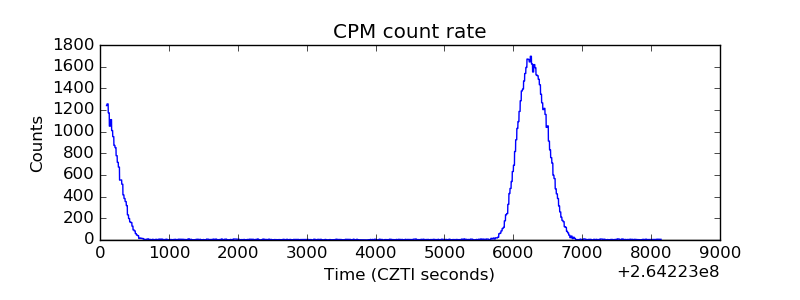 |
| CZT Counter | 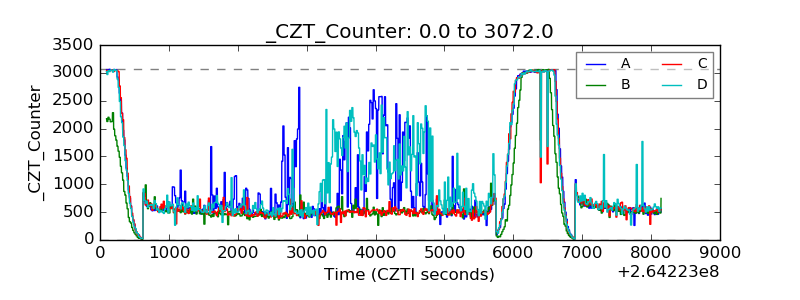 |
| +2.5 Volts monitor |  |
| +5 Volts monitor |  |
| _ROLL_ROT | 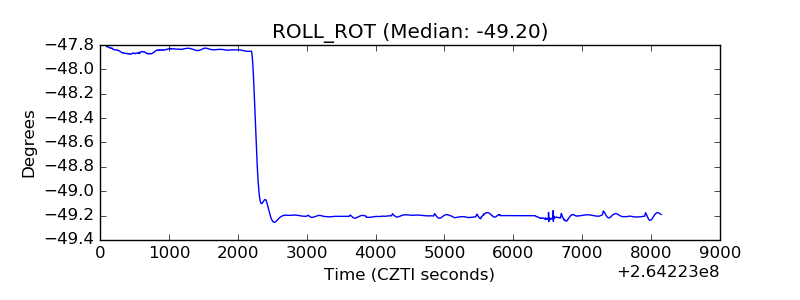 |
| _Roll_DEC | 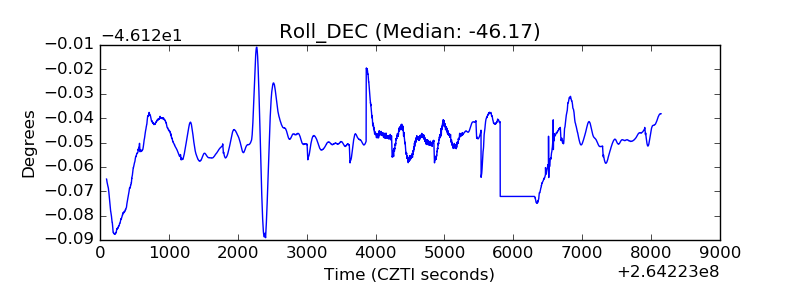 |
| _Roll_RA | 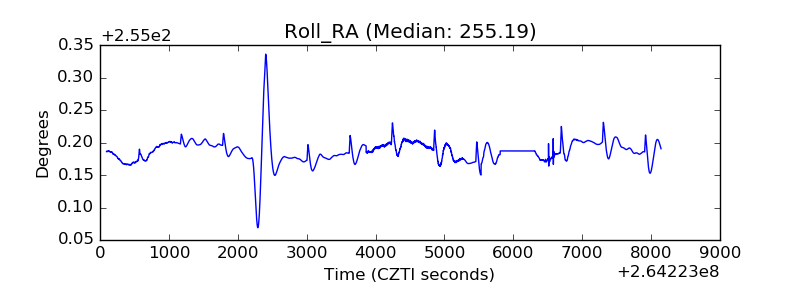 |
| Veto Counter | 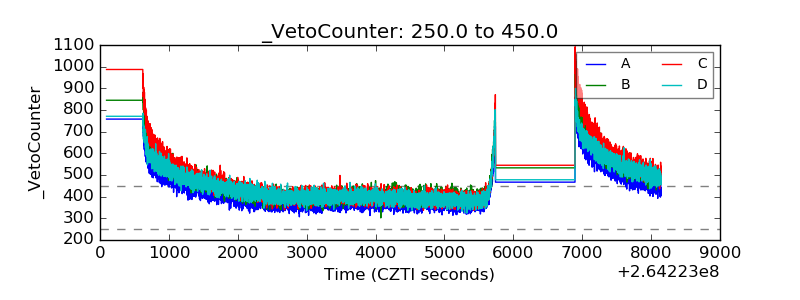 |