| Param | Original file | Final file |
|---|---|---|
| Filename | modeM0/AS1G08_069T01_9000002102_14242cztM0_level2.evt | modeM0/AS1G08_069T01_9000002102_14242cztM0_level2_quad_clean.evt |
| Size (bytes) | 523,693,440 | 83,393,280 |
| Size | 499.4 MB | 79.5 MB |
| Events in quadrant A | 3,450,712 | 541,817 |
| Events in quadrant B | 3,512,141 | 537,108 |
| Events in quadrant C | 3,471,641 | 519,623 |
| Events in quadrant D | 5,002,366 | 490,704 |
| Mode SS | |||
|---|---|---|---|
| Quadrant | BADHDUFLAG | Total packets | Discarded packets |
| A | 0 | 128 | 0 |
| B | 0 | 128 | 0 |
| C | 0 | 128 | 0 |
| D | 0 | 128 | 0 |
| Mode M0 | |||
|---|---|---|---|
| Quadrant | BADHDUFLAG | Total packets | Discarded packets |
| A | 0 | 14218 | 3 |
| B | 0 | 14188 | 2 |
| C | 0 | 14047 | 2 |
| D | 0 | 19666 | 2 |
| Mode M9 | |||
|---|---|---|---|
| Quadrant | BADHDUFLAG | Total packets | Discarded packets |
| A | 0 | 12 | 0 |
| B | 0 | 12 | 0 |
| C | 0 | 12 | 0 |
| D | 0 | 13 | 0 |
| Quadrant | Total seconds | Saturated seconds | Saturation percentage |
|---|---|---|---|
| A | 6241 | 105 | 1.682423% |
| B | 6241 | 139 | 2.227207% |
| C | 6241 | 86 | 1.377984% |
| D | 6241 | 232 | 3.717353% |
Noise dominated data is calculated using 1-second bins in cleaned event files. If a bin has >2000 counts, and if more than 50% of those come from <1% of pixels, then it is considered to be noise-dominated and hence unusable.
| Quadrant | # 1 sec bins | Bins with >0 counts | Bins with >2000 counts | High rate bins dominated by noise | Noise dominated (total time) | Noise dominated (detector-on time) | Marked lightcurve |
|---|---|---|---|---|---|---|---|
| A | 7507 | 6242 | 4 | 4 | 0.05% | 0.06% | 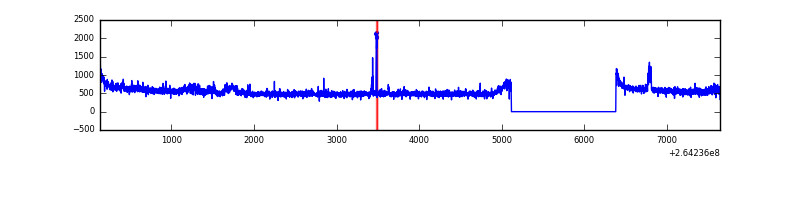 |
| B | 7507 | 6243 | 22 | 22 | 0.29% | 0.35% | 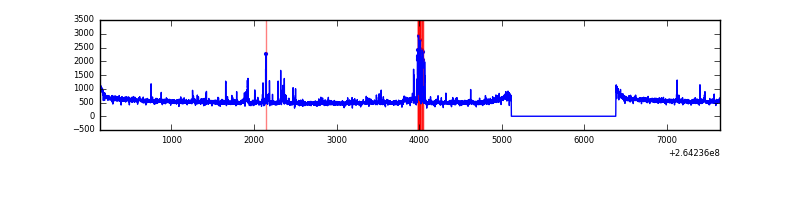 |
| C | 7507 | 6243 | 0 | 0 | 0.00% | 0.00% | 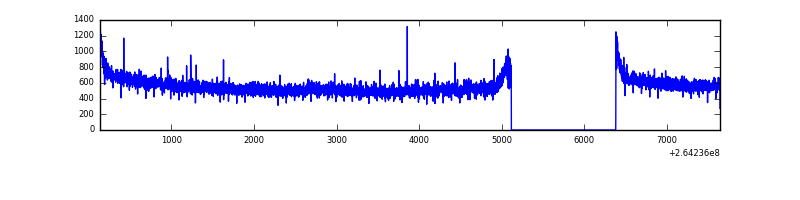 |
| D | 7507 | 6243 | 112 | 112 | 1.49% | 1.79% | 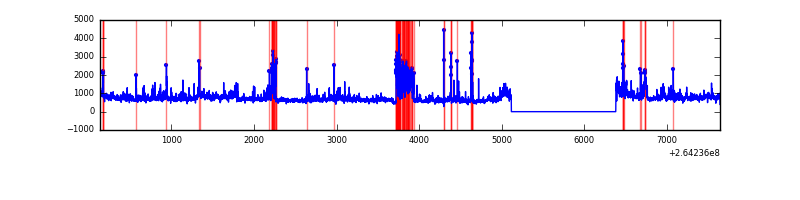 |
Top three noisy pixels from each quadrant. If the there are fewer than three noisy pixels in the level2.evt file, extra rows are filled as -1
| Pixel properties | Quadrant properties | ||||||
|---|---|---|---|---|---|---|---|
| Quadrant | DetID | PixID | Counts | Sigma | Mean | Median | Sigma |
| A | 12 | 189 | 127566 | 743.13 | 853 | 835 | 170.5 |
| A | 15 | 69 | 22062 | 124.47 | 853 | 835 | 170.5 |
| A | 9 | 143 | 12117 | 66.16 | 853 | 835 | 170.5 |
| B | 0 | 229 | 175144 | 1119.68 | 838 | 819 | 155.7 |
| B | 4 | 97 | 32427 | 203.02 | 838 | 819 | 155.7 |
| B | 12 | 111 | 17941 | 109.97 | 838 | 819 | 155.7 |
| C | 3 | 233 | 244603 | 1292.46 | 826 | 832 | 188.6 |
| C | 14 | 234 | 5921 | 26.98 | 826 | 832 | 188.6 |
| C | 13 | 61 | 5846 | 26.58 | 826 | 832 | 188.6 |
| D | 5 | 222 | 799152 | 4165.19 | 817 | 799 | 191.7 |
| D | 8 | 195 | 693831 | 3615.7 | 817 | 799 | 191.7 |
| D | 10 | 199 | 204920 | 1064.94 | 817 | 799 | 191.7 |
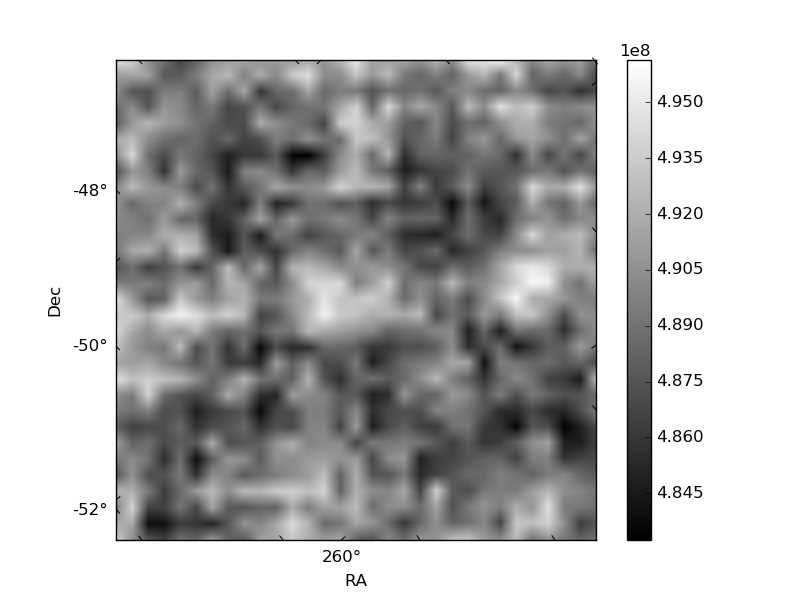
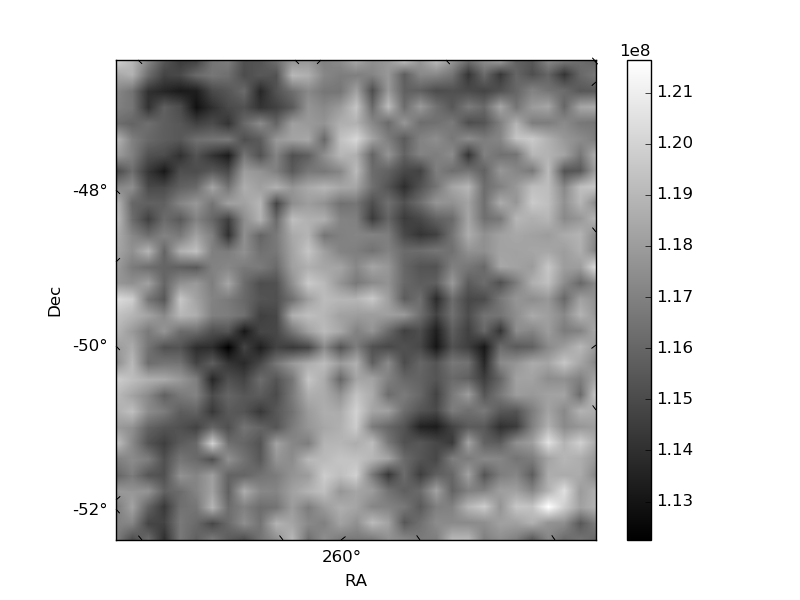
Histogram calculated using DETX and DETY for each event in the final _common_clean file
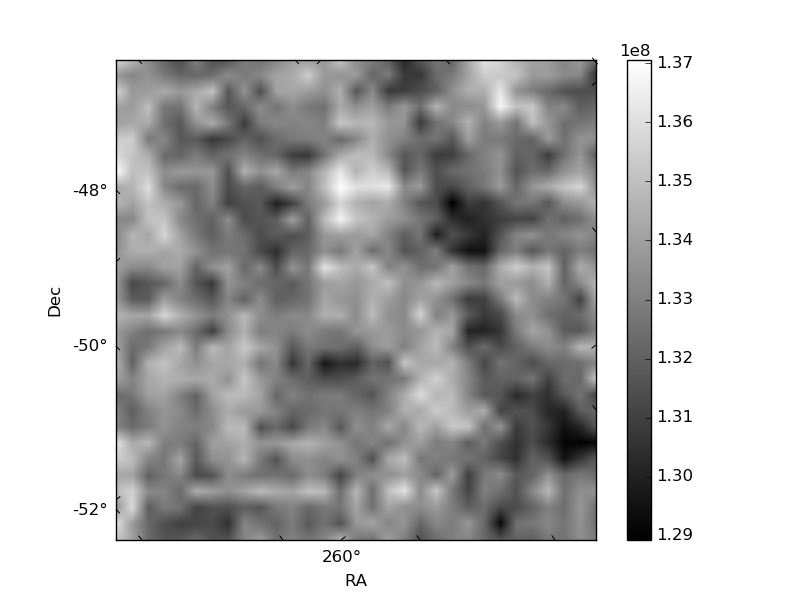
| Quadrant A | 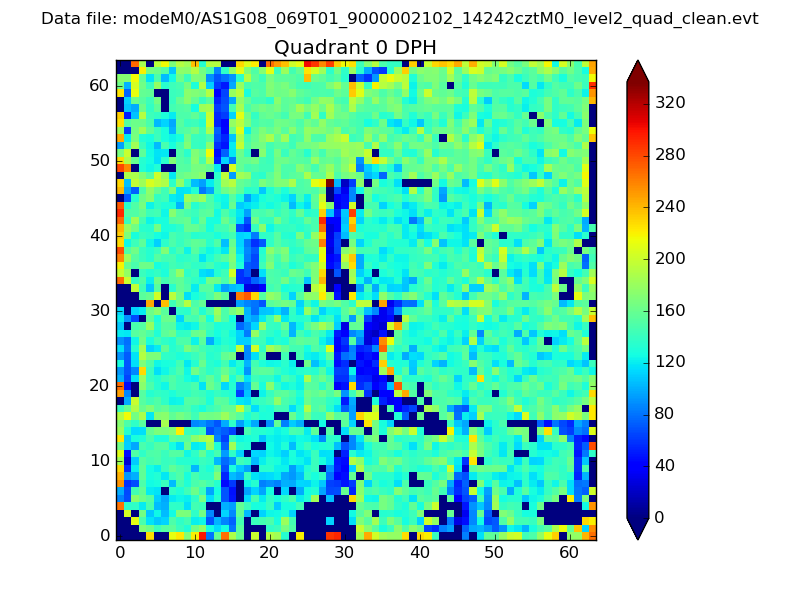 |
 |
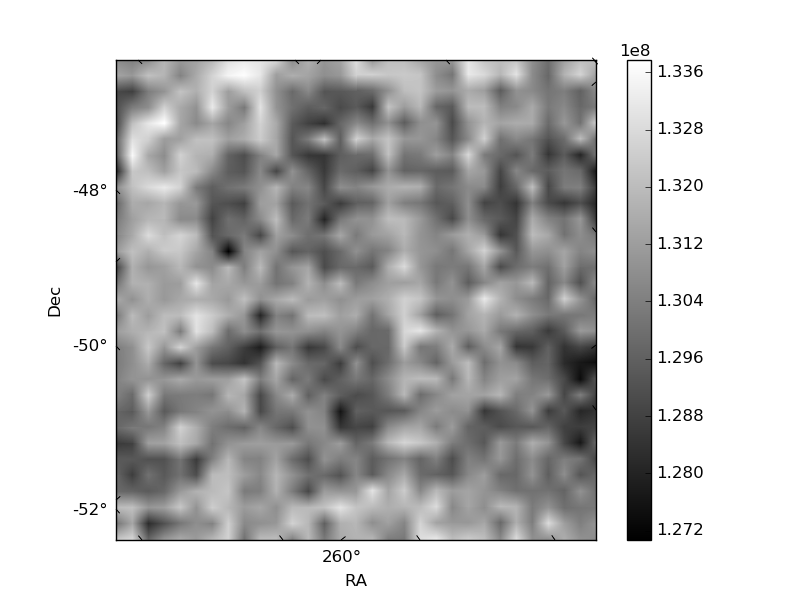
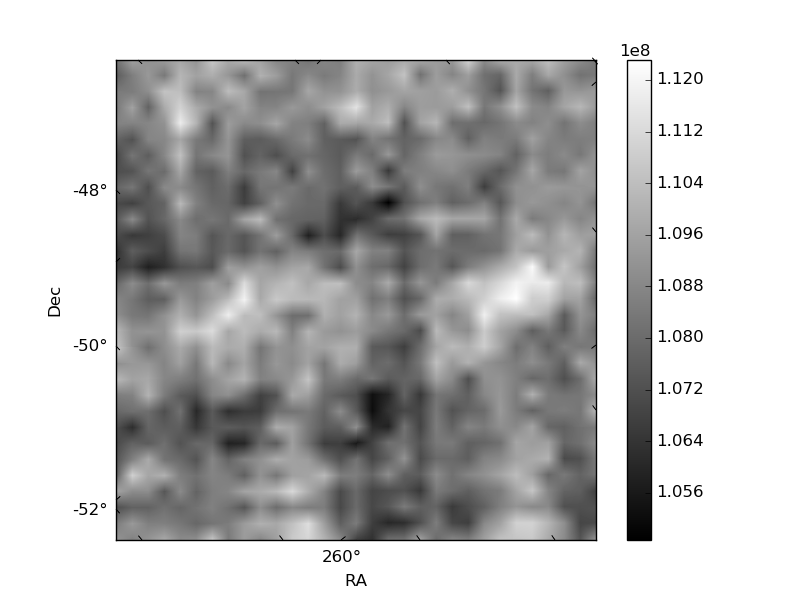
Quadrant B |
|---|---|---|---|
| Quadrant D | 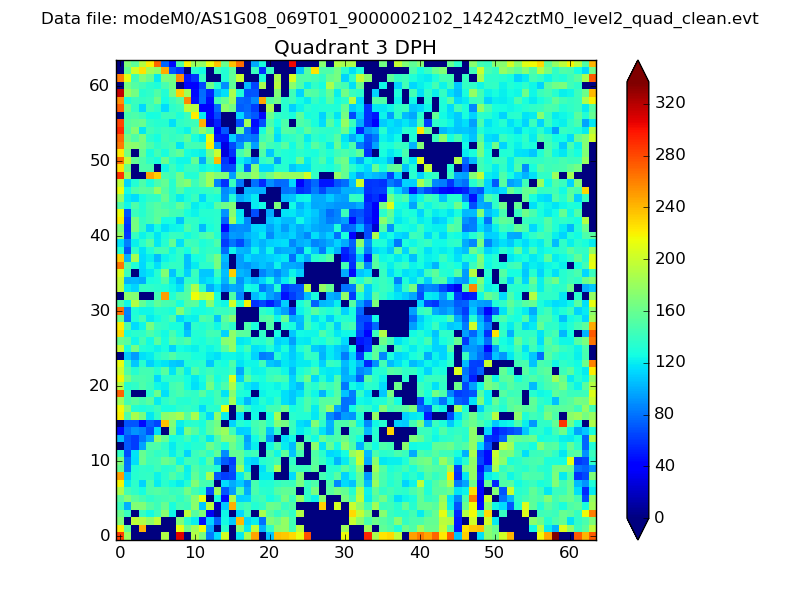 |
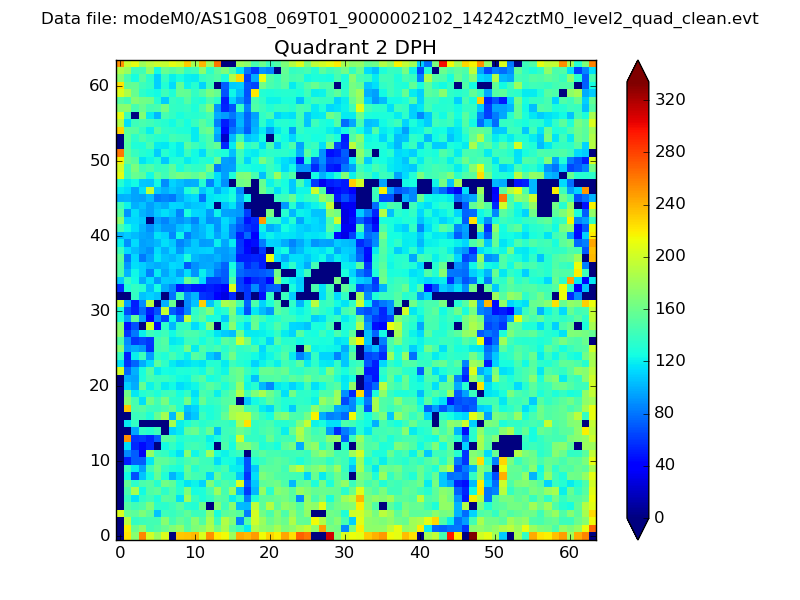 |
Quadrant C |
| Plot type | Count rate plots | Images |
|---|---|---|
| Comparison with Poisson distribution Blue bars denote a histogram of data divided into 1 sec bins. Red curve is a Poisson curve with rate = median count rate of data. |
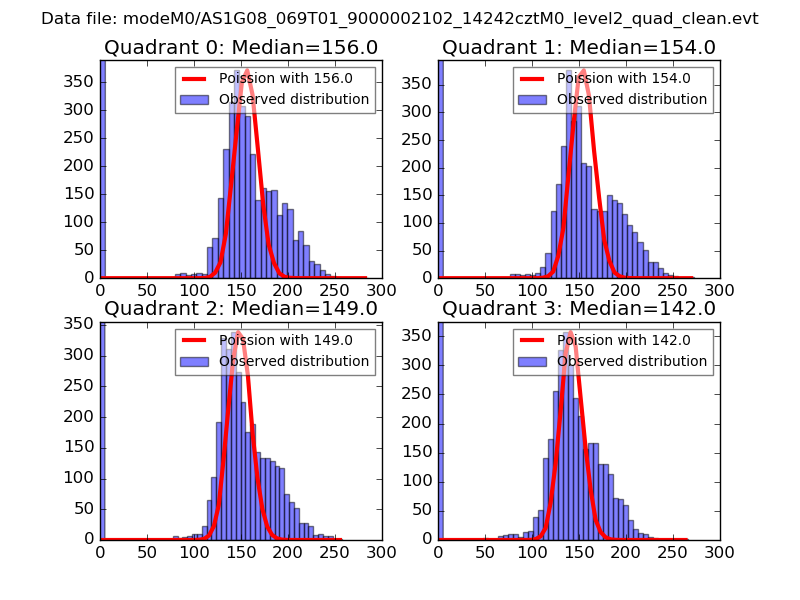 |
 |
| Quadrant-wise count rates Data is divided into 100 sec bins |
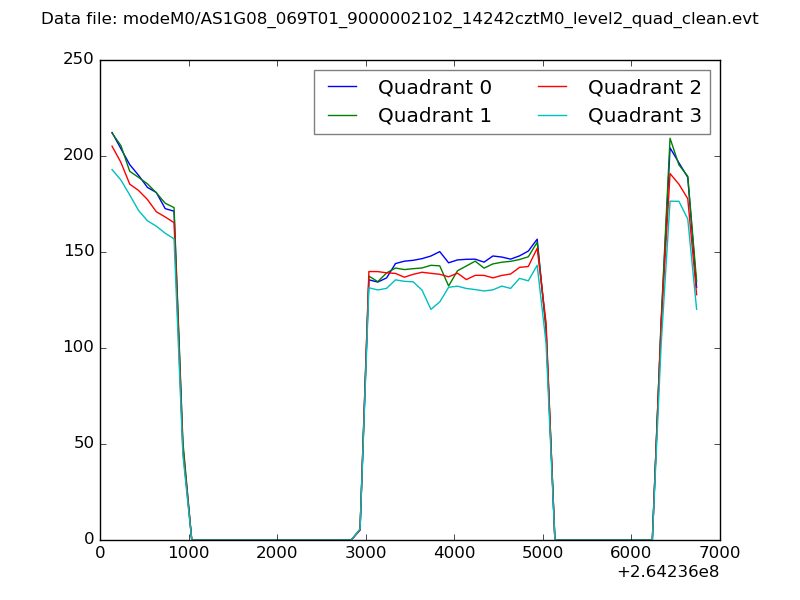 |
|
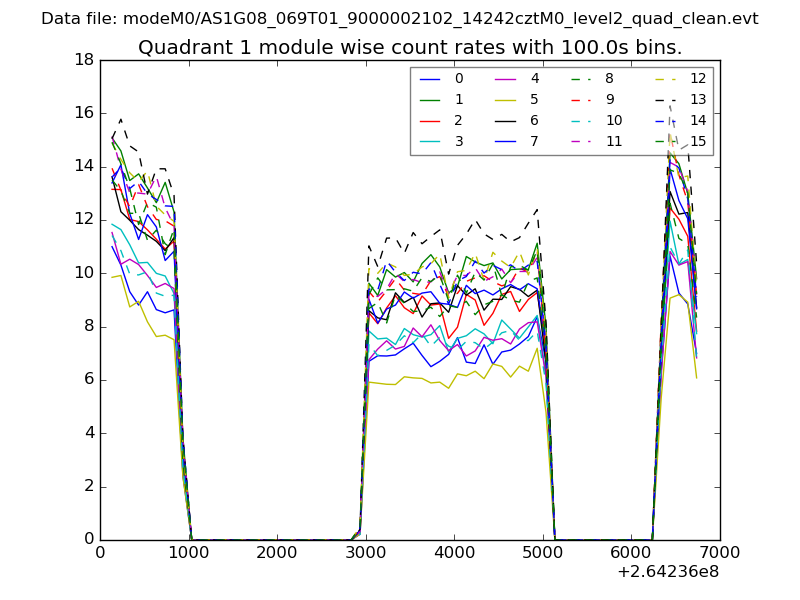
| Module-wise count rates for Quadrant A Data is divided into 100 sec bins |
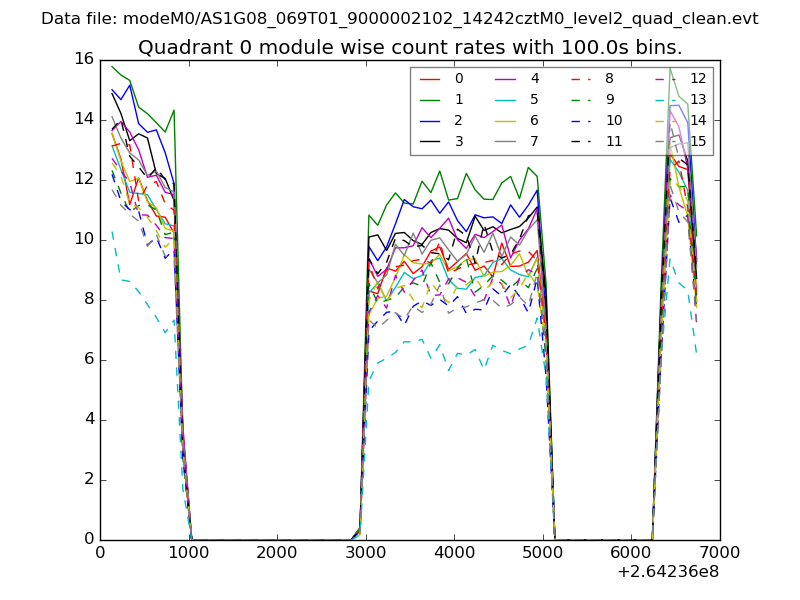 |
 |
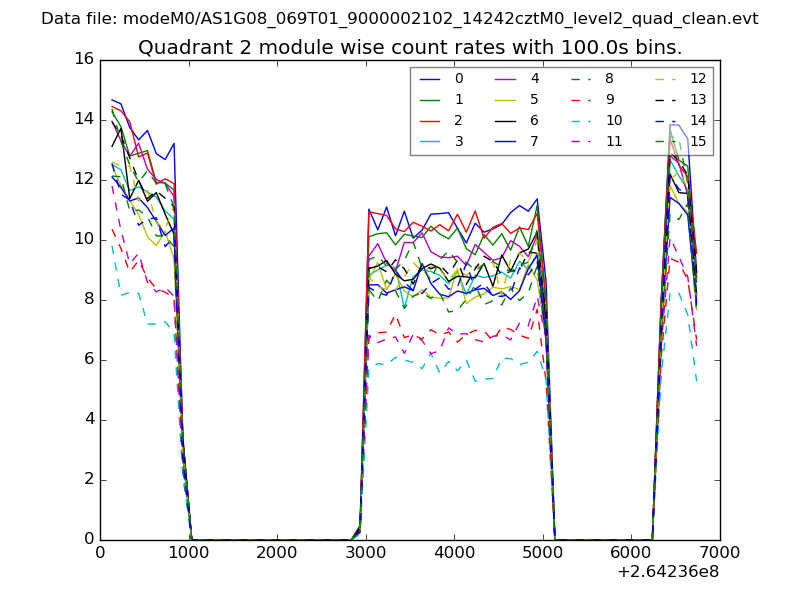
| Module-wise count rates for Quadrant B Data is divided into 100 sec bins |
 |
 |
| Module-wise count rates for Quadrant C Data is divided into 100 sec bins |
 |
 |
| Module-wise count rates for Quadrant D Data is divided into 100 sec bins |
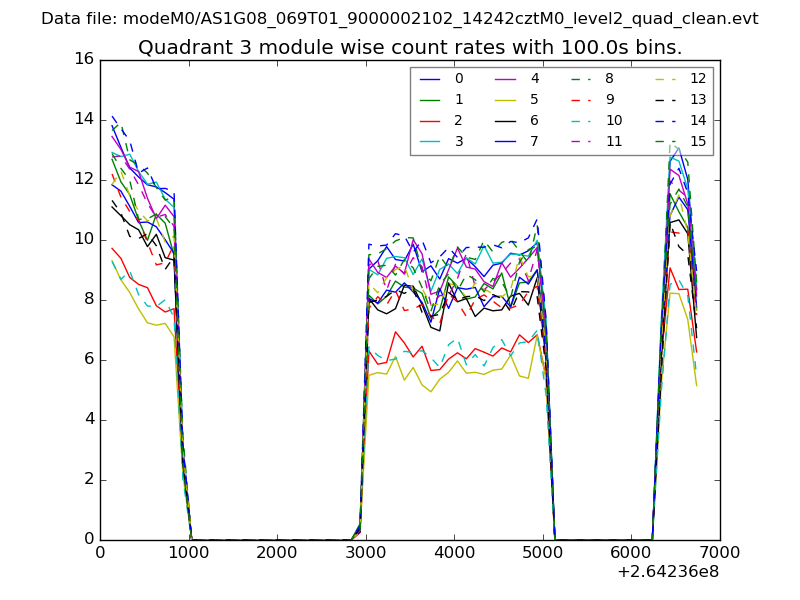 |
 |
| Parameter | Plot |
|---|---|
| CZT HV Monitor | 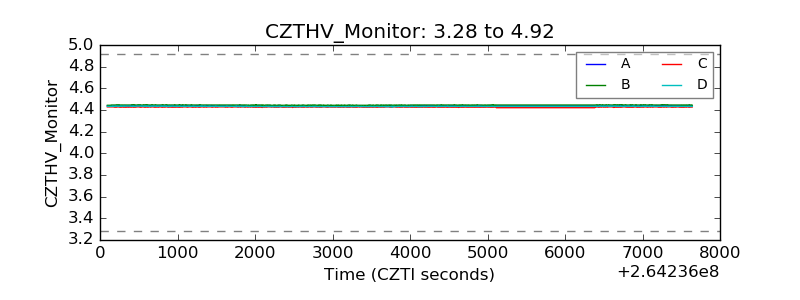 |
| D_VDD | 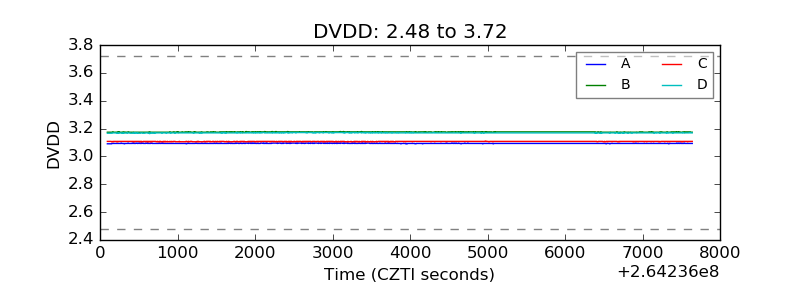 |
| Temperature 1 |  |
| Veto HV Monitor | 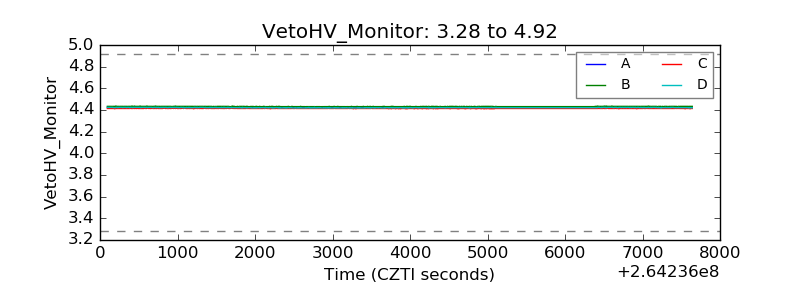 |
| Veto LLD | 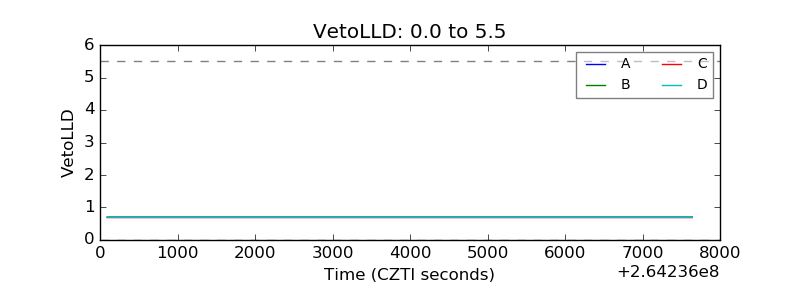 |
| Alpha Counter | 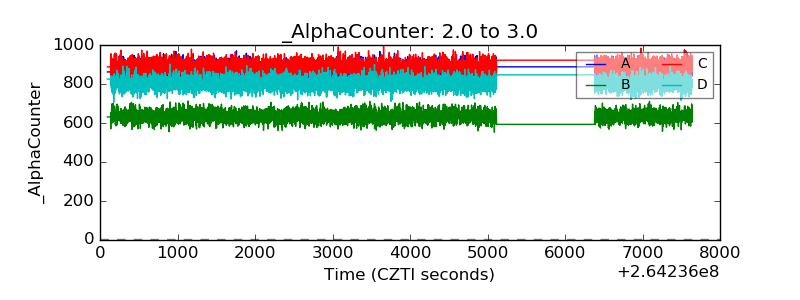 |
| _CPM_Rate | 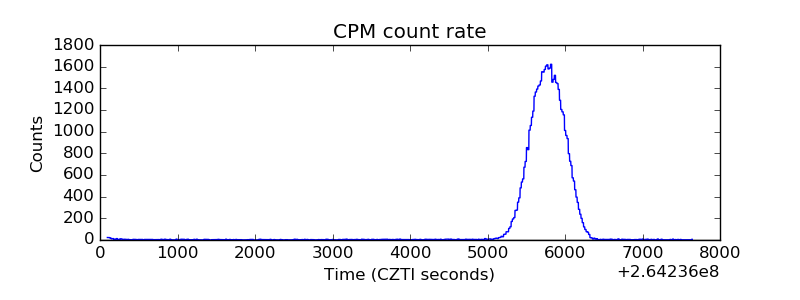 |
| CZT Counter | 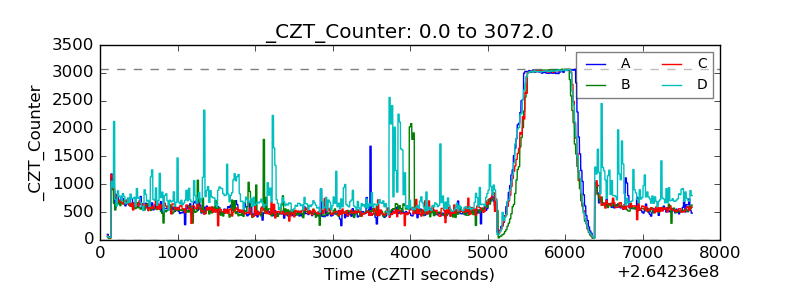 |
| +2.5 Volts monitor |  |
| +5 Volts monitor |  |
| _ROLL_ROT | 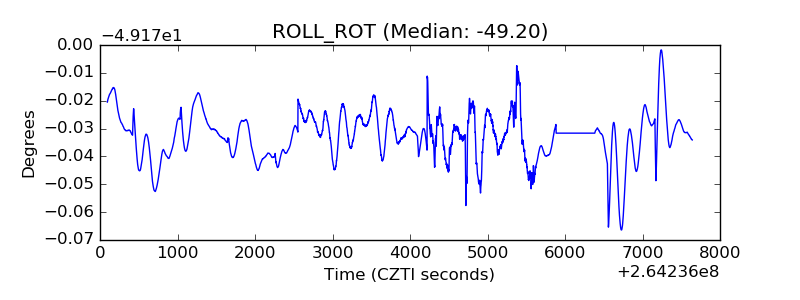 |
| _Roll_DEC | 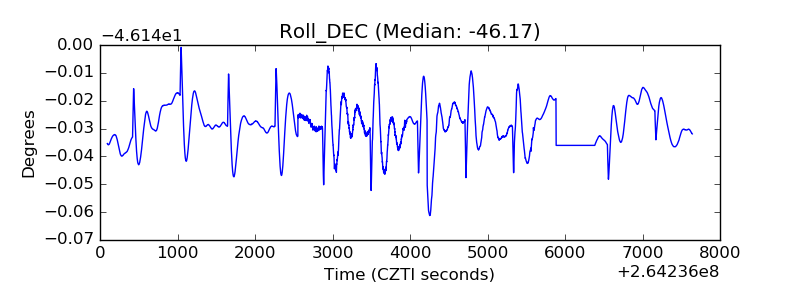 |
| _Roll_RA | 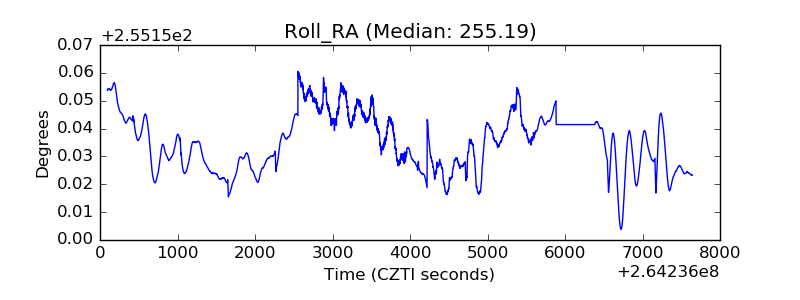 |
| Veto Counter | 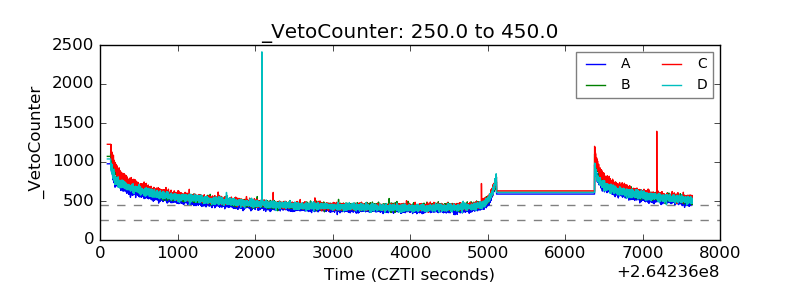 |