| Param | Original file | Final file |
|---|---|---|
| Filename | modeM0/AS1G08_069T01_9000002102_14243cztM0_level2.evt | modeM0/AS1G08_069T01_9000002102_14243cztM0_level2_quad_clean.evt |
| Size (bytes) | 619,459,200 | 68,328,000 |
| Size | 590.8 MB | 65.2 MB |
| Events in quadrant A | 3,639,622 | 440,075 |
| Events in quadrant B | 3,588,050 | 435,082 |
| Events in quadrant C | 3,448,003 | 421,403 |
| Events in quadrant D | 7,667,904 | 341,580 |
| Mode SS | |||
|---|---|---|---|
| Quadrant | BADHDUFLAG | Total packets | Discarded packets |
| A | 0 | 126 | 0 |
| B | 0 | 126 | 0 |
| C | 0 | 126 | 0 |
| D | 0 | 126 | 0 |
| Mode M0 | |||
|---|---|---|---|
| Quadrant | BADHDUFLAG | Total packets | Discarded packets |
| A | 0 | 14658 | 3 |
| B | 0 | 14309 | 2 |
| C | 0 | 14058 | 2 |
| D | 0 | 27234 | 2 |
| Mode M9 | |||
|---|---|---|---|
| Quadrant | BADHDUFLAG | Total packets | Discarded packets |
| A | 0 | 13 | 0 |
| B | 0 | 13 | 0 |
| C | 0 | 13 | 0 |
| D | 0 | 13 | 0 |
| Quadrant | Total seconds | Saturated seconds | Saturation percentage |
|---|---|---|---|
| A | 6161 | 107 | 1.736731% |
| B | 6161 | 184 | 2.986528% |
| C | 6161 | 50 | 0.811557% |
| D | 6161 | 1080 | 17.529622% |
Noise dominated data is calculated using 1-second bins in cleaned event files. If a bin has >2000 counts, and if more than 50% of those come from <1% of pixels, then it is considered to be noise-dominated and hence unusable.
| Quadrant | # 1 sec bins | Bins with >0 counts | Bins with >2000 counts | High rate bins dominated by noise | Noise dominated (total time) | Noise dominated (detector-on time) | Marked lightcurve |
|---|---|---|---|---|---|---|---|
| A | 7487 | 6163 | 16 | 16 | 0.21% | 0.26% |  |
| B | 7487 | 6163 | 67 | 67 | 0.89% | 1.09% | 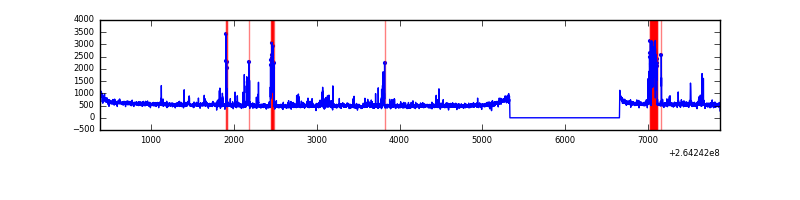 |
| C | 7487 | 6163 | 1 | 1 | 0.01% | 0.02% | 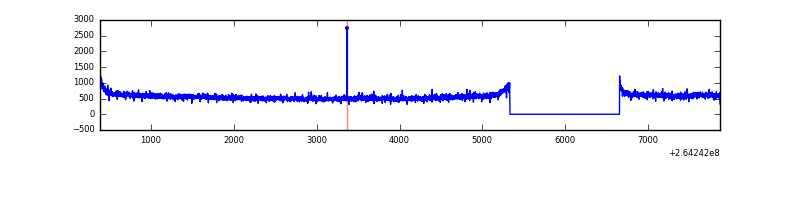 |
| D | 7487 | 6163 | 864 | 864 | 11.54% | 14.02% | 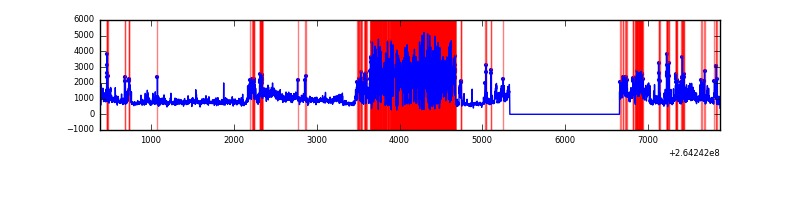 |
Top three noisy pixels from each quadrant. If the there are fewer than three noisy pixels in the level2.evt file, extra rows are filled as -1
| Pixel properties | Quadrant properties | ||||||
|---|---|---|---|---|---|---|---|
| Quadrant | DetID | PixID | Counts | Sigma | Mean | Median | Sigma |
| A | 12 | 189 | 288004 | 1759.49 | 829 | 815 | 163.2 |
| A | 9 | 143 | 149761 | 912.53 | 829 | 815 | 163.2 |
| A | 8 | 15 | 9083 | 50.65 | 829 | 815 | 163.2 |
| B | 0 | 229 | 193946 | 1276.07 | 813 | 796 | 151.4 |
| B | 15 | 201 | 159054 | 1045.55 | 813 | 796 | 151.4 |
| B | 4 | 97 | 26886 | 172.37 | 813 | 796 | 151.4 |
| C | 3 | 233 | 327047 | 1803.55 | 799 | 805 | 180.9 |
| C | 13 | 61 | 5641 | 26.73 | 799 | 805 | 180.9 |
| C | 10 | 22 | 5629 | 26.67 | 799 | 805 | 180.9 |
| D | 1 | 52 | 1929046 | 10972.21 | 747 | 731 | 175.7 |
| D | 13 | 122 | 1068571 | 6076.06 | 747 | 731 | 175.7 |
| D | 5 | 222 | 742659 | 4221.61 | 747 | 731 | 175.7 |
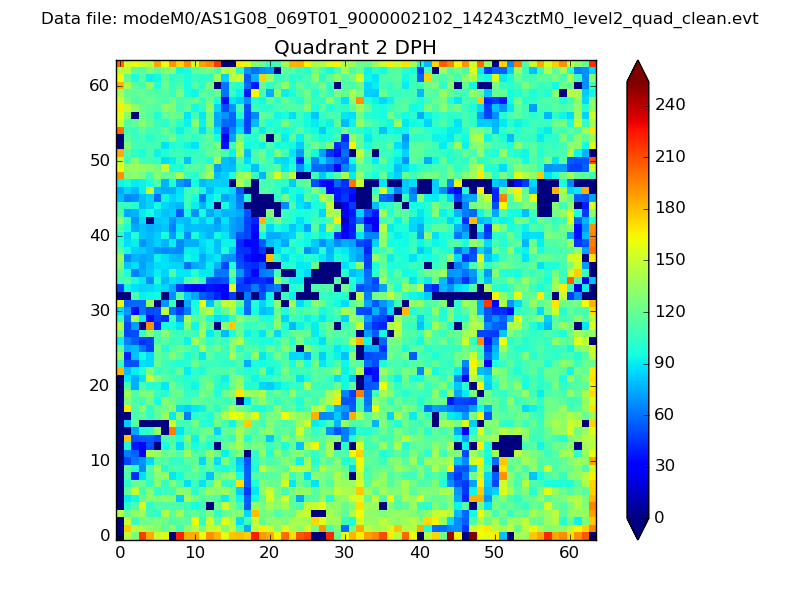
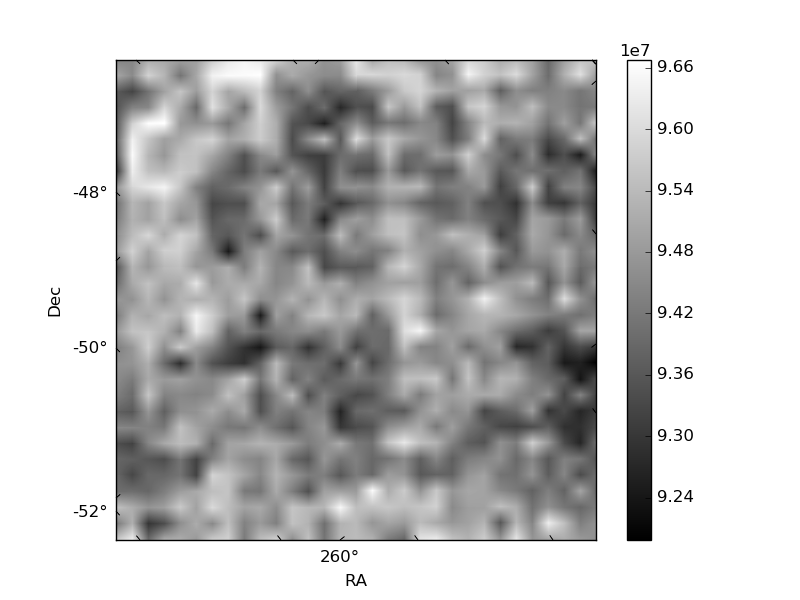
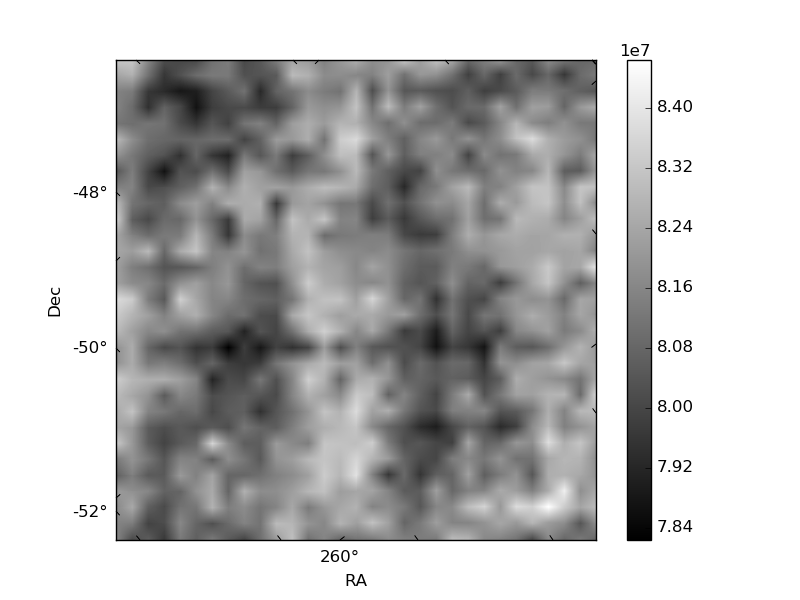
Histogram calculated using DETX and DETY for each event in the final _common_clean file
| Quadrant A | 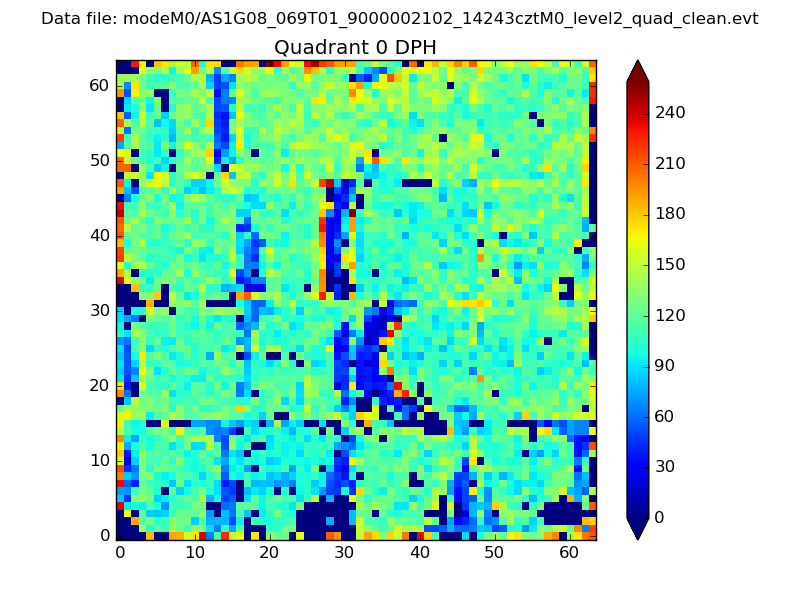 |
 |
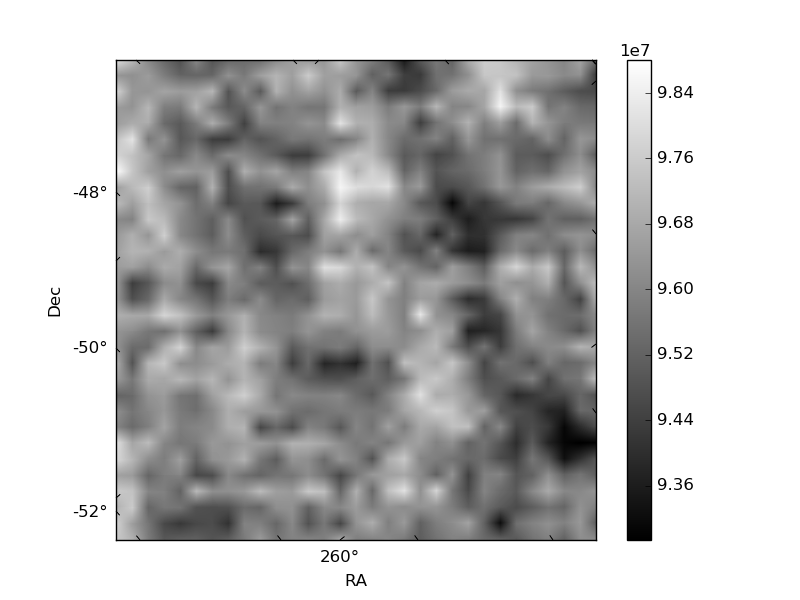
Quadrant B |
|---|---|---|---|
| Quadrant D | 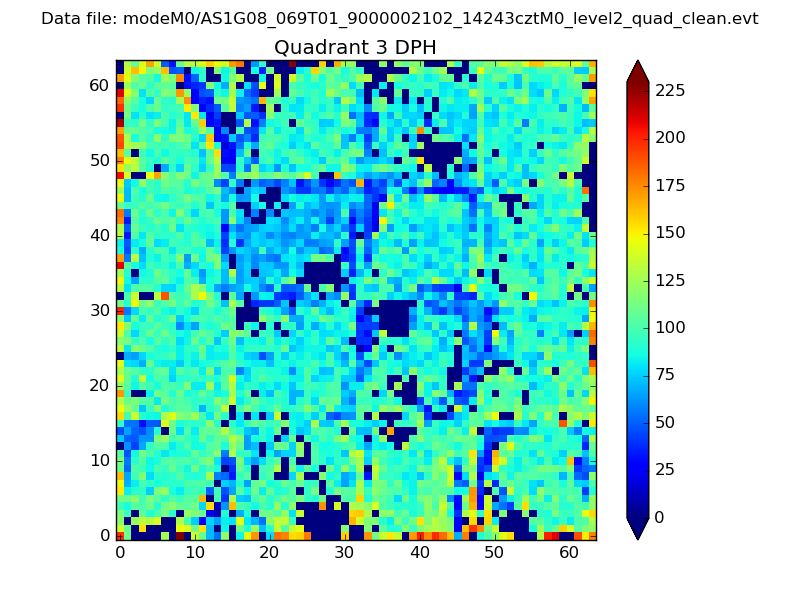 |
 |
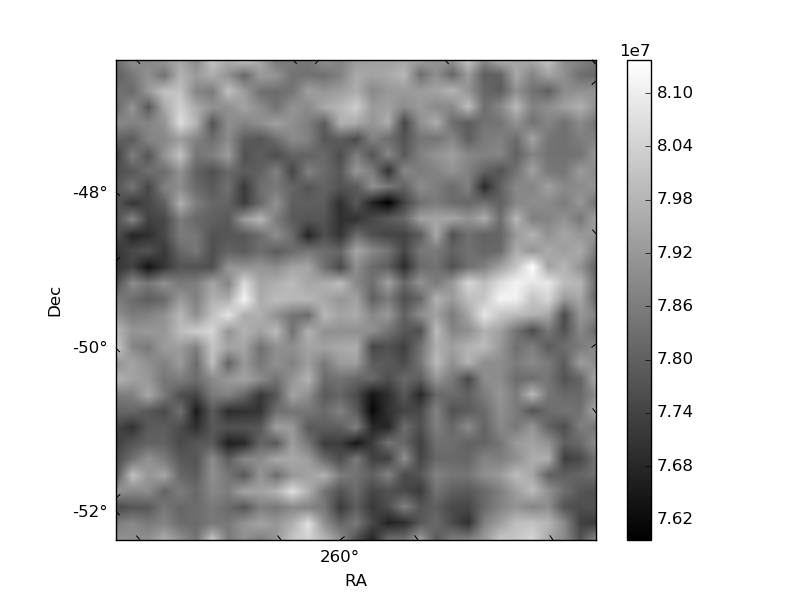
Quadrant C |
| Plot type | Count rate plots | Images |
|---|---|---|
| Comparison with Poisson distribution Blue bars denote a histogram of data divided into 1 sec bins. Red curve is a Poisson curve with rate = median count rate of data. |
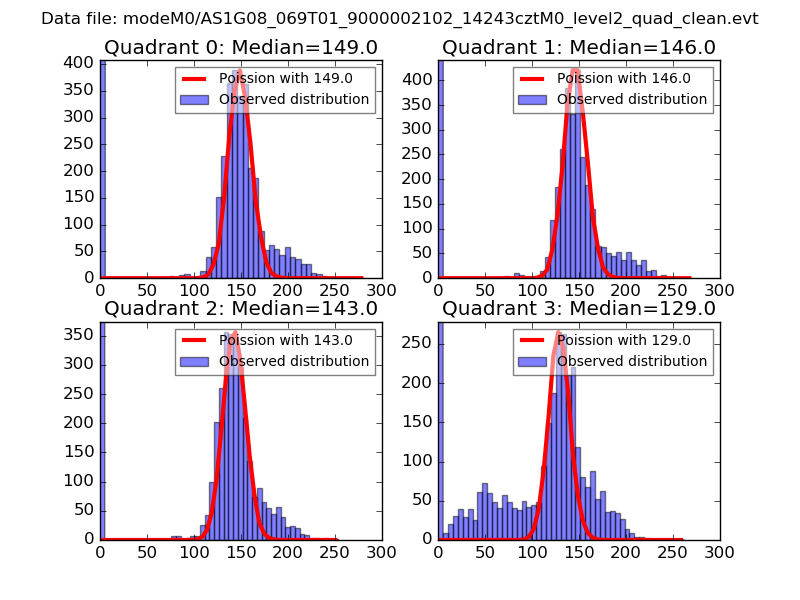 |
 |
| Quadrant-wise count rates Data is divided into 100 sec bins |
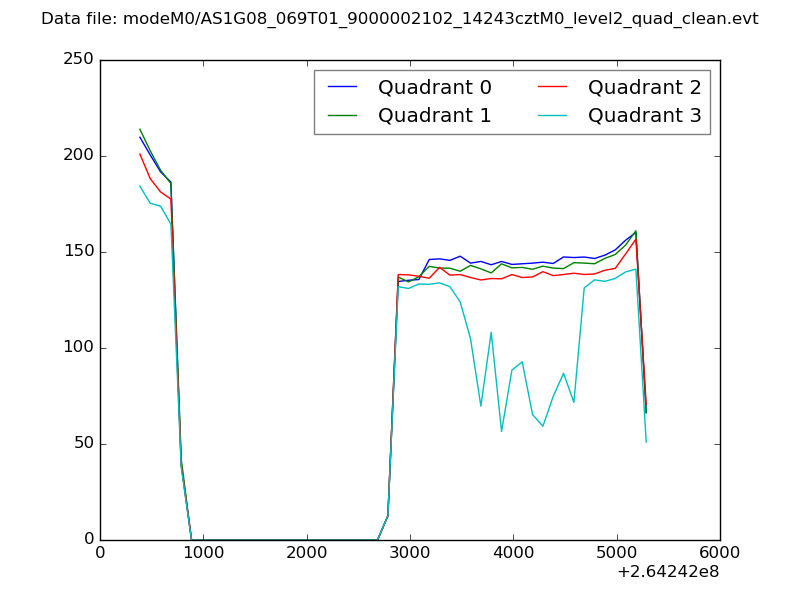 |
|
| Module-wise count rates for Quadrant A Data is divided into 100 sec bins |
 |
 |
| Module-wise count rates for Quadrant B Data is divided into 100 sec bins |
 |
 |
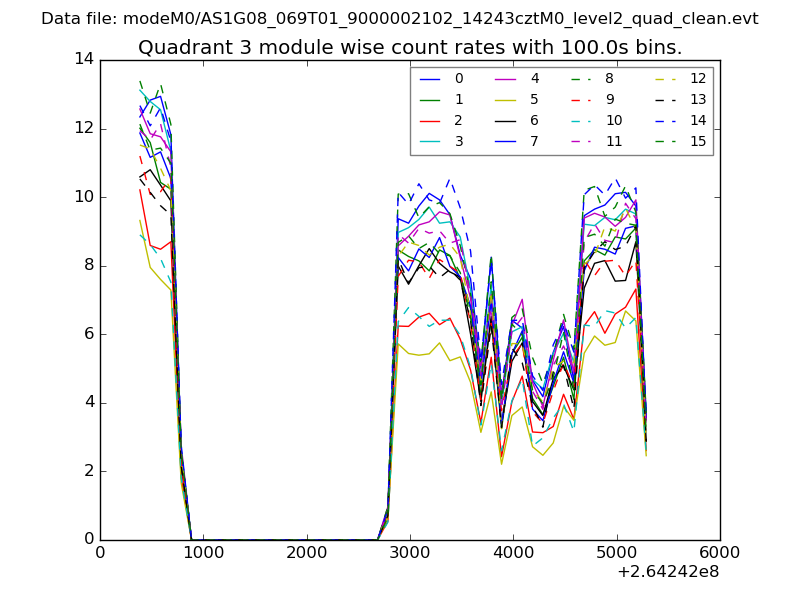
| Module-wise count rates for Quadrant C Data is divided into 100 sec bins |
 |
 |
| Module-wise count rates for Quadrant D Data is divided into 100 sec bins |
 |
 |
| Parameter | Plot |
|---|---|
| CZT HV Monitor | 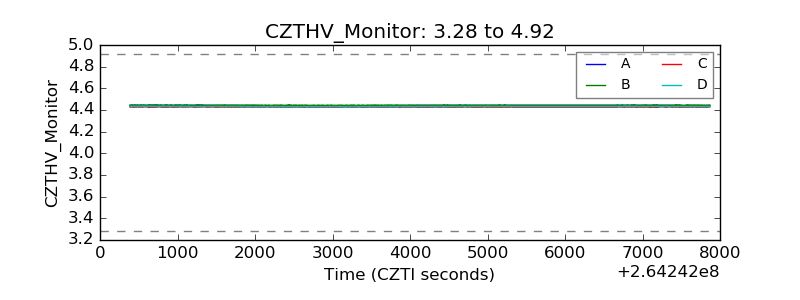 |
| D_VDD | 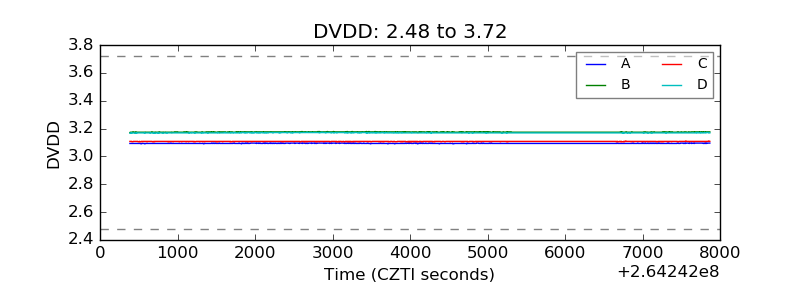 |
| Temperature 1 | 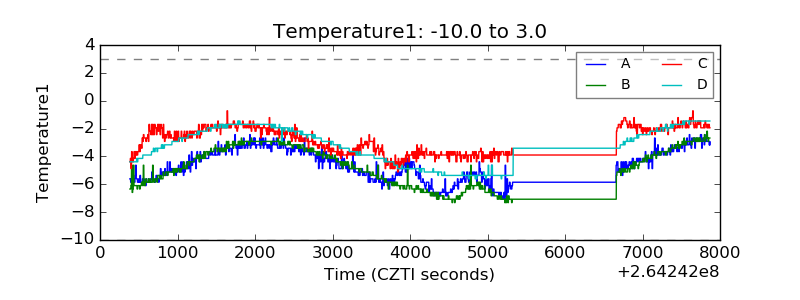 |
| Veto HV Monitor | 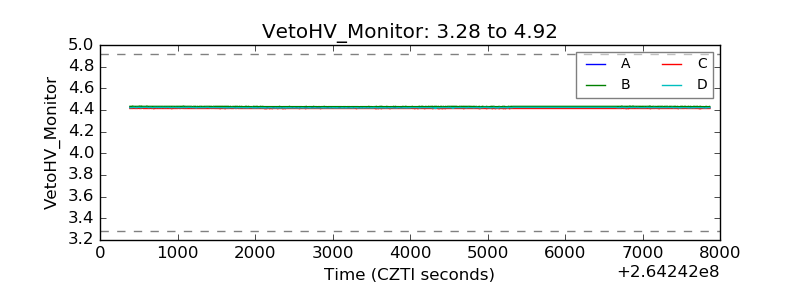 |
| Veto LLD | 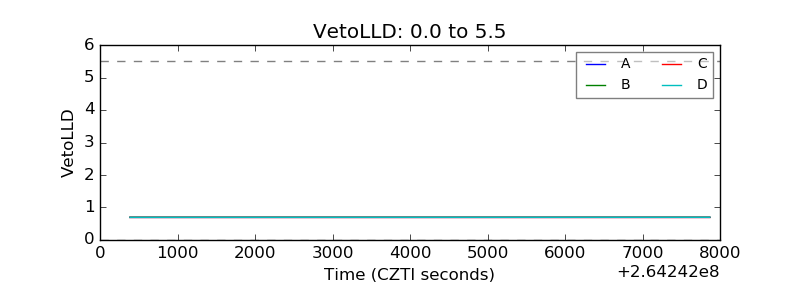 |
| Alpha Counter |  |
| _CPM_Rate | 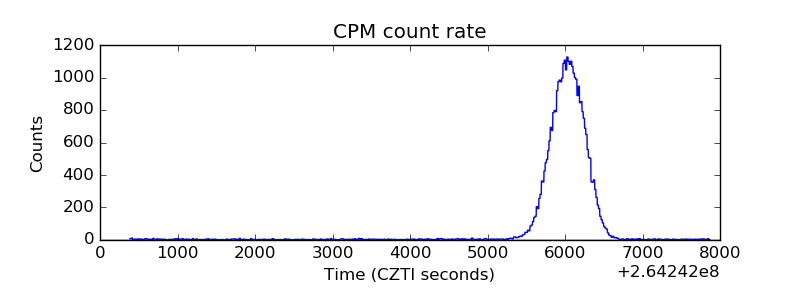 |
| CZT Counter |  |
| +2.5 Volts monitor |  |
| +5 Volts monitor |  |
| _ROLL_ROT | 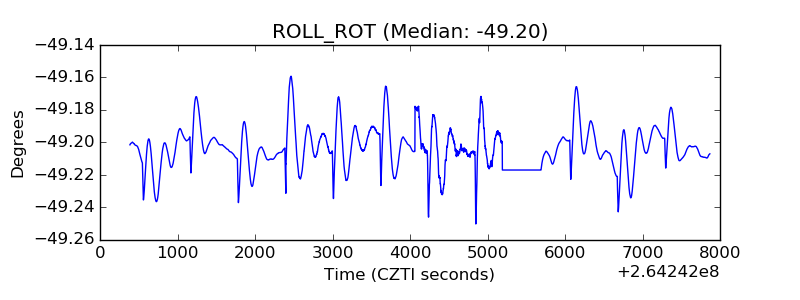 |
| _Roll_DEC | 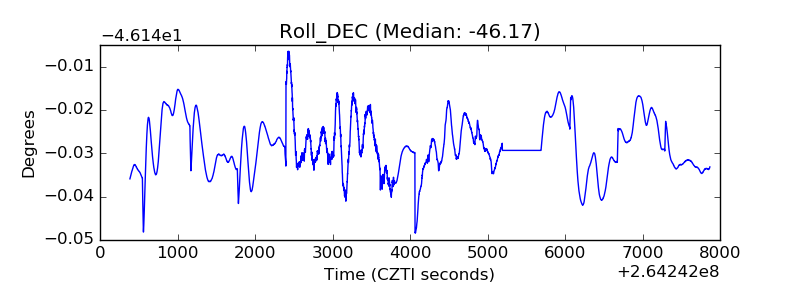 |
| _Roll_RA |  |
| Veto Counter | 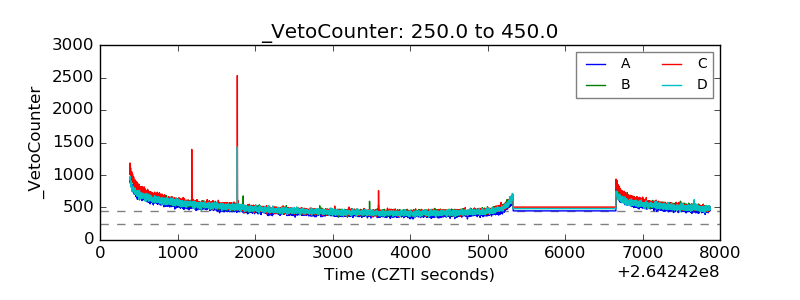 |