| Param | Original file | Final file |
|---|---|---|
| Filename | modeM0/AS1G08_069T01_9000002102_14244cztM0_level2.evt | modeM0/AS1G08_069T01_9000002102_14244cztM0_level2_quad_clean.evt |
| Size (bytes) | 579,830,400 | 71,032,320 |
| Size | 553.0 MB | 67.7 MB |
| Events in quadrant A | 3,753,083 | 436,181 |
| Events in quadrant B | 3,846,125 | 427,278 |
| Events in quadrant C | 3,787,096 | 415,706 |
| Events in quadrant D | 5,714,258 | 398,552 |
| Mode SS | |||
|---|---|---|---|
| Quadrant | BADHDUFLAG | Total packets | Discarded packets |
| A | 0 | 138 | 0 |
| B | 0 | 138 | 0 |
| C | 0 | 138 | 0 |
| D | 0 | 138 | 0 |
| Mode M0 | |||
|---|---|---|---|
| Quadrant | BADHDUFLAG | Total packets | Discarded packets |
| A | 0 | 15259 | 3 |
| B | 0 | 15513 | 2 |
| C | 0 | 15562 | 2 |
| D | 0 | 21954 | 2 |
| Mode M9 | |||
|---|---|---|---|
| Quadrant | BADHDUFLAG | Total packets | Discarded packets |
| A | 0 | 20 | 0 |
| B | 0 | 20 | 0 |
| C | 0 | 20 | 0 |
| D | 0 | 21 | 0 |
| Quadrant | Total seconds | Saturated seconds | Saturation percentage |
|---|---|---|---|
| A | 6786 | 196 | 2.888299% |
| B | 6786 | 290 | 4.273504% |
| C | 6786 | 120 | 1.768347% |
| D | 6786 | 358 | 5.275567% |
Noise dominated data is calculated using 1-second bins in cleaned event files. If a bin has >2000 counts, and if more than 50% of those come from <1% of pixels, then it is considered to be noise-dominated and hence unusable.
| Quadrant | # 1 sec bins | Bins with >0 counts | Bins with >2000 counts | High rate bins dominated by noise | Noise dominated (total time) | Noise dominated (detector-on time) | Marked lightcurve |
|---|---|---|---|---|---|---|---|
| A | 7882 | 6787 | 21 | 21 | 0.27% | 0.31% | 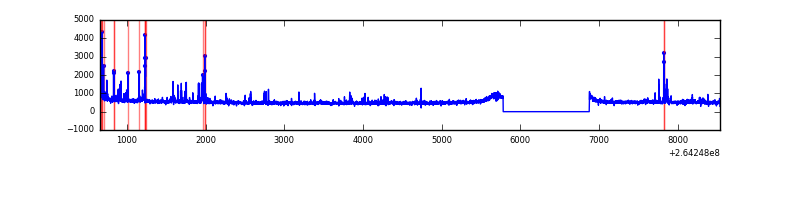 |
| B | 7882 | 6787 | 88 | 88 | 1.12% | 1.30% | 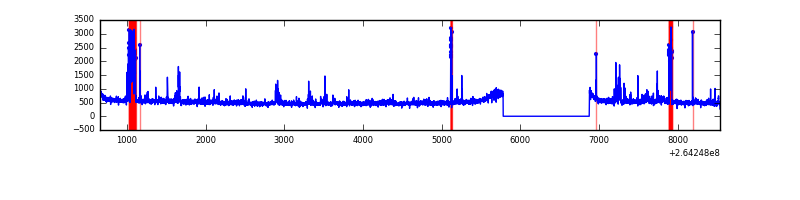 |
| C | 7882 | 6788 | 1 | 1 | 0.01% | 0.01% | 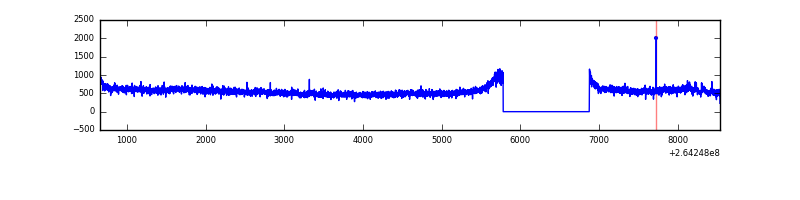 |
| D | 7882 | 6787 | 166 | 166 | 2.11% | 2.45% | 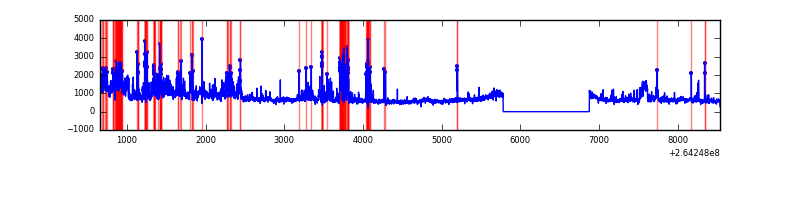 |
Top three noisy pixels from each quadrant. If the there are fewer than three noisy pixels in the level2.evt file, extra rows are filled as -1
| Pixel properties | Quadrant properties | ||||||
|---|---|---|---|---|---|---|---|
| Quadrant | DetID | PixID | Counts | Sigma | Mean | Median | Sigma |
| A | 9 | 143 | 243961 | 1373.01 | 886 | 868 | 177.1 |
| A | 12 | 189 | 75223 | 419.96 | 886 | 868 | 177.1 |
| A | 8 | 15 | 21754 | 117.97 | 886 | 868 | 177.1 |
| B | 15 | 201 | 184644 | 1125.47 | 868 | 848 | 163.3 |
| B | 0 | 229 | 176128 | 1073.32 | 868 | 848 | 163.3 |
| B | 0 | 189 | 45896 | 275.85 | 868 | 848 | 163.3 |
| C | 3 | 233 | 449069 | 2282.7 | 855 | 859 | 196.4 |
| C | 13 | 61 | 6195 | 27.18 | 855 | 859 | 196.4 |
| C | 14 | 234 | 4795 | 20.05 | 855 | 859 | 196.4 |
| D | 8 | 195 | 866812 | 4301.38 | 848 | 827 | 201.3 |
| D | 5 | 222 | 863067 | 4282.78 | 848 | 827 | 201.3 |
| D | 13 | 122 | 427840 | 2120.99 | 848 | 827 | 201.3 |
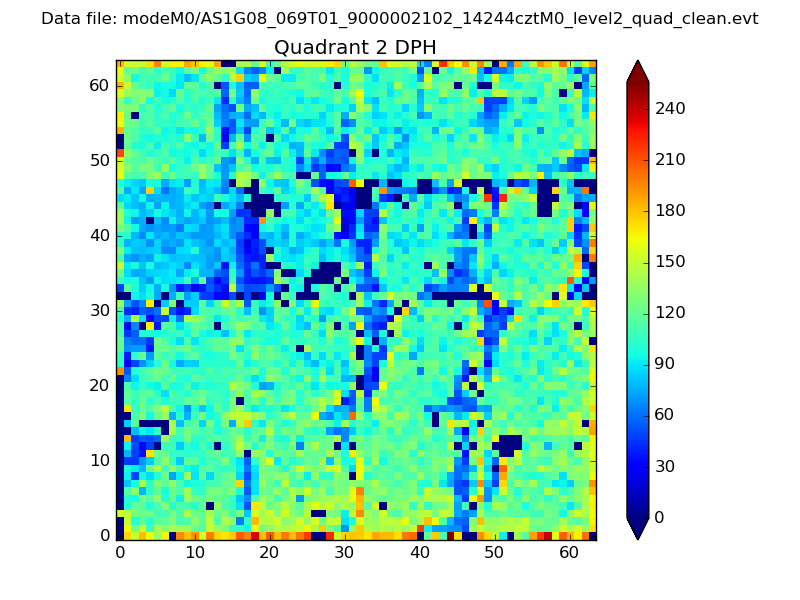
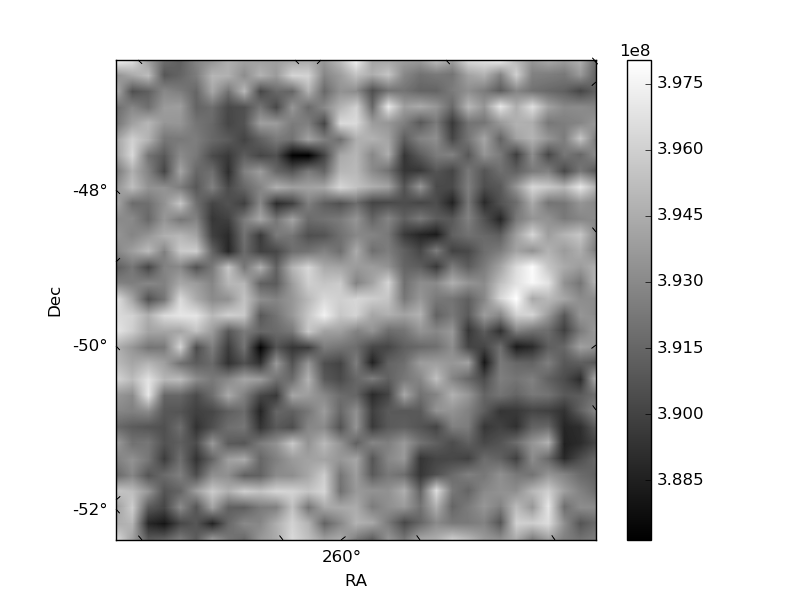
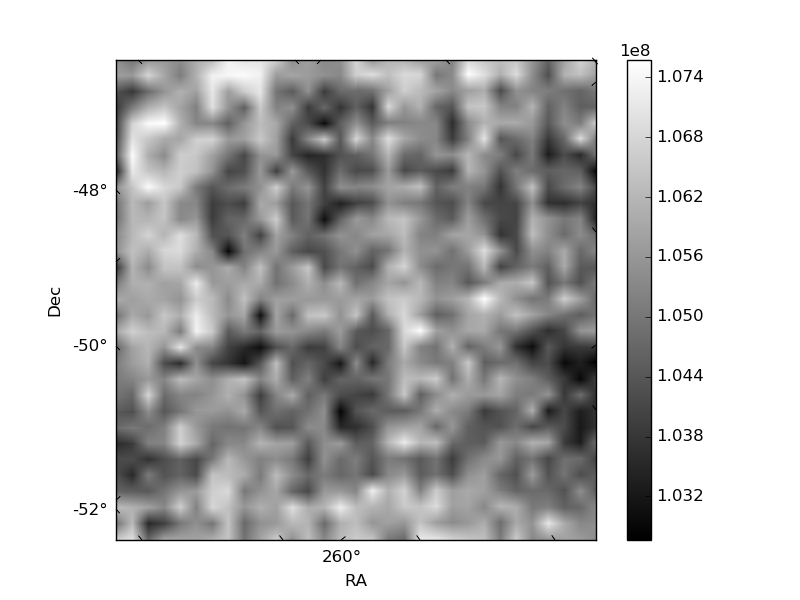
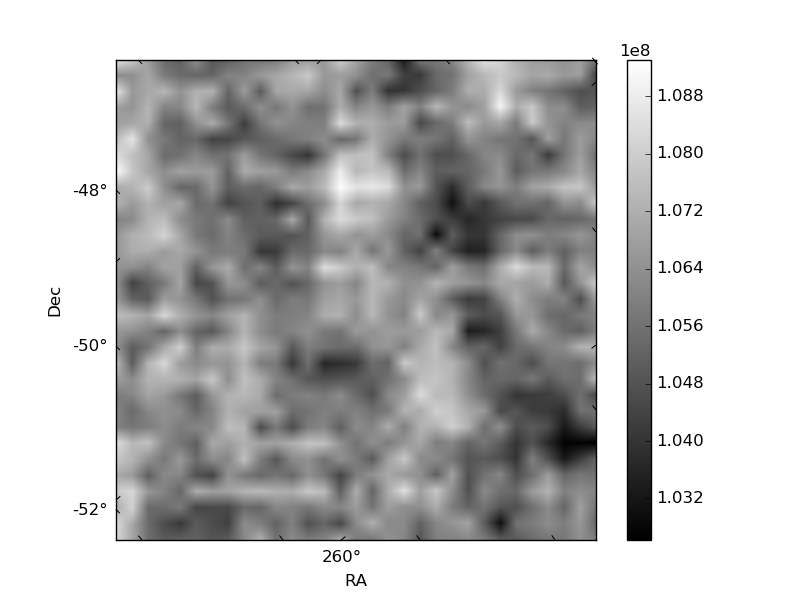
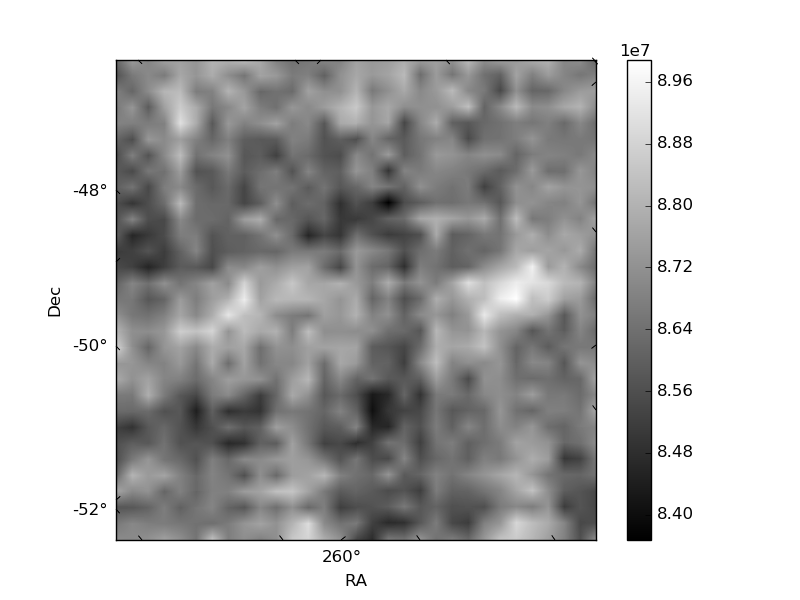
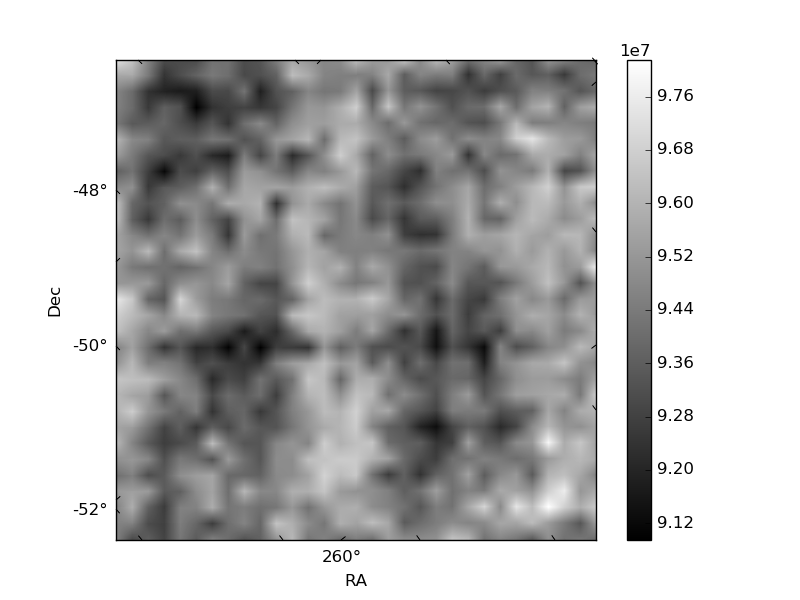
Histogram calculated using DETX and DETY for each event in the final _common_clean file
| Quadrant A | 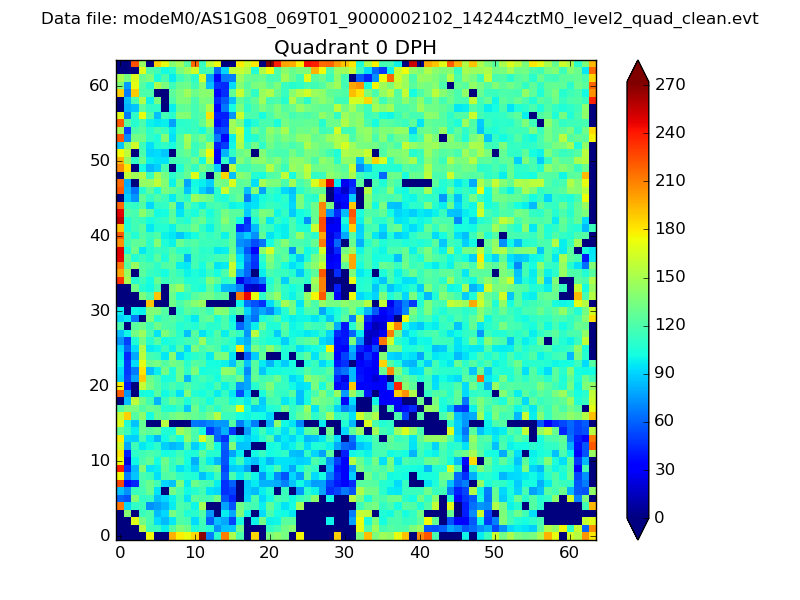 |
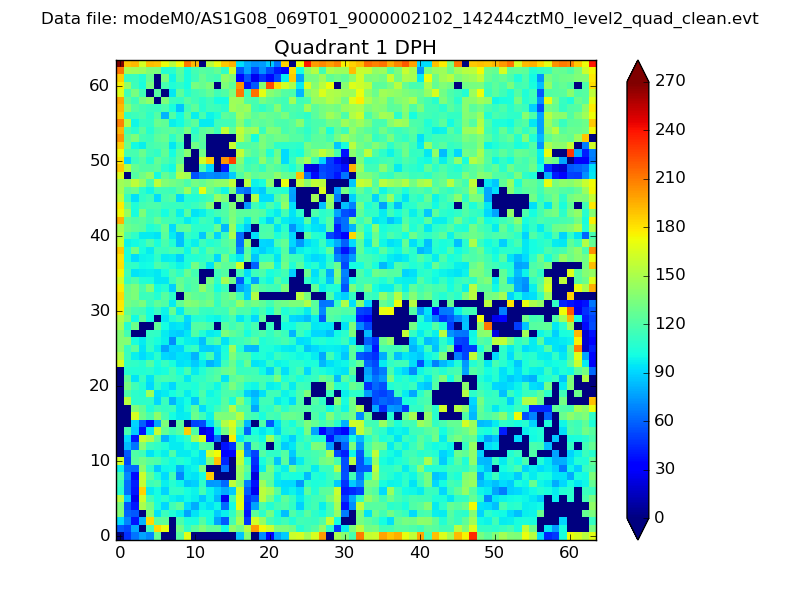 |
Quadrant B |
|---|---|---|---|
| Quadrant D | 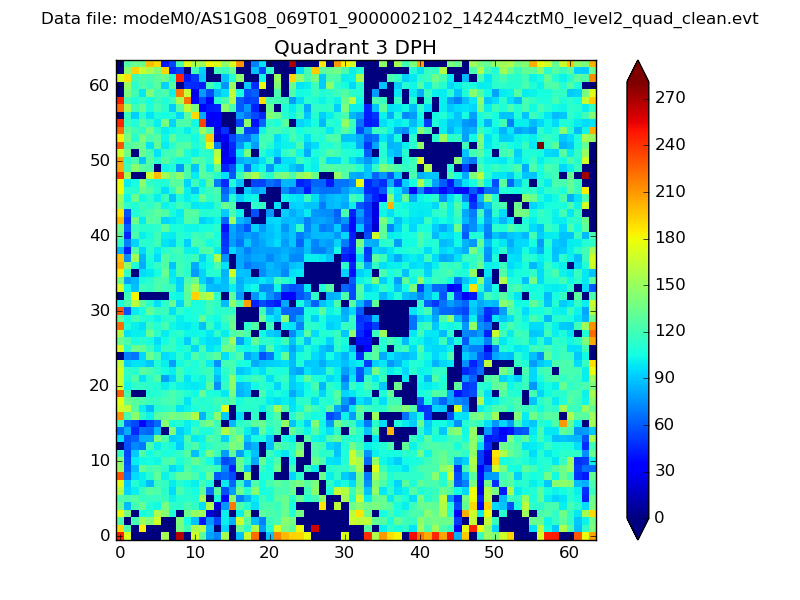 |
 |
Quadrant C |
| Plot type | Count rate plots | Images |
|---|---|---|
| Comparison with Poisson distribution Blue bars denote a histogram of data divided into 1 sec bins. Red curve is a Poisson curve with rate = median count rate of data. |
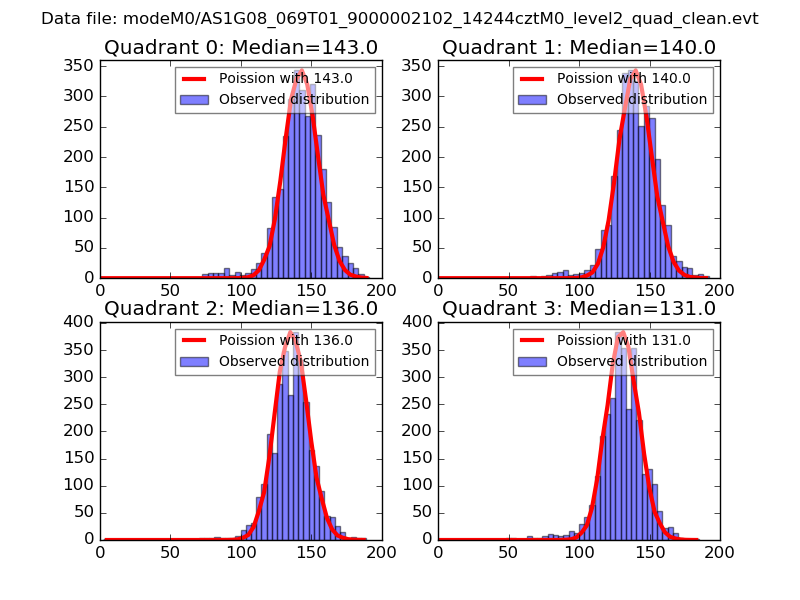 |
 |
| Quadrant-wise count rates Data is divided into 100 sec bins |
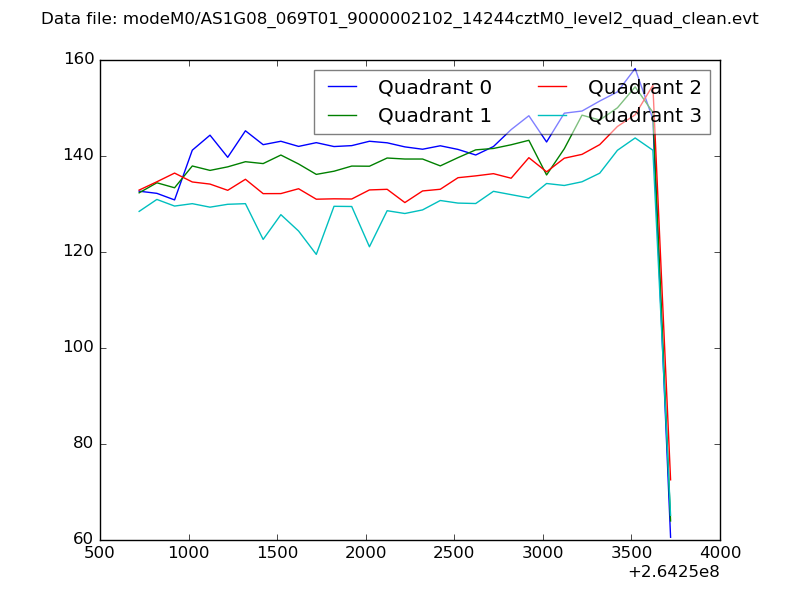 |
|
| Module-wise count rates for Quadrant A Data is divided into 100 sec bins |
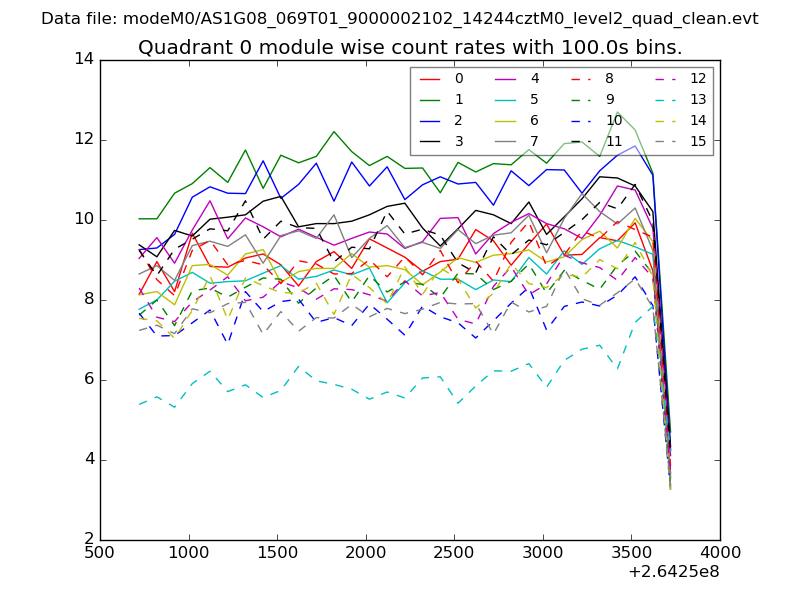 |
 |
| Module-wise count rates for Quadrant B Data is divided into 100 sec bins |
 |
 |
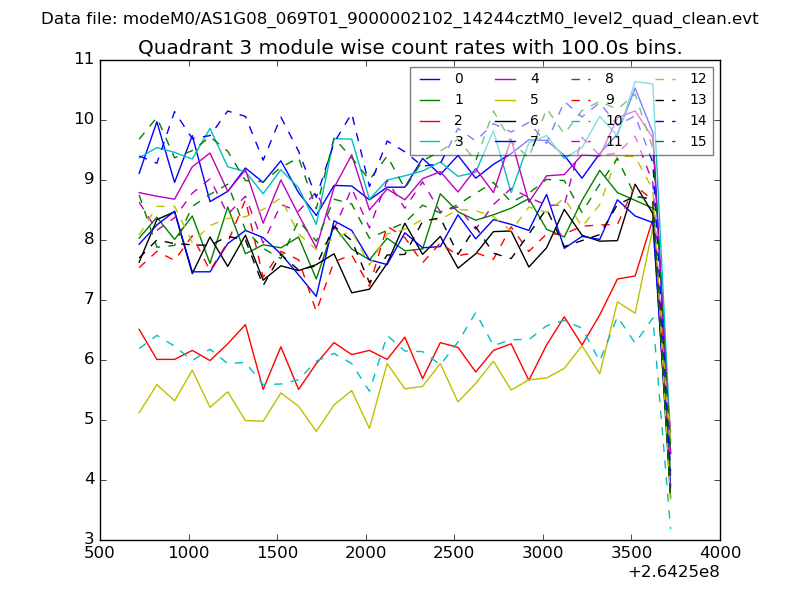
| Module-wise count rates for Quadrant C Data is divided into 100 sec bins |
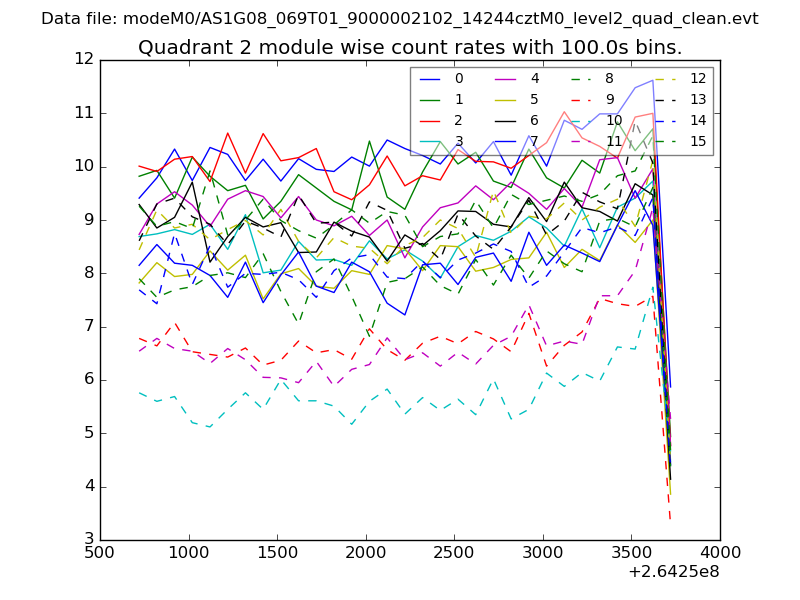 |
 |
| Module-wise count rates for Quadrant D Data is divided into 100 sec bins |
 |
 |
| Parameter | Plot |
|---|---|
| CZT HV Monitor | 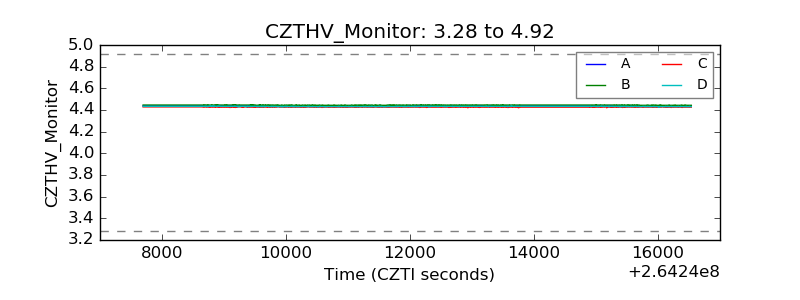 |
| D_VDD |  |
| Temperature 1 | 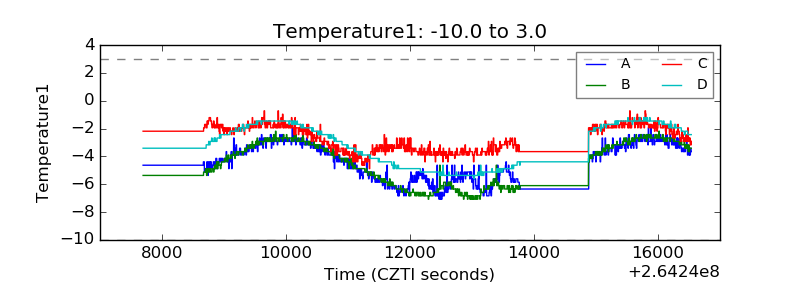 |
| Veto HV Monitor | 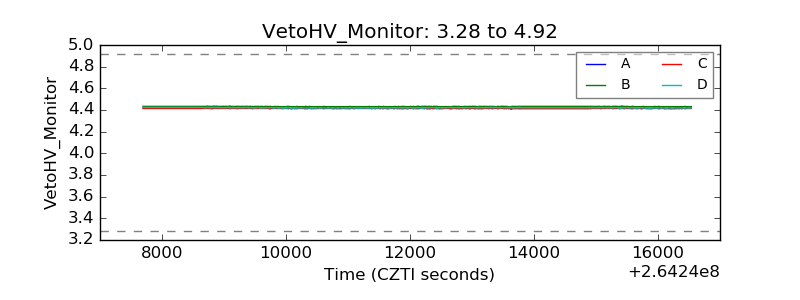 |
| Veto LLD | 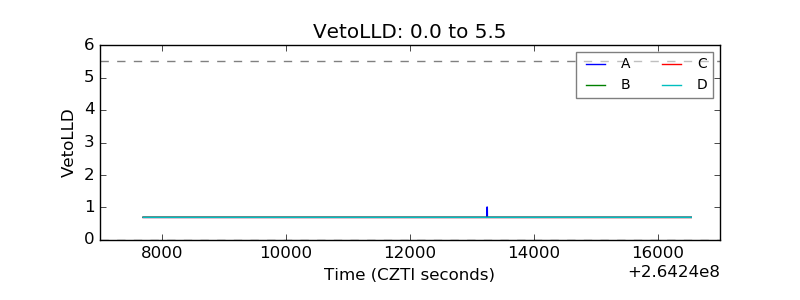 |
| Alpha Counter | 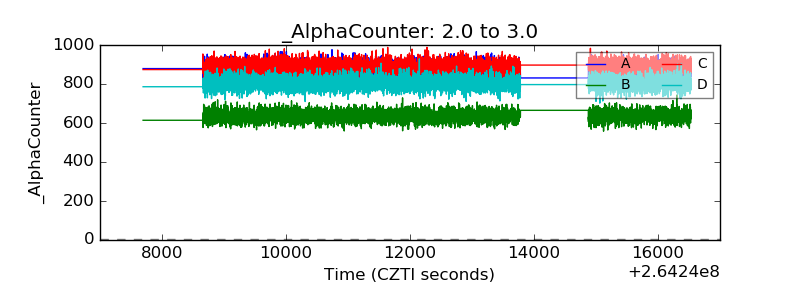 |
| _CPM_Rate | 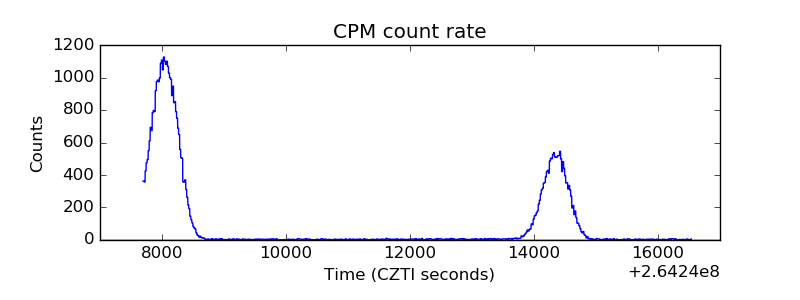 |
| CZT Counter |  |
| +2.5 Volts monitor |  |
| +5 Volts monitor |  |
| _ROLL_ROT | 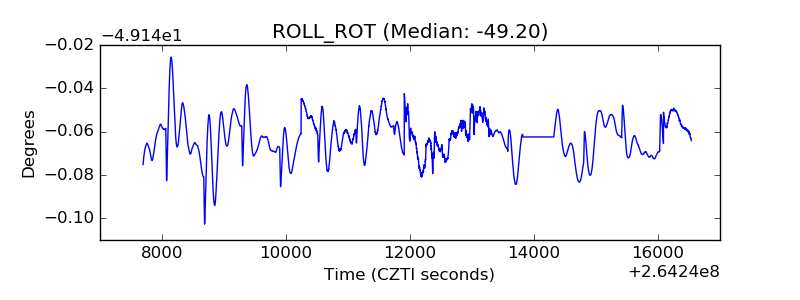 |
| _Roll_DEC | 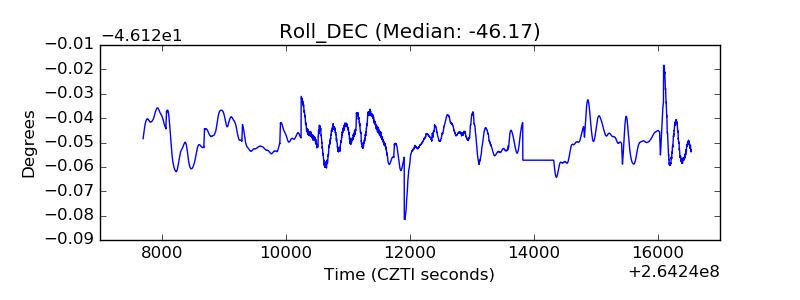 |
| _Roll_RA | 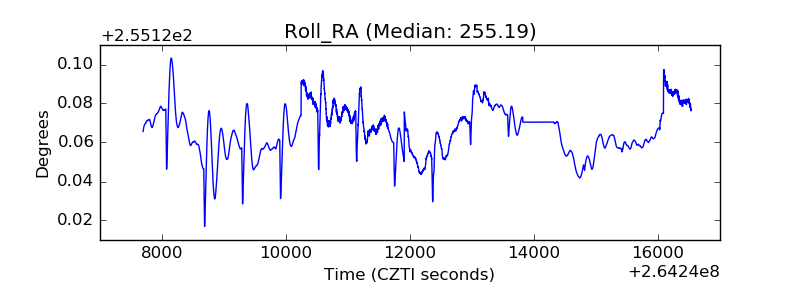 |
| Veto Counter | 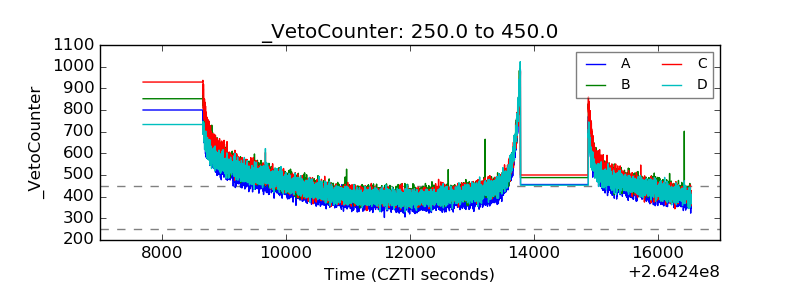 |