| Param | Original file | Final file |
|---|---|---|
| Filename | modeM0/AS1G08_069T01_9000002102_14245cztM0_level2.evt | modeM0/AS1G08_069T01_9000002102_14245cztM0_level2_quad_clean.evt |
| Size (bytes) | 572,705,280 | 87,946,560 |
| Size | 546.2 MB | 83.9 MB |
| Events in quadrant A | 3,865,852 | 561,872 |
| Events in quadrant B | 3,793,575 | 554,102 |
| Events in quadrant C | 3,749,387 | 536,732 |
| Events in quadrant D | 5,454,804 | 516,132 |
| Mode SS | |||
|---|---|---|---|
| Quadrant | BADHDUFLAG | Total packets | Discarded packets |
| A | 0 | 144 | 0 |
| B | 0 | 144 | 0 |
| C | 0 | 144 | 0 |
| D | 0 | 144 | 0 |
| Mode M0 | |||
|---|---|---|---|
| Quadrant | BADHDUFLAG | Total packets | Discarded packets |
| A | 0 | 15923 | 3 |
| B | 0 | 15711 | 2 |
| C | 0 | 15450 | 2 |
| D | 0 | 21481 | 2 |
| Mode M9 | |||
|---|---|---|---|
| Quadrant | BADHDUFLAG | Total packets | Discarded packets |
| A | 0 | 13 | 0 |
| B | 0 | 13 | 0 |
| C | 0 | 13 | 0 |
| D | 0 | 14 | 0 |
| Quadrant | Total seconds | Saturated seconds | Saturation percentage |
|---|---|---|---|
| A | 7097 | 140 | 1.972665% |
| B | 7097 | 189 | 2.663097% |
| C | 7097 | 76 | 1.070875% |
| D | 7097 | 143 | 2.014936% |
Noise dominated data is calculated using 1-second bins in cleaned event files. If a bin has >2000 counts, and if more than 50% of those come from <1% of pixels, then it is considered to be noise-dominated and hence unusable.
| Quadrant | # 1 sec bins | Bins with >0 counts | Bins with >2000 counts | High rate bins dominated by noise | Noise dominated (total time) | Noise dominated (detector-on time) | Marked lightcurve |
|---|---|---|---|---|---|---|---|
| A | 7933 | 7099 | 11 | 11 | 0.14% | 0.15% | 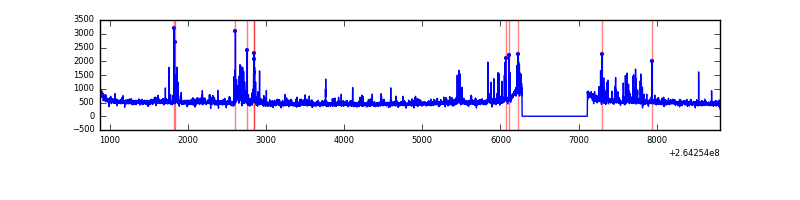 |
| B | 7933 | 7098 | 36 | 36 | 0.45% | 0.51% | 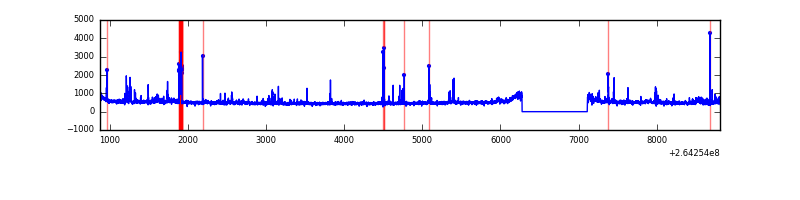 |
| C | 7933 | 7099 | 3 | 3 | 0.04% | 0.04% | 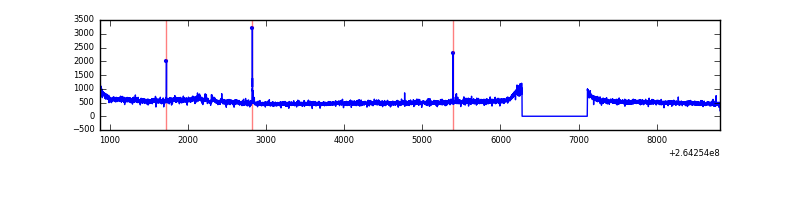 |
| D | 7933 | 7099 | 24 | 24 | 0.30% | 0.34% | 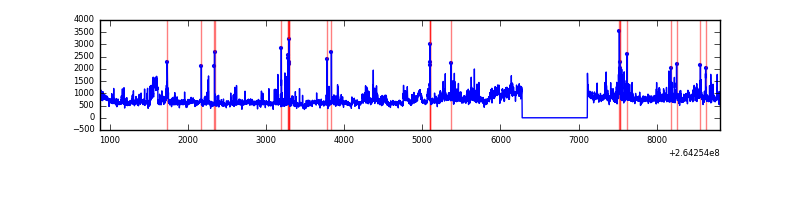 |
Top three noisy pixels from each quadrant. If the there are fewer than three noisy pixels in the level2.evt file, extra rows are filled as -1
| Pixel properties | Quadrant properties | ||||||
|---|---|---|---|---|---|---|---|
| Quadrant | DetID | PixID | Counts | Sigma | Mean | Median | Sigma |
| A | 9 | 143 | 338895 | 1904.94 | 887 | 868 | 177.4 |
| A | 12 | 189 | 54612 | 302.87 | 887 | 868 | 177.4 |
| A | 8 | 15 | 32970 | 180.91 | 887 | 868 | 177.4 |
| B | 0 | 229 | 246240 | 1474.19 | 877 | 856 | 166.5 |
| B | 0 | 189 | 30827 | 180.06 | 877 | 856 | 166.5 |
| B | 4 | 48 | 27736 | 161.49 | 877 | 856 | 166.5 |
| C | 3 | 233 | 382812 | 1916.26 | 859 | 864 | 199.3 |
| C | 10 | 22 | 12218 | 56.96 | 859 | 864 | 199.3 |
| C | 14 | 234 | 10144 | 46.56 | 859 | 864 | 199.3 |
| D | 8 | 195 | 1237320 | 6174.96 | 851 | 832 | 200.2 |
| D | 13 | 122 | 457452 | 2280.34 | 851 | 832 | 200.2 |
| D | 5 | 222 | 415887 | 2072.77 | 851 | 832 | 200.2 |
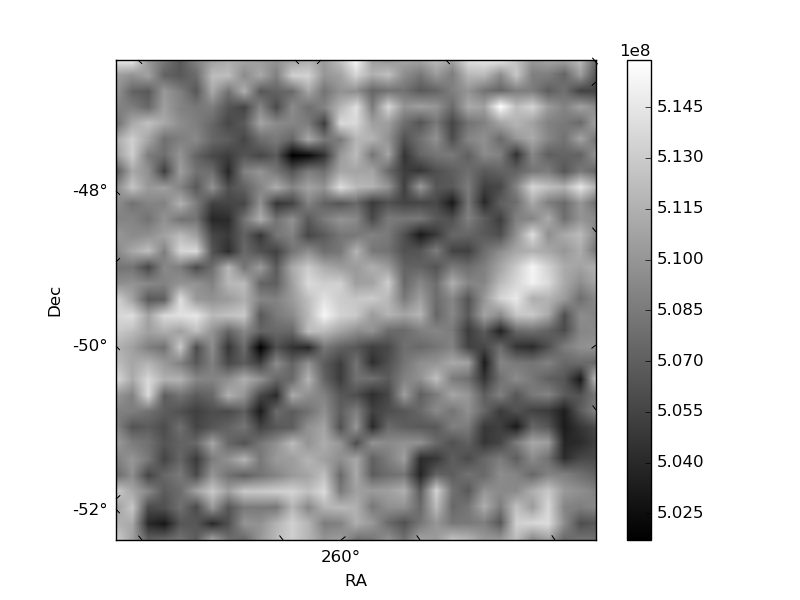
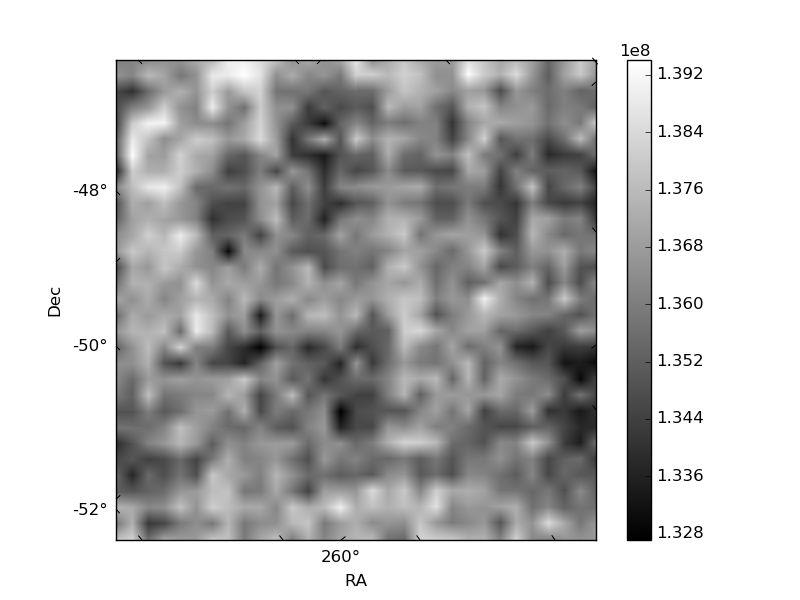
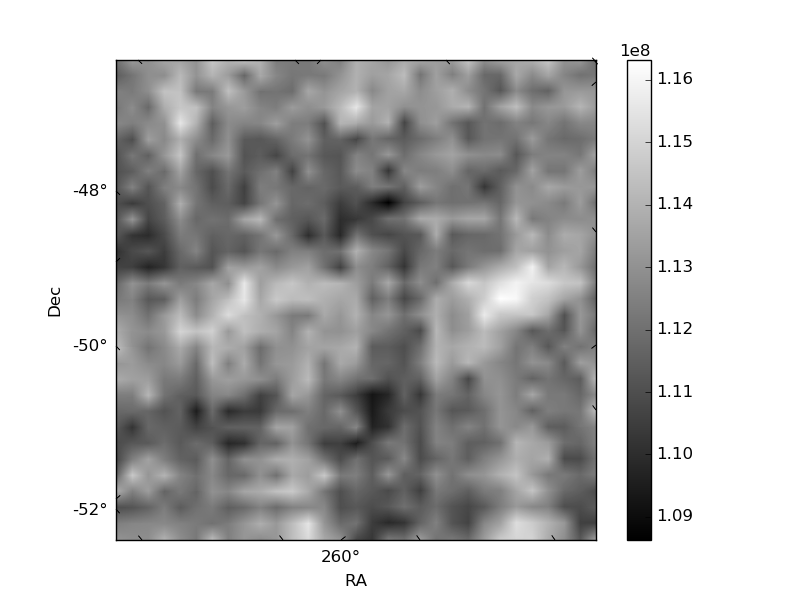
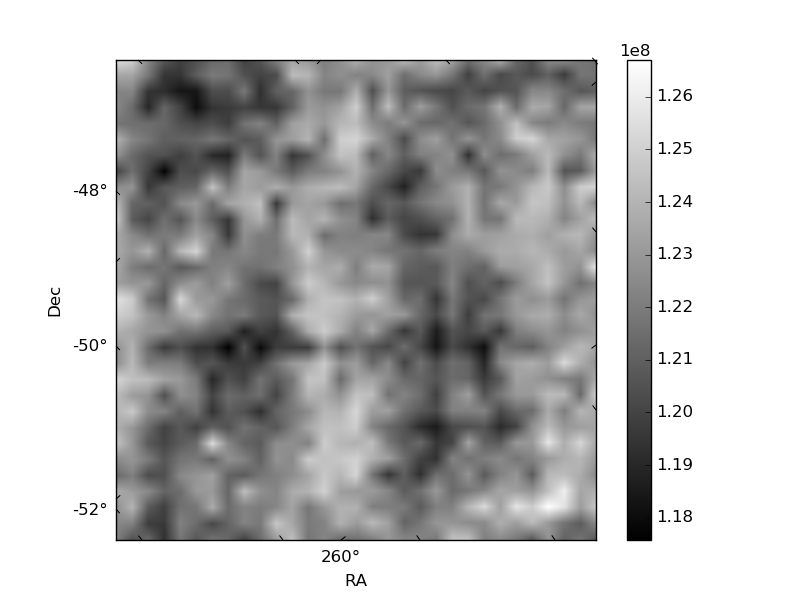
Histogram calculated using DETX and DETY for each event in the final _common_clean file
| Quadrant A | 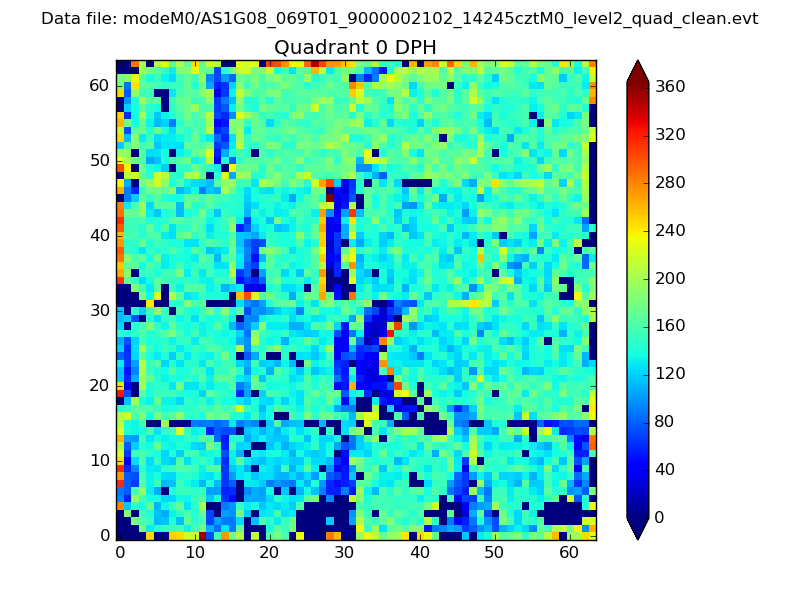 |
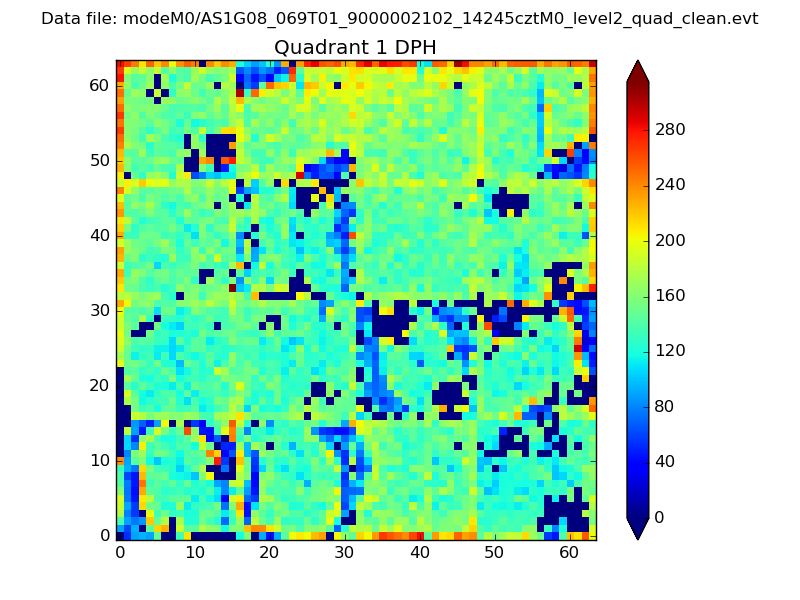 |
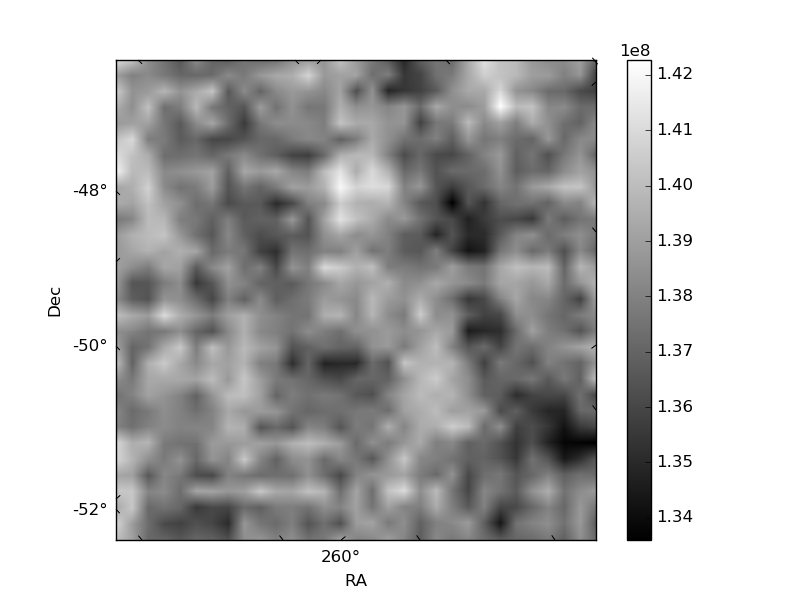
Quadrant B |
|---|---|---|---|
| Quadrant D | 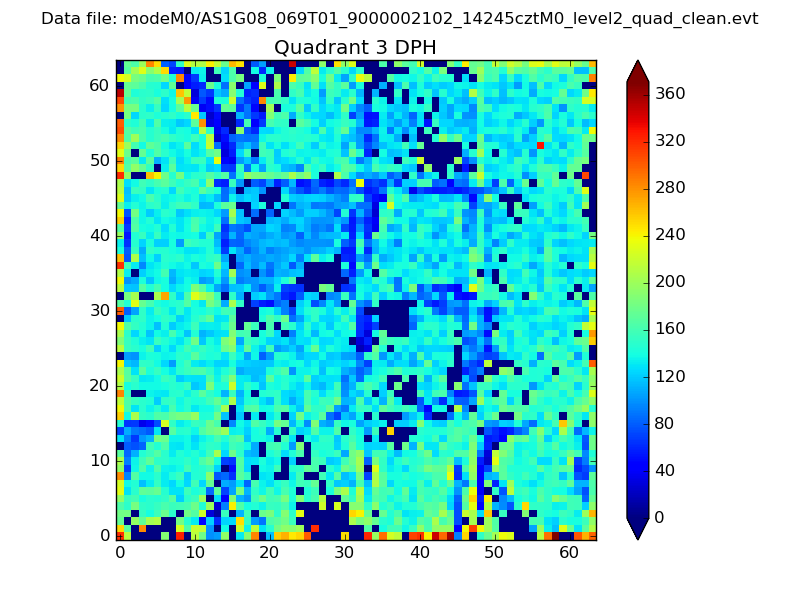 |
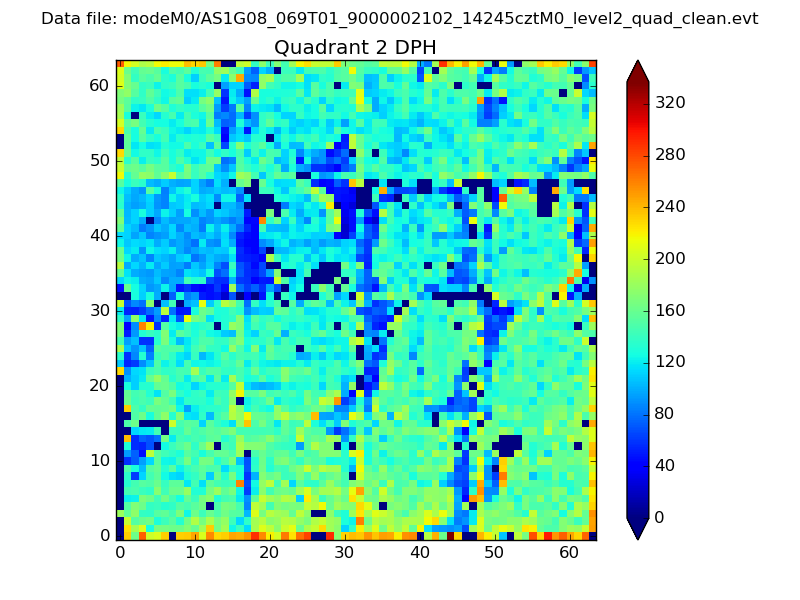 |
Quadrant C |
| Plot type | Count rate plots | Images |
|---|---|---|
| Comparison with Poisson distribution Blue bars denote a histogram of data divided into 1 sec bins. Red curve is a Poisson curve with rate = median count rate of data. |
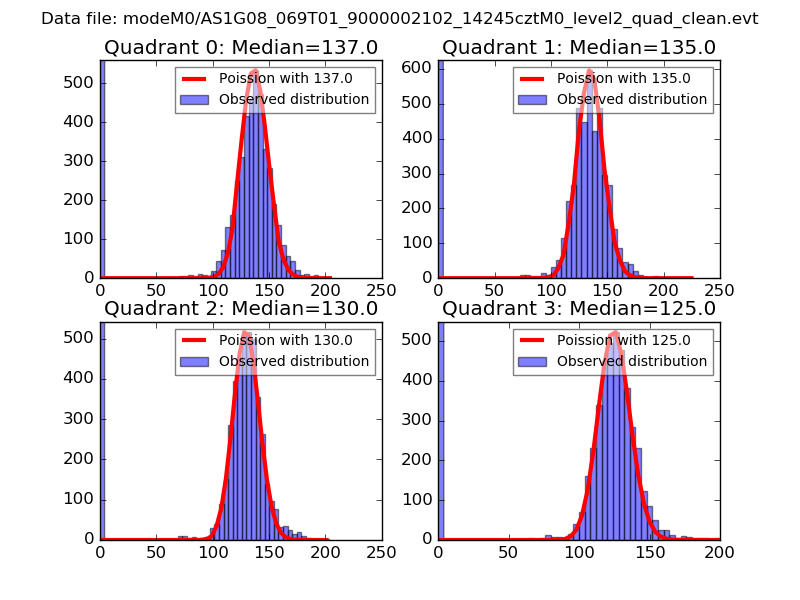 |
 |
| Quadrant-wise count rates Data is divided into 100 sec bins |
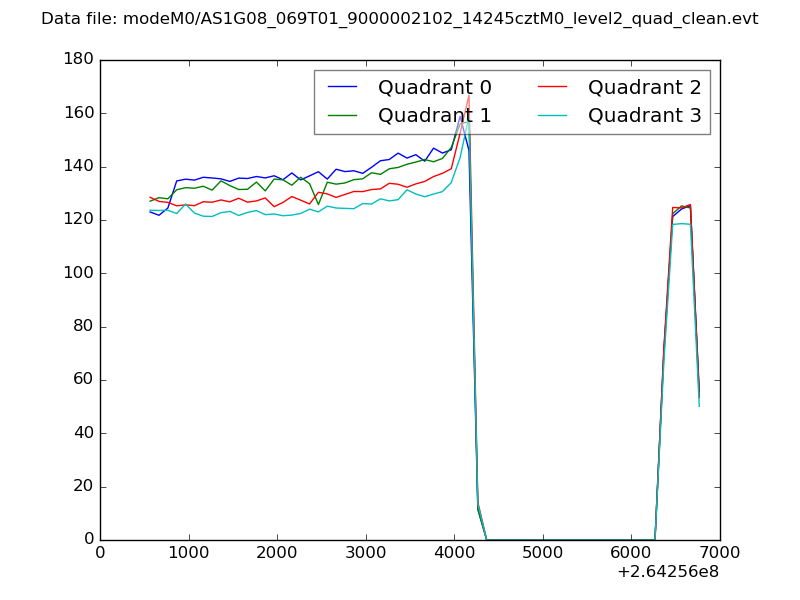 |
|
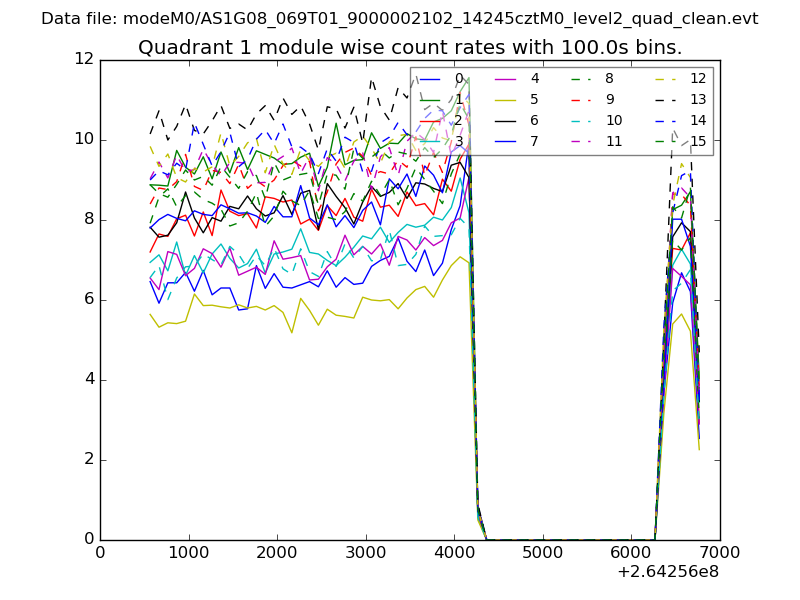
| Module-wise count rates for Quadrant A Data is divided into 100 sec bins |
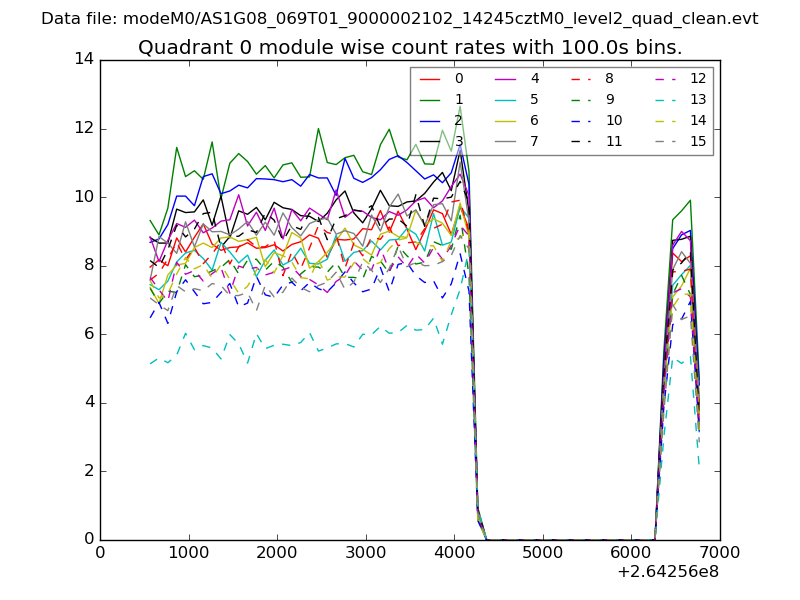 |
 |
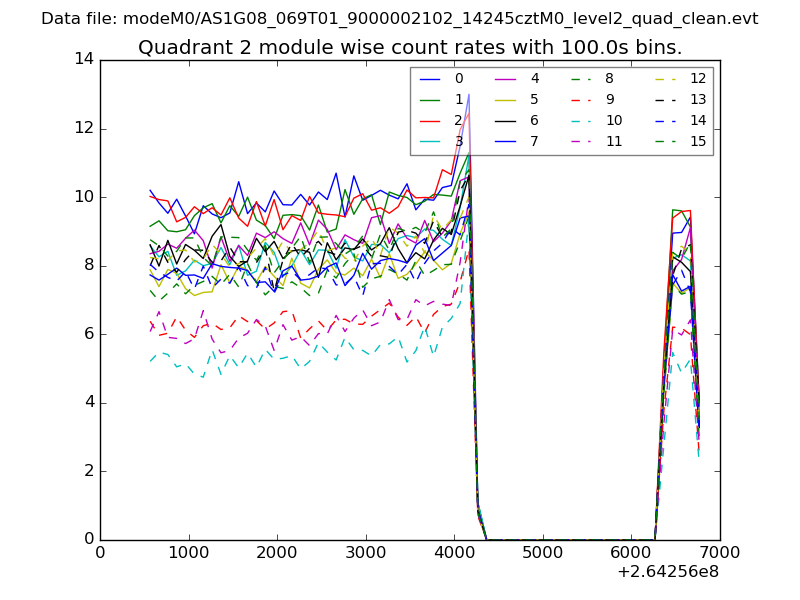
| Module-wise count rates for Quadrant B Data is divided into 100 sec bins |
 |
 |
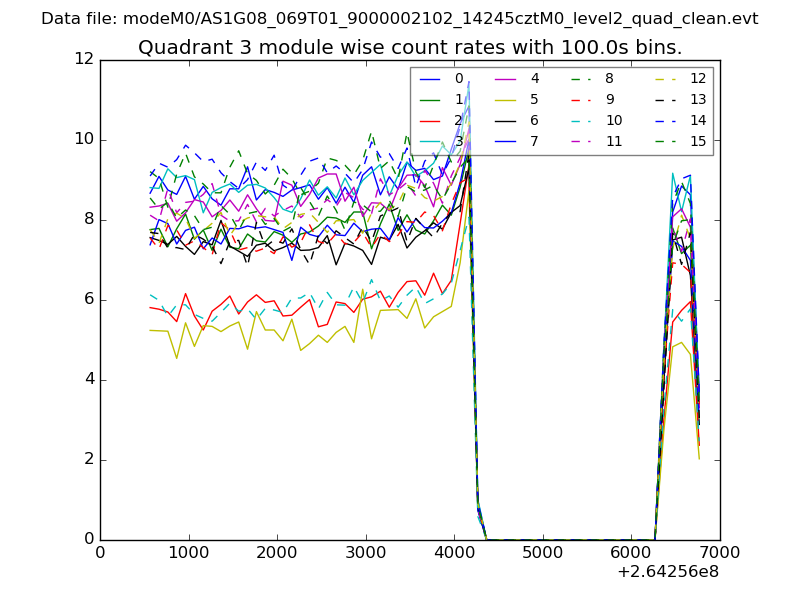
| Module-wise count rates for Quadrant C Data is divided into 100 sec bins |
 |
 |
| Module-wise count rates for Quadrant D Data is divided into 100 sec bins |
 |
 |
| Parameter | Plot |
|---|---|
| CZT HV Monitor | 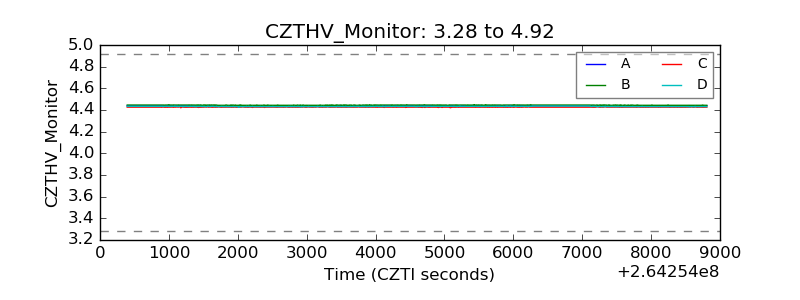 |
| D_VDD | 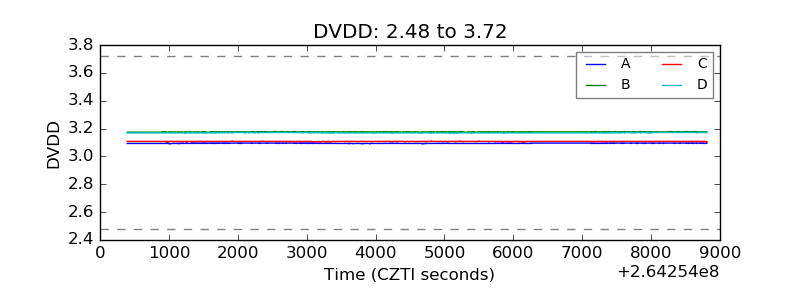 |
| Temperature 1 | 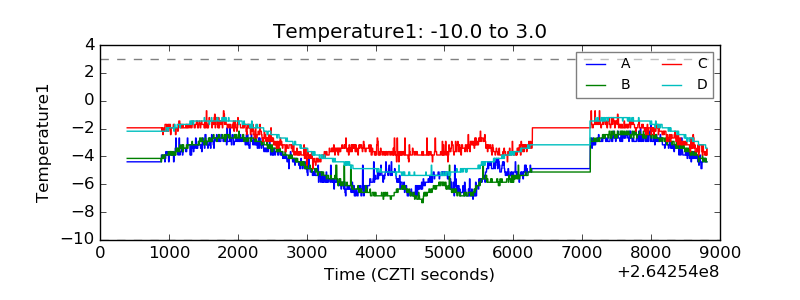 |
| Veto HV Monitor | 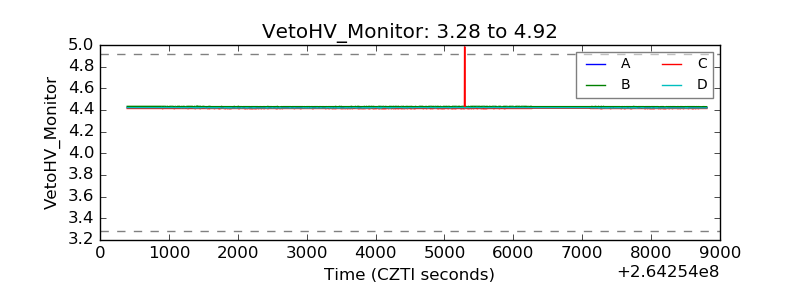 |
| Veto LLD | 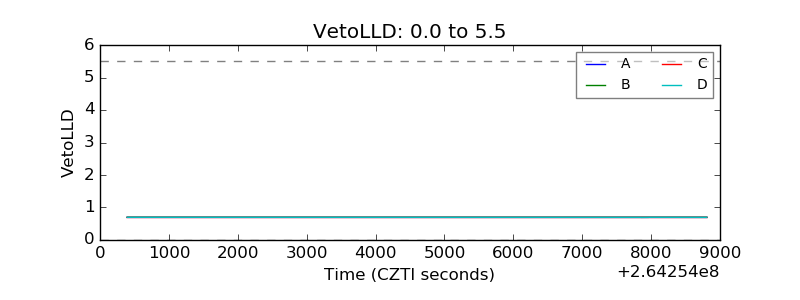 |
| Alpha Counter | 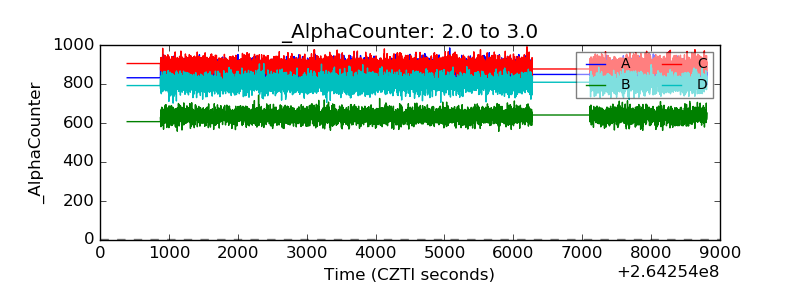 |
| _CPM_Rate | 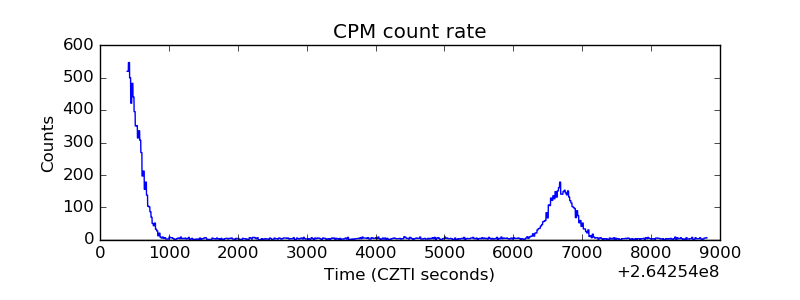 |
| CZT Counter | 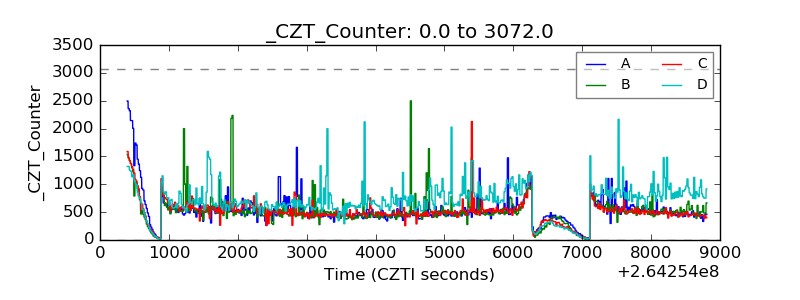 |
| +2.5 Volts monitor |  |
| +5 Volts monitor |  |
| _ROLL_ROT | 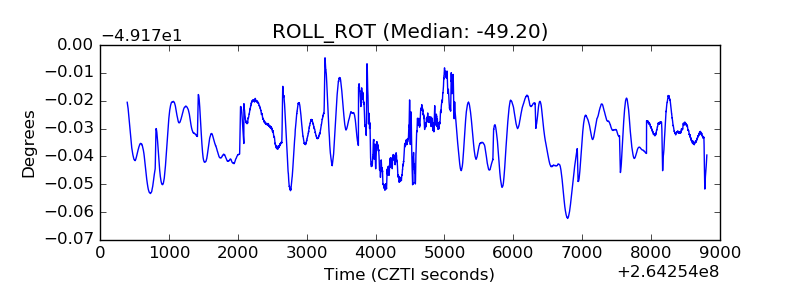 |
| _Roll_DEC | 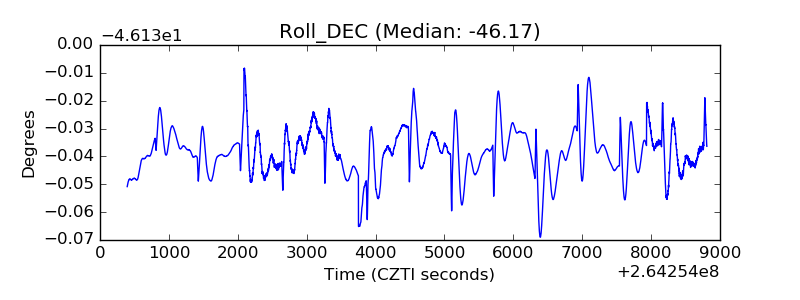 |
| _Roll_RA | 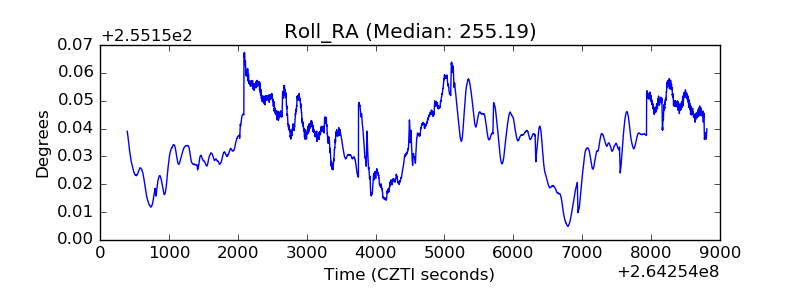 |
| Veto Counter | 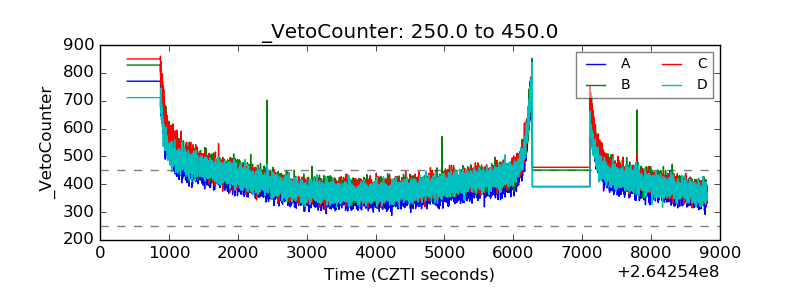 |