| Param | Original file | Final file |
|---|---|---|
| Filename | modeM0/AS1G08_069T01_9000002102_14251cztM0_level2.evt | modeM0/AS1G08_069T01_9000002102_14251cztM0_level2_quad_clean.evt |
| Size (bytes) | 1,321,822,080 | 217,664,640 |
| Size | 1.2 GB | 207.6 MB |
| Events in quadrant A | 8,217,254 | 1,441,599 |
| Events in quadrant B | 8,109,558 | 1,415,677 |
| Events in quadrant C | 7,671,452 | 1,365,344 |
| Events in quadrant D | 14,969,582 | 1,282,403 |
| Mode SS | |||
|---|---|---|---|
| Quadrant | BADHDUFLAG | Total packets | Discarded packets |
| A | 0 | 320 | 0 |
| B | 0 | 320 | 0 |
| C | 0 | 320 | 0 |
| D | 0 | 320 | 0 |
| Mode M0 | |||
|---|---|---|---|
| Quadrant | BADHDUFLAG | Total packets | Discarded packets |
| A | 0 | 34785 | 5 |
| B | 0 | 34510 | 4 |
| C | 0 | 32899 | 4 |
| D | 0 | 56456 | 4 |
| Mode M9 | |||
|---|---|---|---|
| Quadrant | BADHDUFLAG | Total packets | Discarded packets |
| A | 0 | 16 | 0 |
| B | 0 | 16 | 0 |
| C | 0 | 16 | 0 |
| D | 0 | 16 | 0 |
| Quadrant | Total seconds | Saturated seconds | Saturation percentage |
|---|---|---|---|
| A | 15766 | 258 | 1.636433% |
| B | 15766 | 358 | 2.270709% |
| C | 15766 | 111 | 0.704047% |
| D | 15766 | 1708 | 10.833439% |
Noise dominated data is calculated using 1-second bins in cleaned event files. If a bin has >2000 counts, and if more than 50% of those come from <1% of pixels, then it is considered to be noise-dominated and hence unusable.
| Quadrant | # 1 sec bins | Bins with >0 counts | Bins with >2000 counts | High rate bins dominated by noise | Noise dominated (total time) | Noise dominated (detector-on time) | Marked lightcurve |
|---|---|---|---|---|---|---|---|
| A | 17372 | 15771 | 22 | 22 | 0.13% | 0.14% | 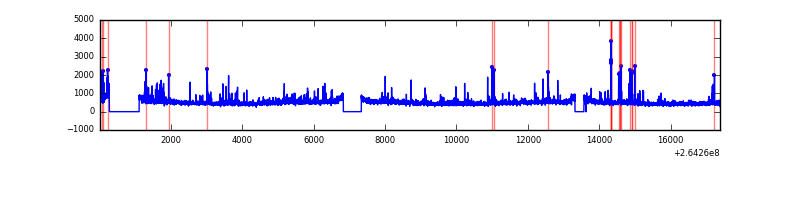 |
| B | 17372 | 15770 | 47 | 47 | 0.27% | 0.30% | 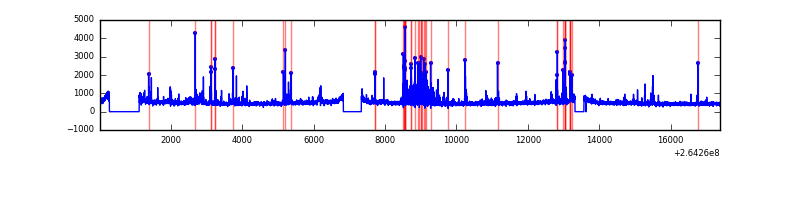 |
| C | 17372 | 15771 | 4 | 4 | 0.02% | 0.03% | 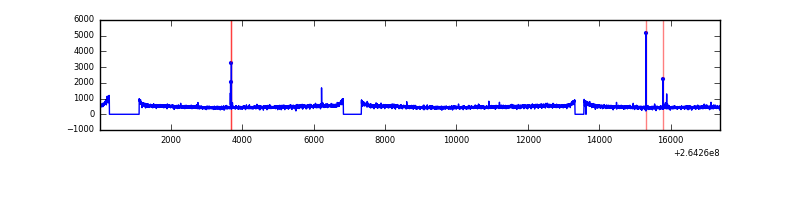 |
| D | 17372 | 15771 | 1157 | 1157 | 6.66% | 7.34% | 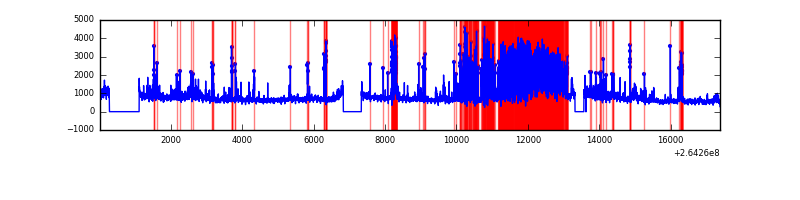 |
Top three noisy pixels from each quadrant. If the there are fewer than three noisy pixels in the level2.evt file, extra rows are filled as -1
| Pixel properties | Quadrant properties | ||||||
|---|---|---|---|---|---|---|---|
| Quadrant | DetID | PixID | Counts | Sigma | Mean | Median | Sigma |
| A | 9 | 143 | 550236 | 1435.38 | 1899 | 1857 | 382.0 |
| A | 12 | 189 | 217641 | 564.81 | 1899 | 1857 | 382.0 |
| A | 8 | 15 | 97195 | 249.55 | 1899 | 1857 | 382.0 |
| B | 0 | 229 | 359850 | 998.16 | 1882 | 1833 | 358.7 |
| B | 10 | 244 | 239177 | 661.72 | 1882 | 1833 | 358.7 |
| B | 4 | 142 | 47385 | 127.0 | 1882 | 1833 | 358.7 |
| C | 3 | 233 | 490833 | 1156.54 | 1830 | 1839 | 422.8 |
| C | 5 | 96 | 22338 | 48.48 | 1830 | 1839 | 422.8 |
| C | 14 | 234 | 18382 | 39.13 | 1830 | 1839 | 422.8 |
| D | 5 | 222 | 4055133 | 9742.8 | 1754 | 1713 | 416.0 |
| D | 8 | 195 | 3414286 | 8202.46 | 1754 | 1713 | 416.0 |
| D | 13 | 122 | 581562 | 1393.72 | 1754 | 1713 | 416.0 |
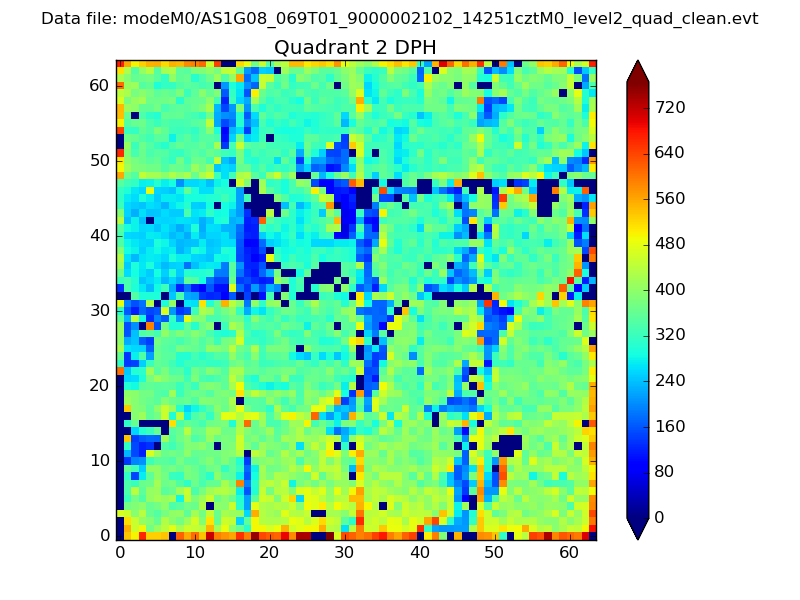
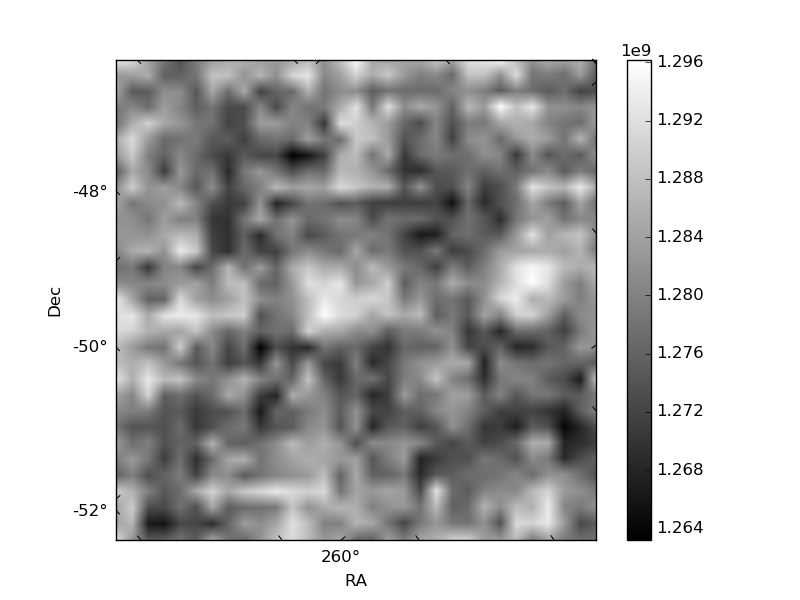
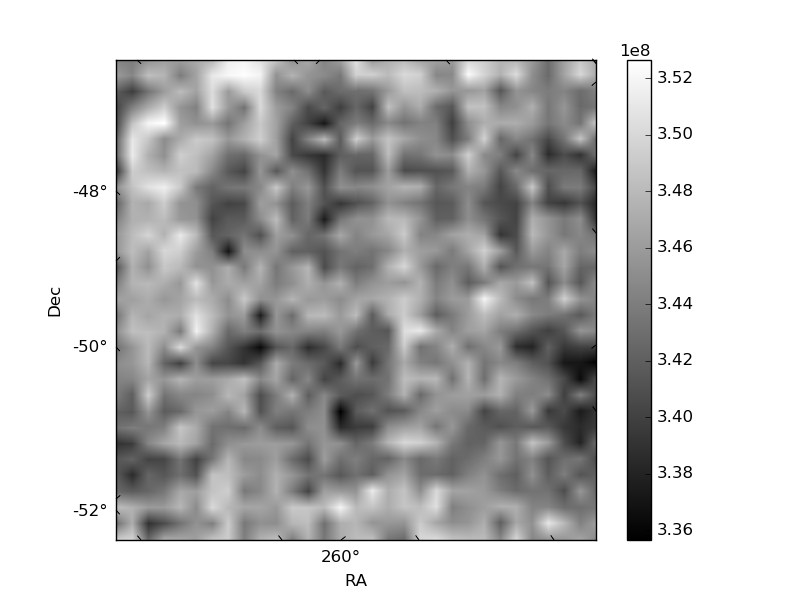
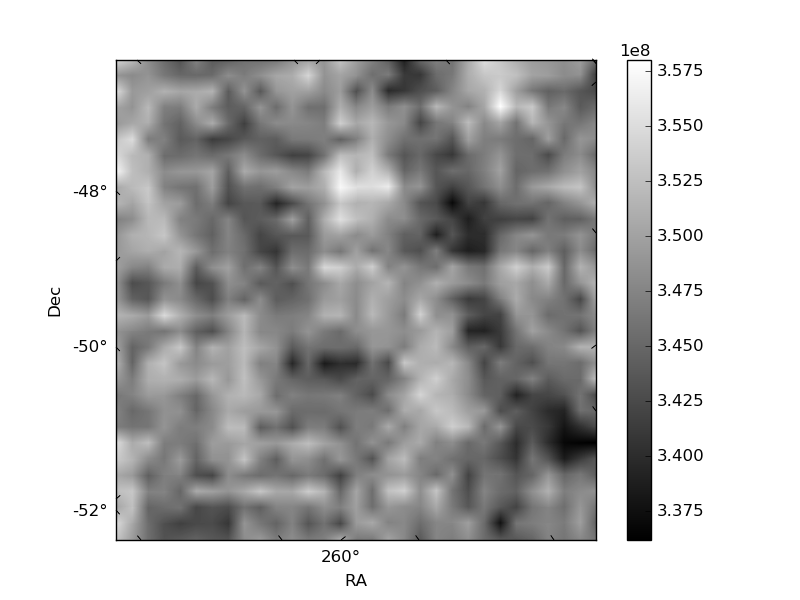
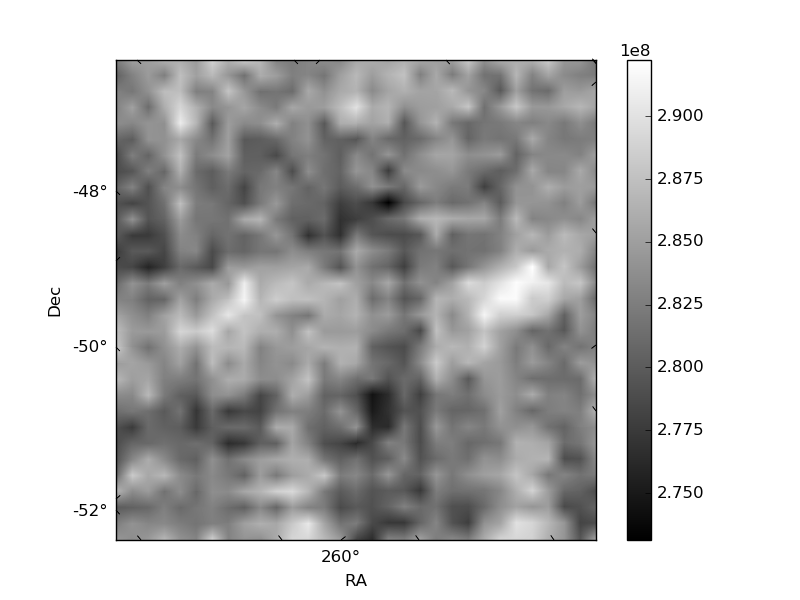
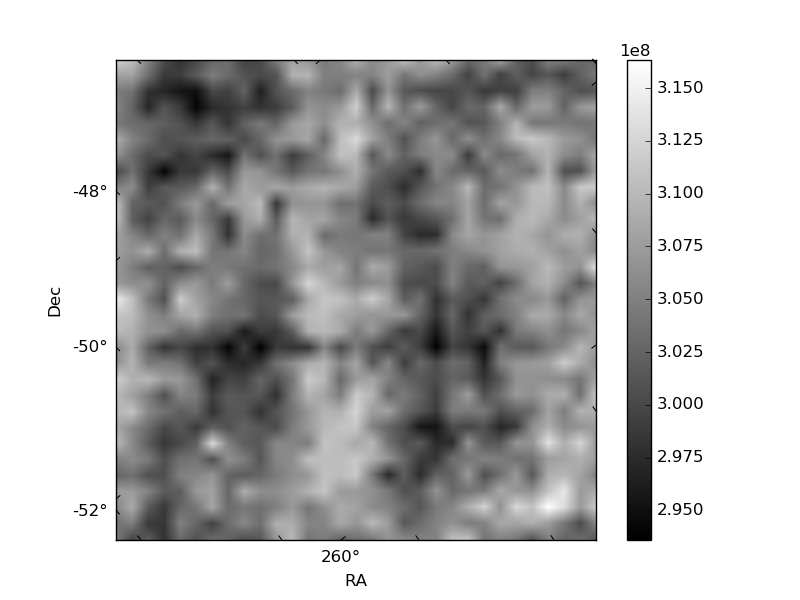
Histogram calculated using DETX and DETY for each event in the final _common_clean file
| Quadrant A | 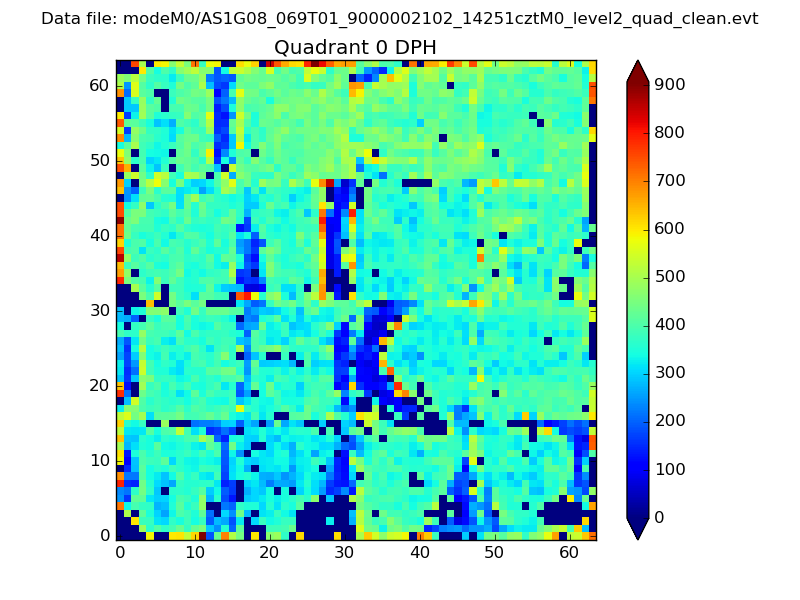 |
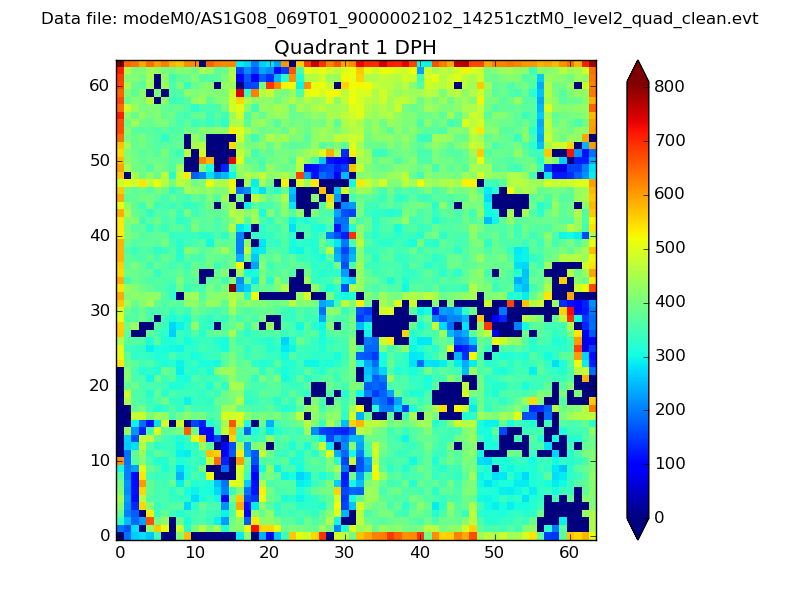 |
Quadrant B |
|---|---|---|---|
| Quadrant D | 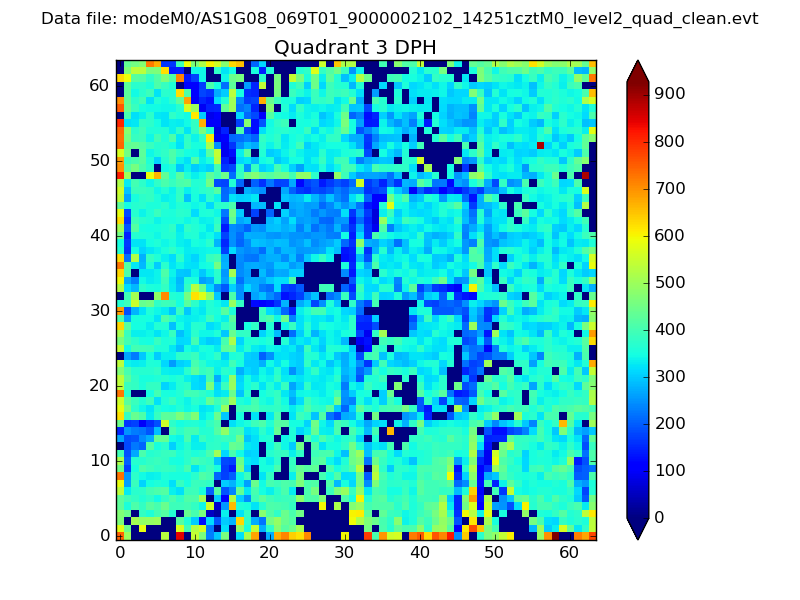 |
 |
Quadrant C |
| Plot type | Count rate plots | Images |
|---|---|---|
| Comparison with Poisson distribution Blue bars denote a histogram of data divided into 1 sec bins. Red curve is a Poisson curve with rate = median count rate of data. |
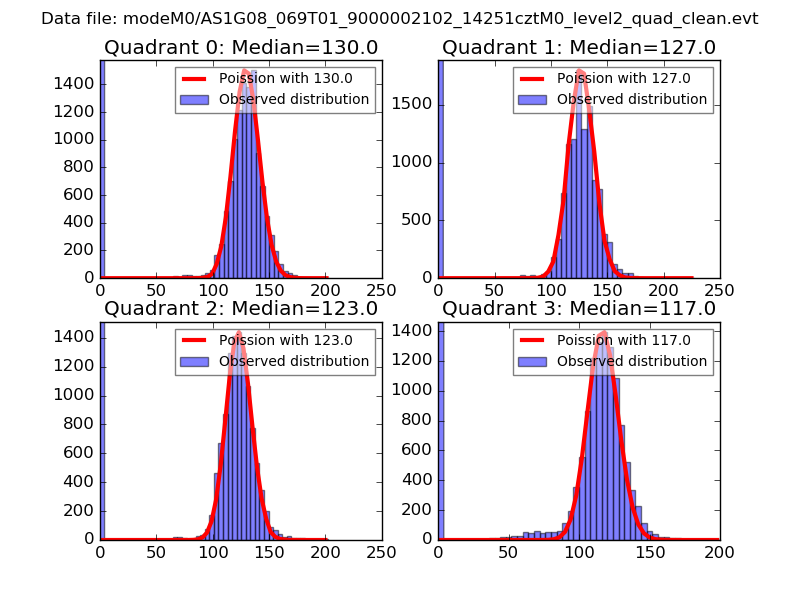 |
 |
| Quadrant-wise count rates Data is divided into 100 sec bins |
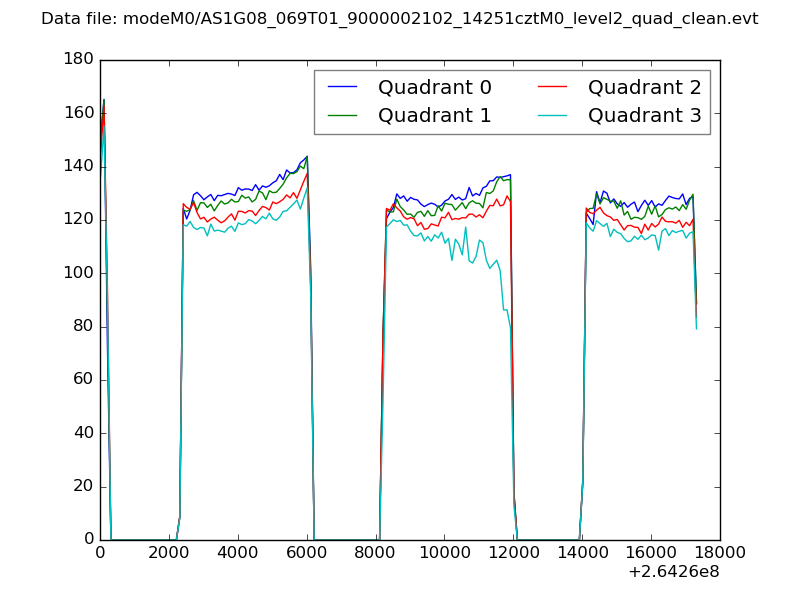 |
|
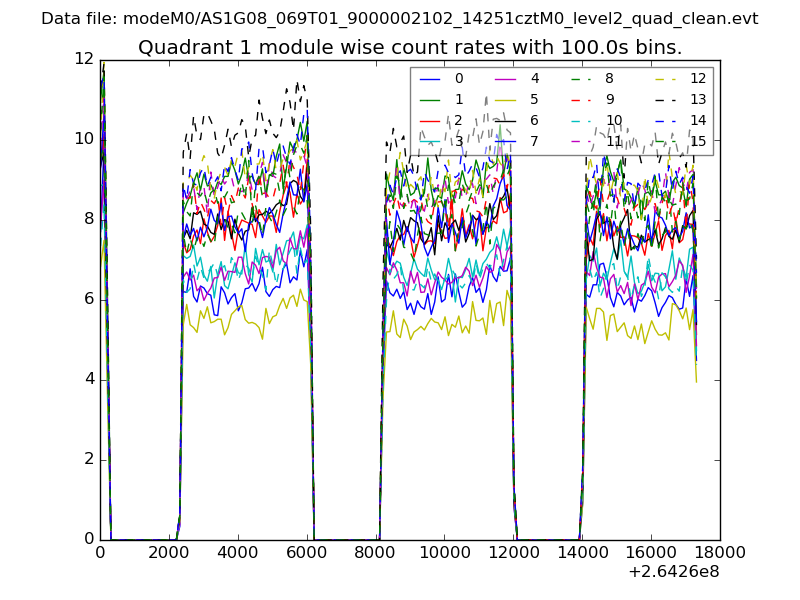
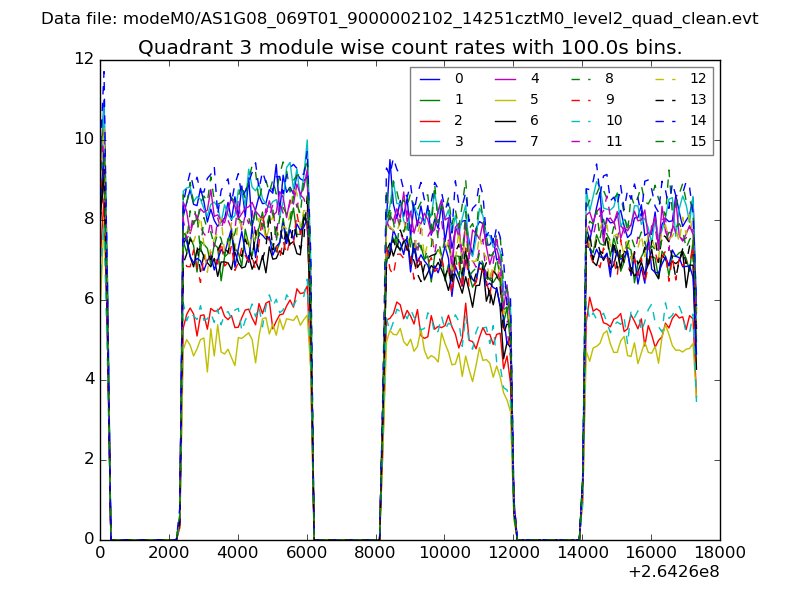
| Module-wise count rates for Quadrant A Data is divided into 100 sec bins |
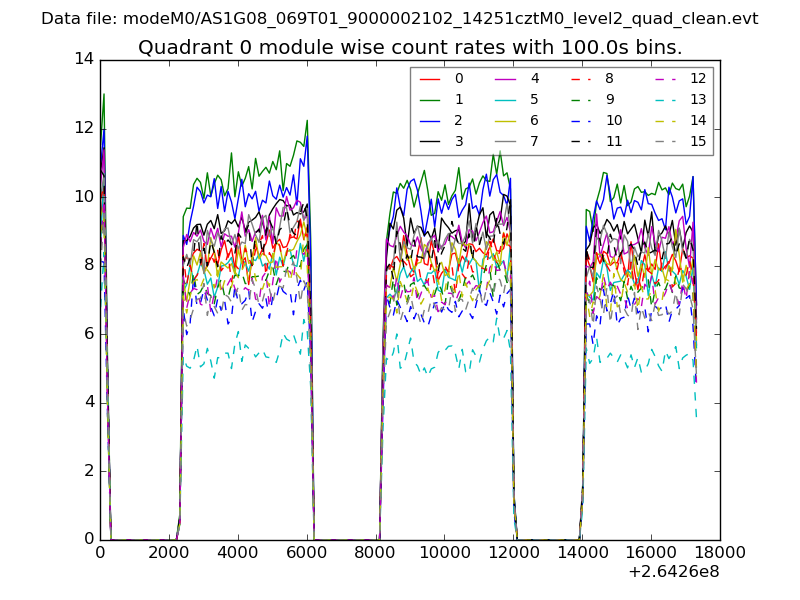 |
 |
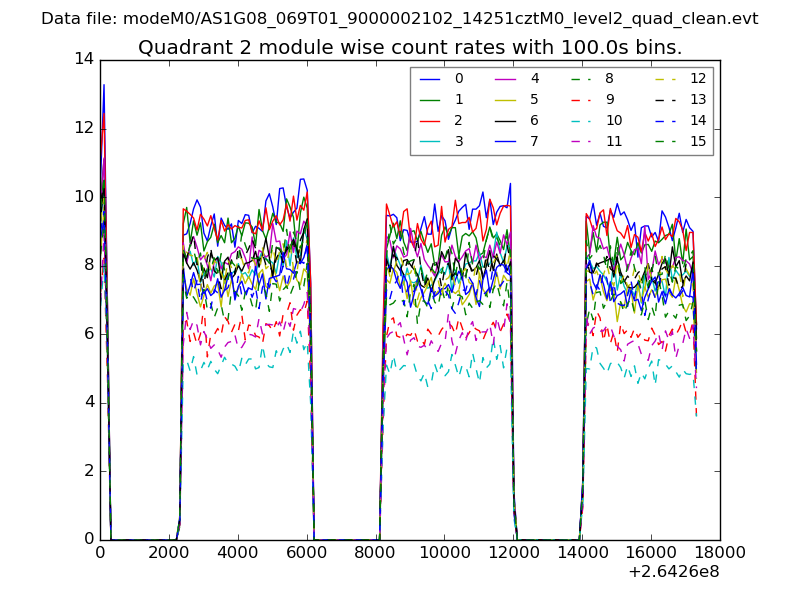
| Module-wise count rates for Quadrant B Data is divided into 100 sec bins |
 |
 |
| Module-wise count rates for Quadrant C Data is divided into 100 sec bins |
 |
 |
| Module-wise count rates for Quadrant D Data is divided into 100 sec bins |
 |
 |
| Parameter | Plot |
|---|---|
| CZT HV Monitor | 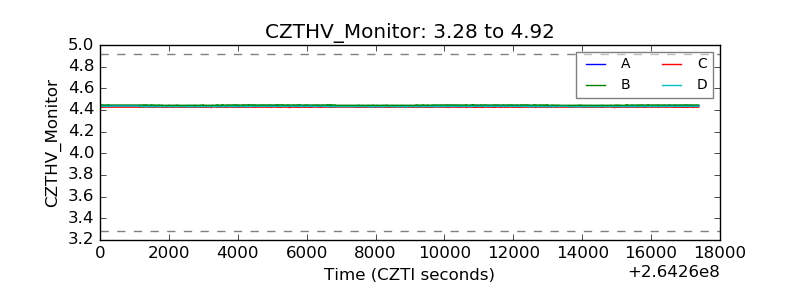 |
| D_VDD | 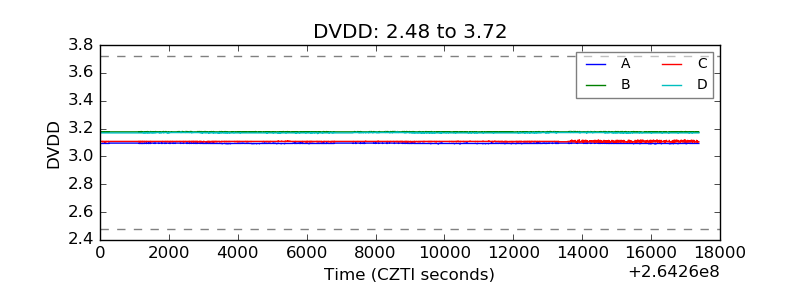 |
| Temperature 1 | 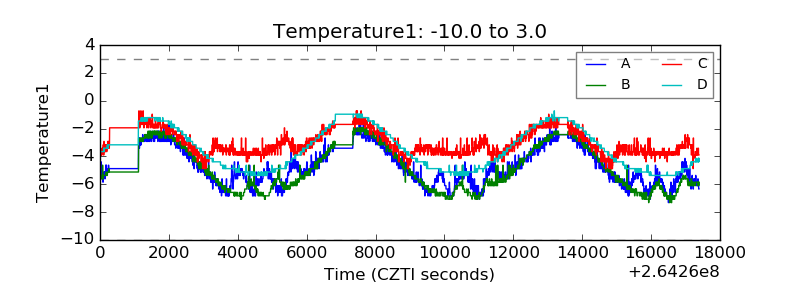 |
| Veto HV Monitor |  |
| Veto LLD | 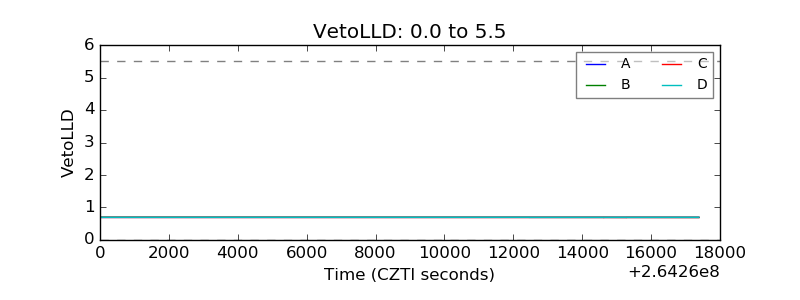 |
| Alpha Counter | 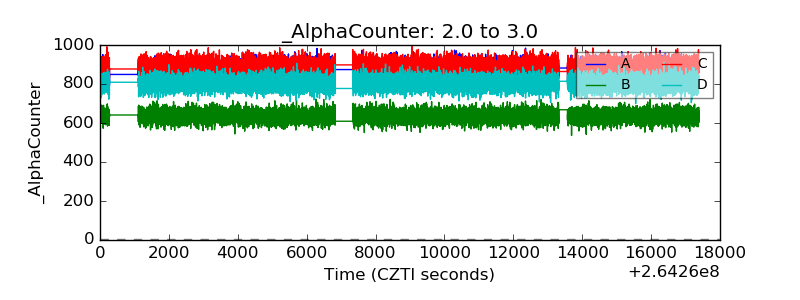 |
| _CPM_Rate | 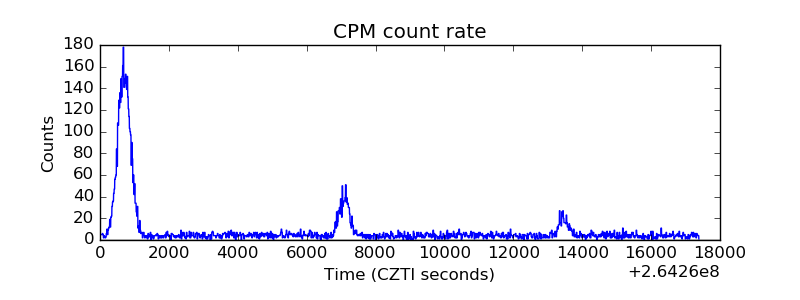 |
| CZT Counter | 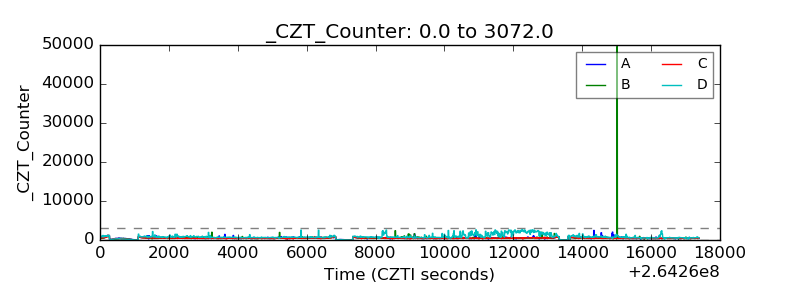 |
| +2.5 Volts monitor |  |
| +5 Volts monitor |  |
| _ROLL_ROT | 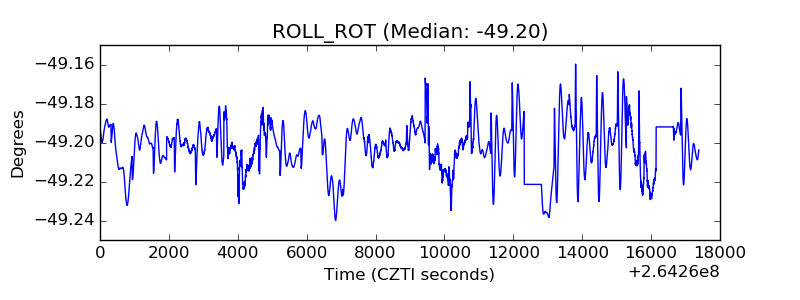 |
| _Roll_DEC | 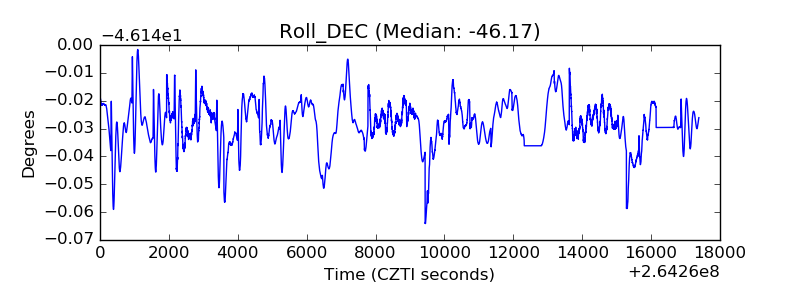 |
| _Roll_RA | 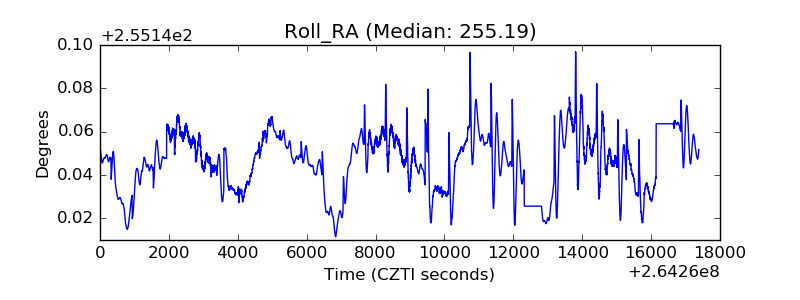 |
| Veto Counter | 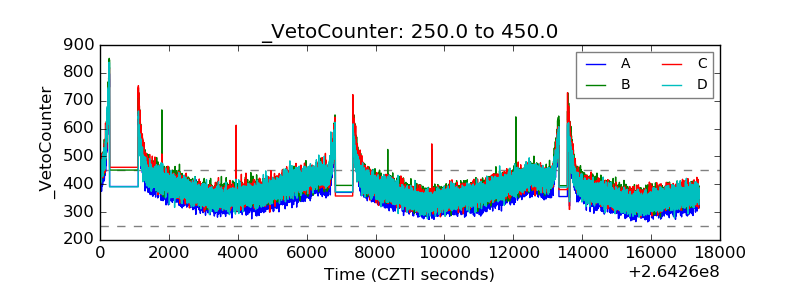 |