| Param | Original file | Final file |
|---|---|---|
| Filename | modeM0/AS1G08_069T01_9000002102_14252cztM0_level2.evt | modeM0/AS1G08_069T01_9000002102_14252cztM0_level2_quad_clean.evt |
| Size (bytes) | 783,342,720 | 126,414,720 |
| Size | 747.1 MB | 120.6 MB |
| Events in quadrant A | 5,077,202 | 822,769 |
| Events in quadrant B | 5,121,735 | 804,668 |
| Events in quadrant C | 5,043,894 | 771,630 |
| Events in quadrant D | 7,799,551 | 731,494 |
| Mode SS | |||
|---|---|---|---|
| Quadrant | BADHDUFLAG | Total packets | Discarded packets |
| A | 0 | 206 | 0 |
| B | 0 | 206 | 0 |
| C | 0 | 206 | 0 |
| D | 0 | 206 | 0 |
| Mode M0 | |||
|---|---|---|---|
| Quadrant | BADHDUFLAG | Total packets | Discarded packets |
| A | 0 | 21653 | 2 |
| B | 0 | 21791 | 2 |
| C | 0 | 21262 | 2 |
| D | 0 | 30479 | 2 |
| Mode M9 | |||
|---|---|---|---|
| Quadrant | BADHDUFLAG | Total packets | Discarded packets |
| A | 0 | 9 | 0 |
| B | 0 | 9 | 0 |
| C | 0 | 9 | 0 |
| D | 0 | 9 | 0 |
| Quadrant | Total seconds | Saturated seconds | Saturation percentage |
|---|---|---|---|
| A | 10070 | 37 | 0.367428% |
| B | 10070 | 123 | 1.221450% |
| C | 10070 | 21 | 0.208540% |
| D | 10070 | 485 | 4.816286% |
Noise dominated data is calculated using 1-second bins in cleaned event files. If a bin has >2000 counts, and if more than 50% of those come from <1% of pixels, then it is considered to be noise-dominated and hence unusable.
| Quadrant | # 1 sec bins | Bins with >0 counts | Bins with >2000 counts | High rate bins dominated by noise | Noise dominated (total time) | Noise dominated (detector-on time) | Marked lightcurve |
|---|---|---|---|---|---|---|---|
| A | 11001 | 10073 | 5 | 5 | 0.05% | 0.05% | 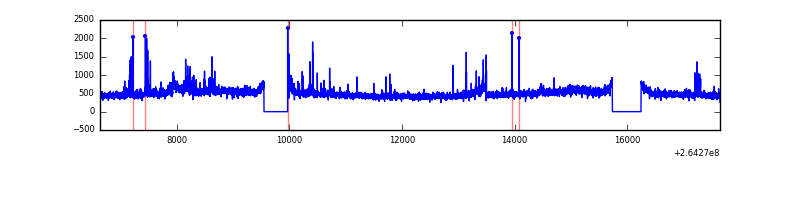 |
| B | 11001 | 10073 | 37 | 37 | 0.34% | 0.37% | 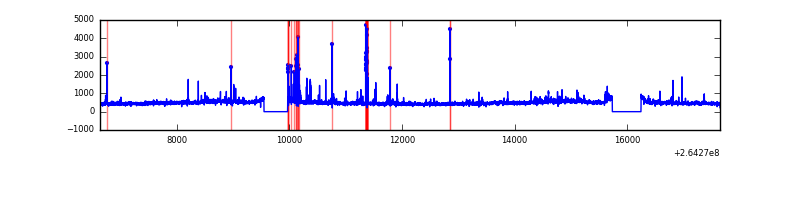 |
| C | 11001 | 10073 | 0 | 0 | 0.00% | 0.00% | 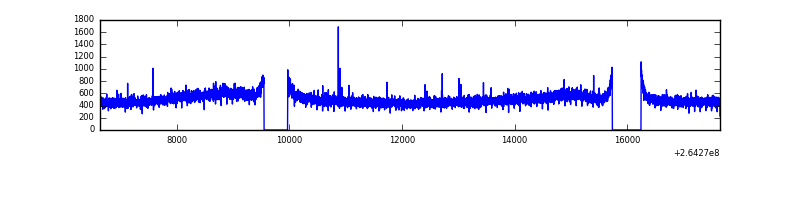 |
| D | 11001 | 10073 | 415 | 415 | 3.77% | 4.12% | 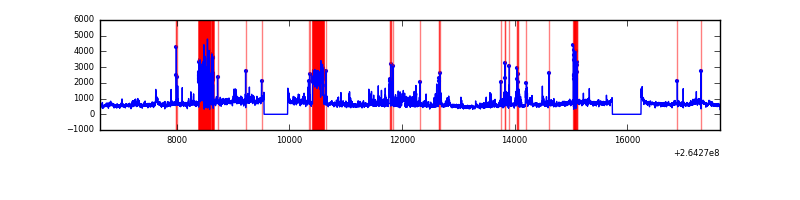 |
Top three noisy pixels from each quadrant. If the there are fewer than three noisy pixels in the level2.evt file, extra rows are filled as -1
| Pixel properties | Quadrant properties | ||||||
|---|---|---|---|---|---|---|---|
| Quadrant | DetID | PixID | Counts | Sigma | Mean | Median | Sigma |
| A | 12 | 189 | 193321 | 782.3 | 1217 | 1192 | 245.6 |
| A | 9 | 143 | 128241 | 517.31 | 1217 | 1192 | 245.6 |
| A | 8 | 6 | 37693 | 148.62 | 1217 | 1192 | 245.6 |
| B | 10 | 244 | 161341 | 687.0 | 1207 | 1177 | 233.1 |
| B | 0 | 229 | 131216 | 557.79 | 1207 | 1177 | 233.1 |
| B | 4 | 48 | 42424 | 176.92 | 1207 | 1177 | 233.1 |
| C | 3 | 233 | 432636 | 1582.09 | 1176 | 1182 | 272.7 |
| C | 8 | 128 | 15816 | 53.66 | 1176 | 1182 | 272.7 |
| C | 13 | 61 | 8593 | 27.17 | 1176 | 1182 | 272.7 |
| D | 8 | 195 | 1591628 | 5893.0 | 1137 | 1111 | 269.9 |
| D | 5 | 222 | 1073898 | 3974.76 | 1137 | 1111 | 269.9 |
| D | 1 | 3 | 438085 | 1619.02 | 1137 | 1111 | 269.9 |
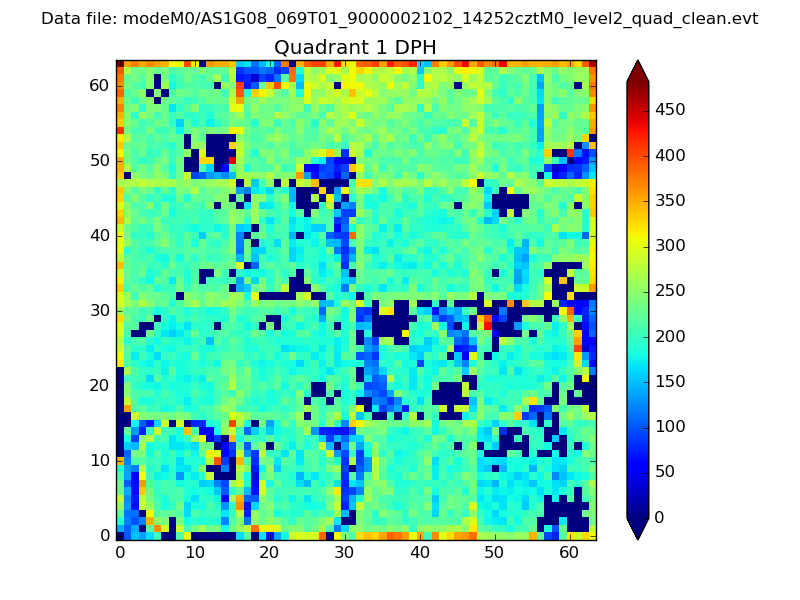
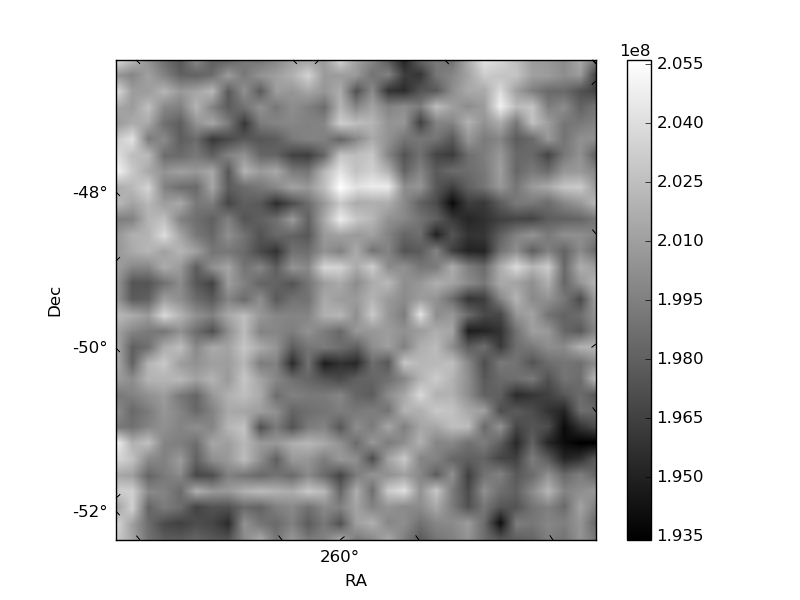
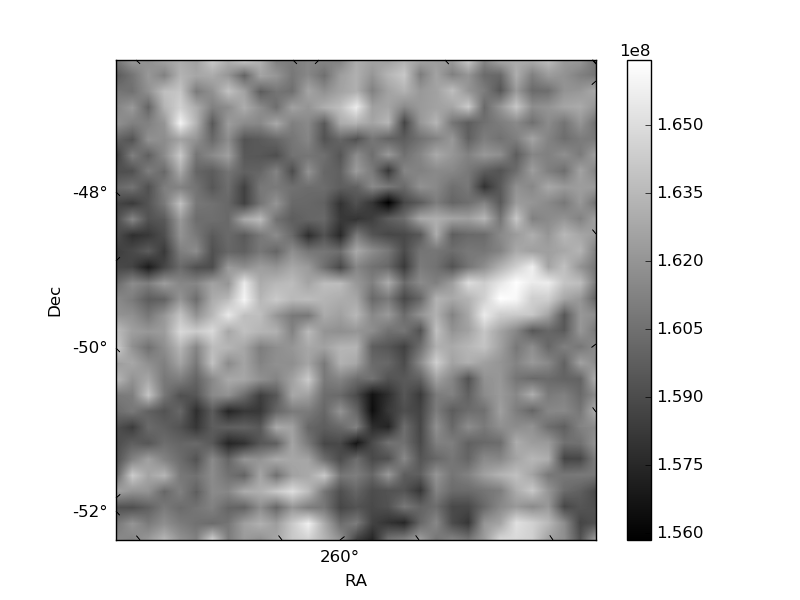
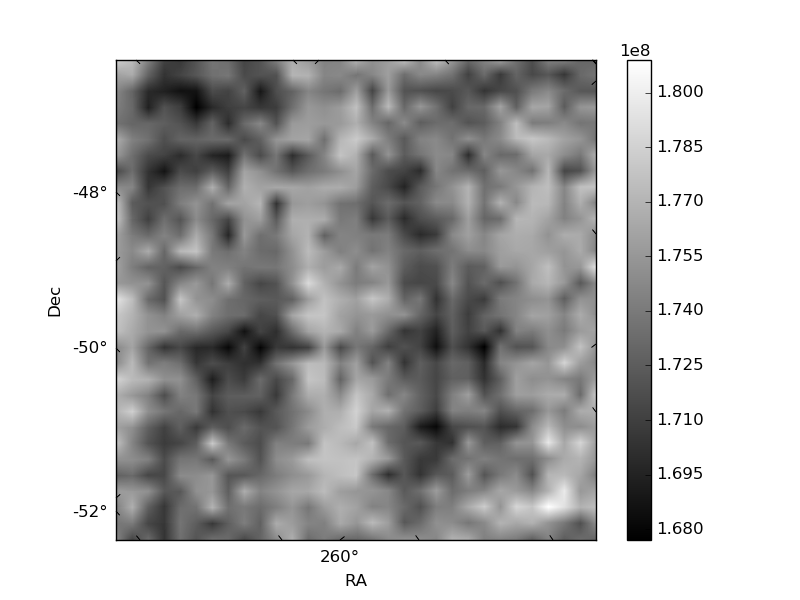
Histogram calculated using DETX and DETY for each event in the final _common_clean file
| Quadrant A |  |
 |
Quadrant B |
|---|---|---|---|
| Quadrant D | 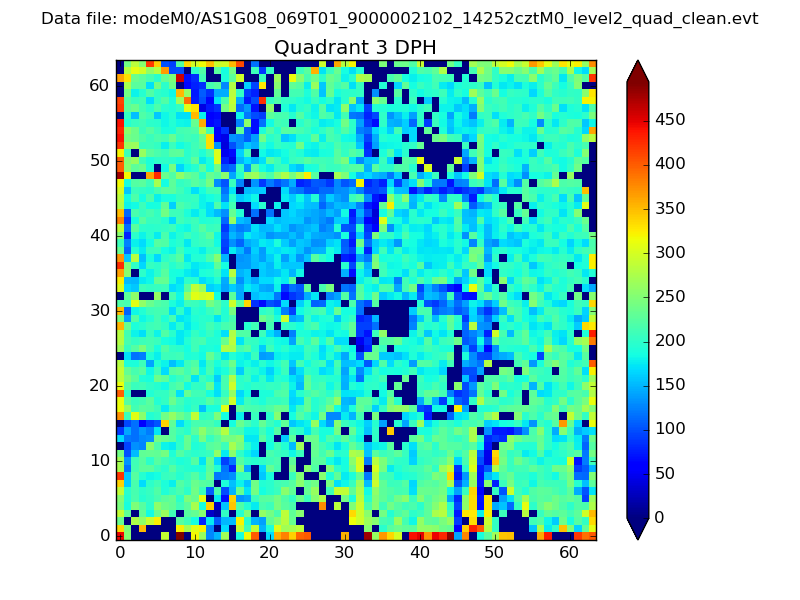 |
 |
Quadrant C |
| Plot type | Count rate plots | Images |
|---|---|---|
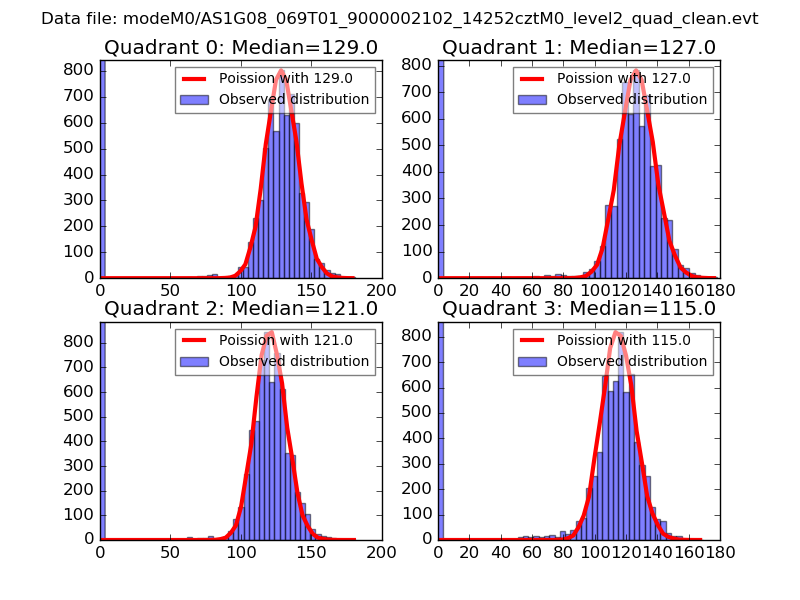
| Comparison with Poisson distribution Blue bars denote a histogram of data divided into 1 sec bins. Red curve is a Poisson curve with rate = median count rate of data. |
 |
 |
| Quadrant-wise count rates Data is divided into 100 sec bins |
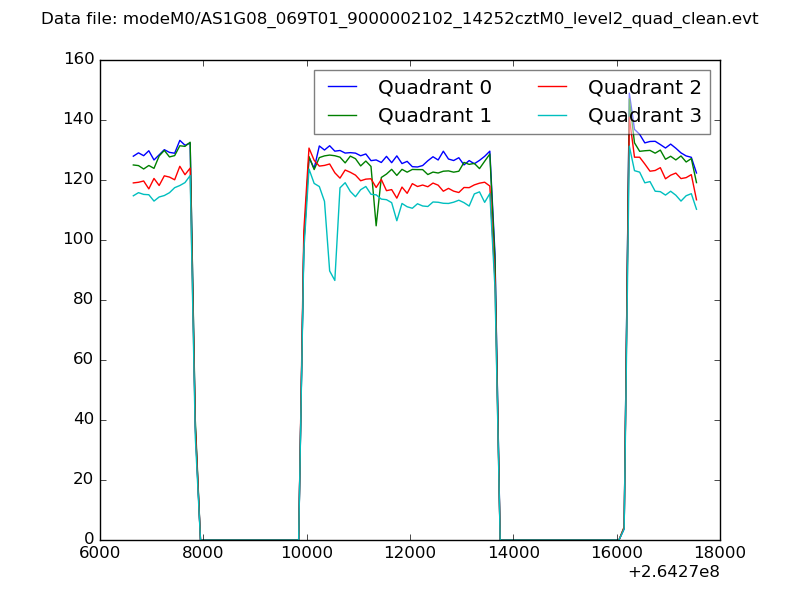 |
|
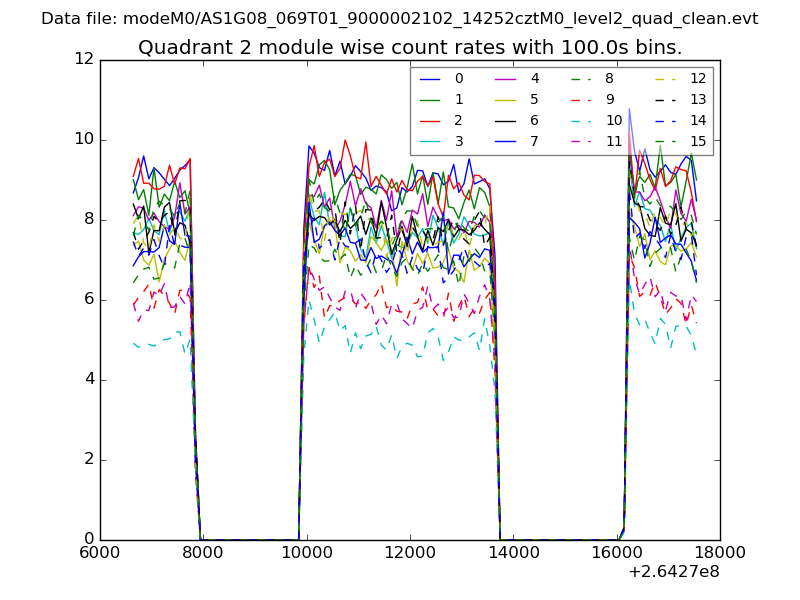
| Module-wise count rates for Quadrant A Data is divided into 100 sec bins |
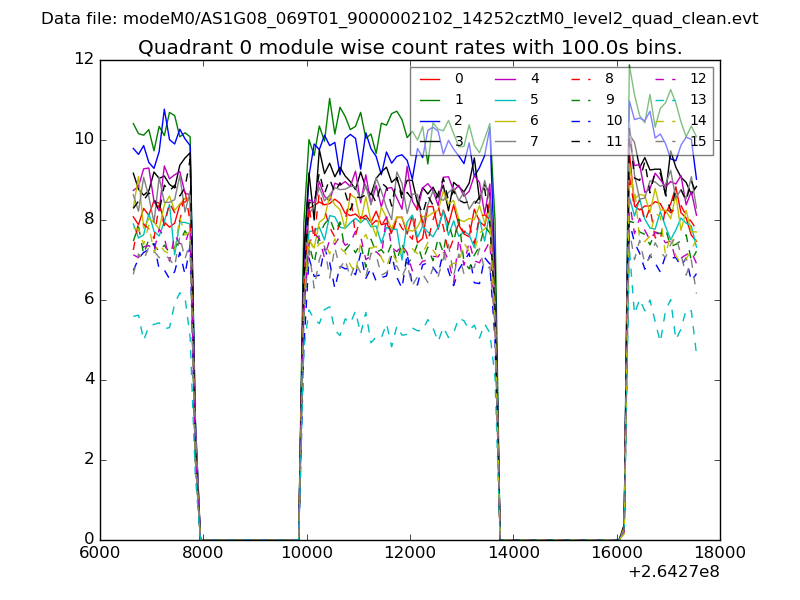 |
 |
| Module-wise count rates for Quadrant B Data is divided into 100 sec bins |
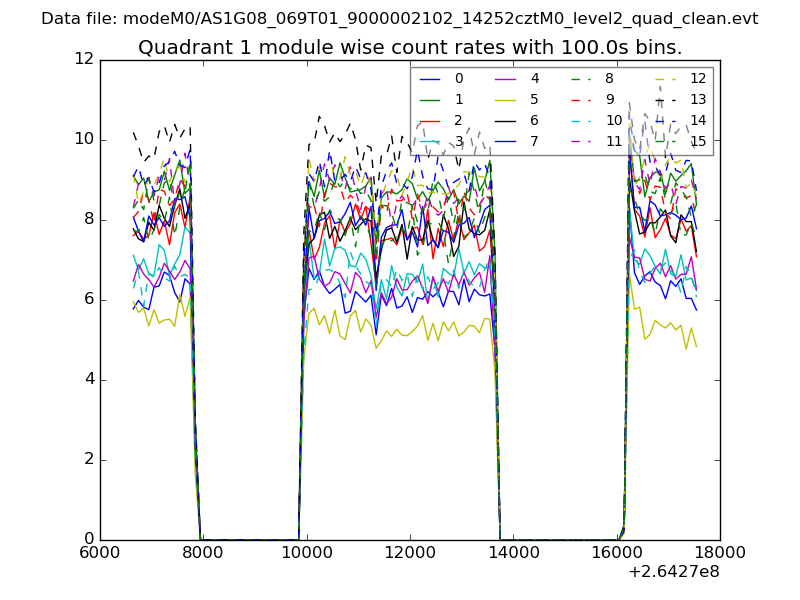 |
 |
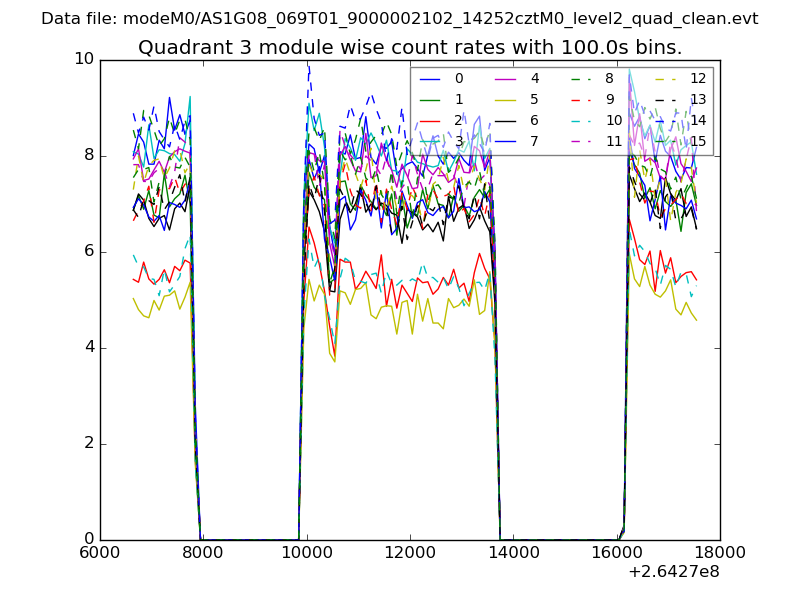
| Module-wise count rates for Quadrant C Data is divided into 100 sec bins |
 |
 |
| Module-wise count rates for Quadrant D Data is divided into 100 sec bins |
 |
 |
| Parameter | Plot |
|---|---|
| CZT HV Monitor | 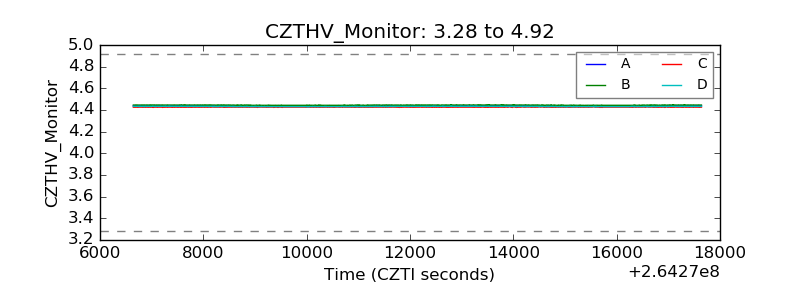 |
| D_VDD |  |
| Temperature 1 | 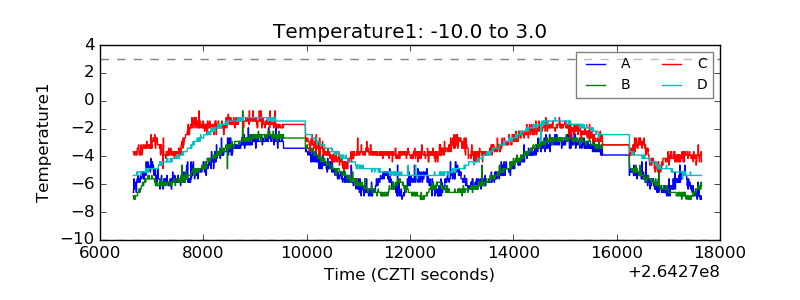 |
| Veto HV Monitor | 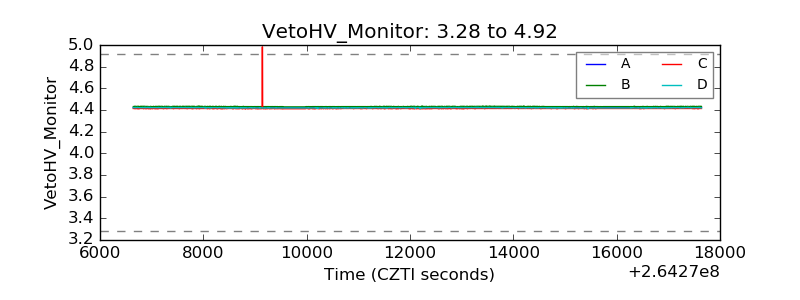 |
| Veto LLD | 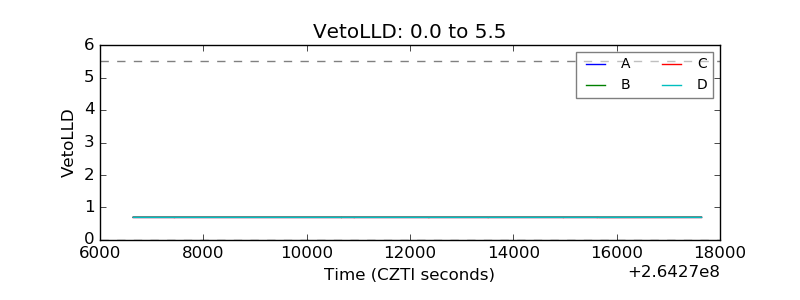 |
| Alpha Counter | 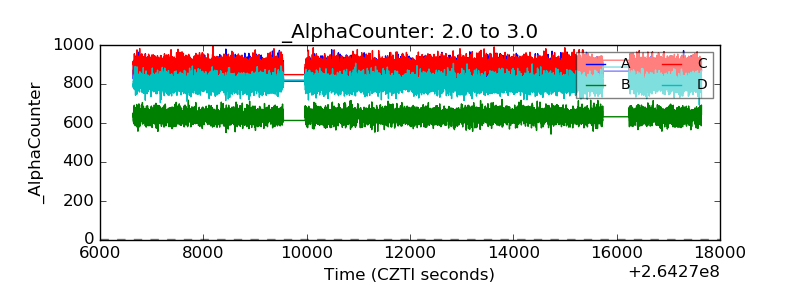 |
| _CPM_Rate | 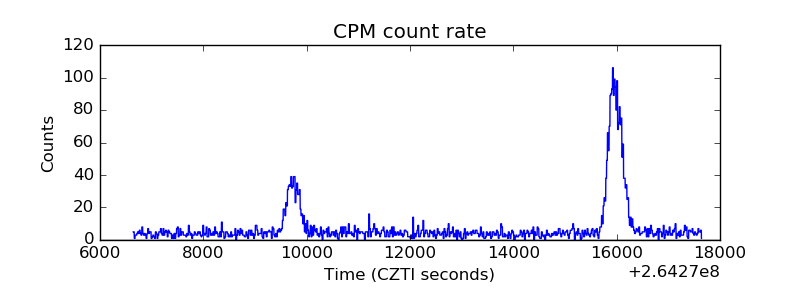 |
| CZT Counter | 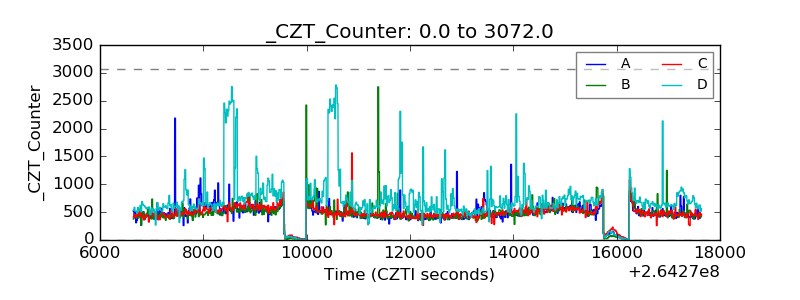 |
| +2.5 Volts monitor |  |
| +5 Volts monitor |  |
| _ROLL_ROT | 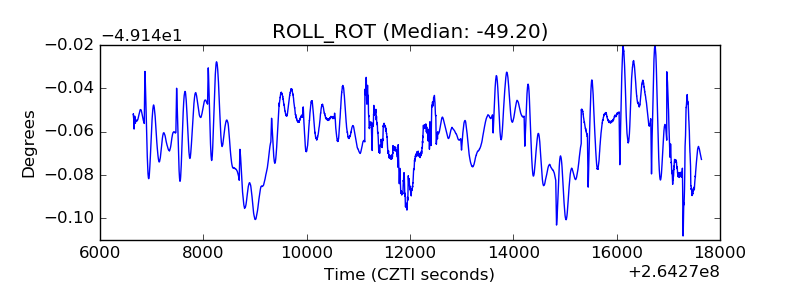 |
| _Roll_DEC | 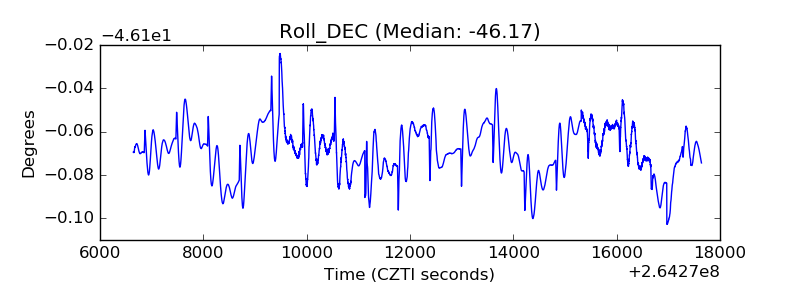 |
| _Roll_RA | 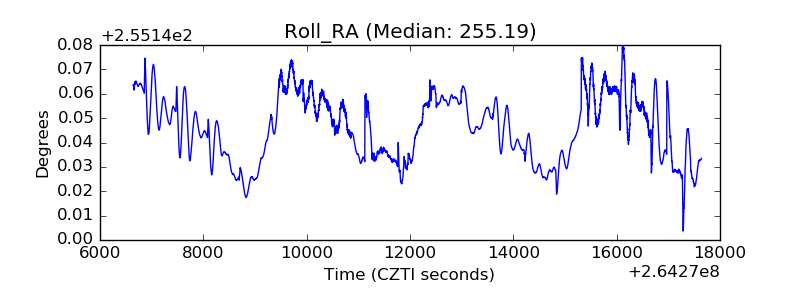 |
| Veto Counter | 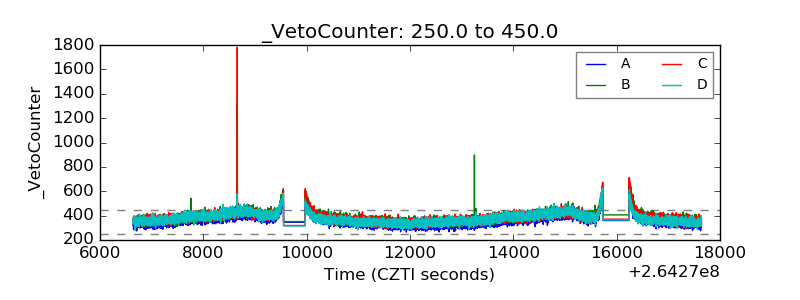 |