| Param | Original file | Final file |
|---|---|---|
| Filename | modeM0/AS1G08_014T01_9000002104_14252cztM0_level2.evt | modeM0/AS1G08_014T01_9000002104_14252cztM0_level2_quad_clean.evt |
| Size (bytes) | 742,798,080 | 121,973,760 |
| Size | 708.4 MB | 116.3 MB |
| Events in quadrant A | 4,986,095 | 780,567 |
| Events in quadrant B | 5,737,797 | 778,526 |
| Events in quadrant C | 4,697,619 | 746,562 |
| Events in quadrant D | 6,433,614 | 731,841 |
| Mode M9 | |||
|---|---|---|---|
| Quadrant | BADHDUFLAG | Total packets | Discarded packets |
| A | 0 | 16 | 0 |
| B | 0 | 16 | 0 |
| C | 0 | 16 | 0 |
| D | 0 | 16 | 0 |
| Mode SS | |||
|---|---|---|---|
| Quadrant | BADHDUFLAG | Total packets | Discarded packets |
| A | 0 | 192 | 0 |
| B | 0 | 192 | 0 |
| C | 0 | 192 | 0 |
| D | 0 | 192 | 0 |
| Mode M0 | |||
|---|---|---|---|
| Quadrant | BADHDUFLAG | Total packets | Discarded packets |
| A | 0 | 20914 | 3 |
| B | 0 | 23344 | 2 |
| C | 0 | 19853 | 2 |
| D | 0 | 26171 | 2 |
| Quadrant | Total seconds | Saturated seconds | Saturation percentage |
|---|---|---|---|
| A | 9472 | 151 | 1.594172% |
| B | 9472 | 363 | 3.832348% |
| C | 9472 | 27 | 0.285051% |
| D | 9472 | 165 | 1.741976% |
Noise dominated data is calculated using 1-second bins in cleaned event files. If a bin has >2000 counts, and if more than 50% of those come from <1% of pixels, then it is considered to be noise-dominated and hence unusable.
| Quadrant | # 1 sec bins | Bins with >0 counts | Bins with >2000 counts | High rate bins dominated by noise | Noise dominated (total time) | Noise dominated (detector-on time) | Marked lightcurve |
|---|---|---|---|---|---|---|---|
| A | 11018 | 9475 | 63 | 63 | 0.57% | 0.66% | 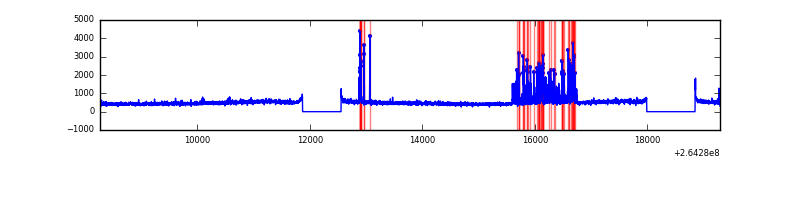 |
| B | 11018 | 9475 | 206 | 206 | 1.87% | 2.17% | 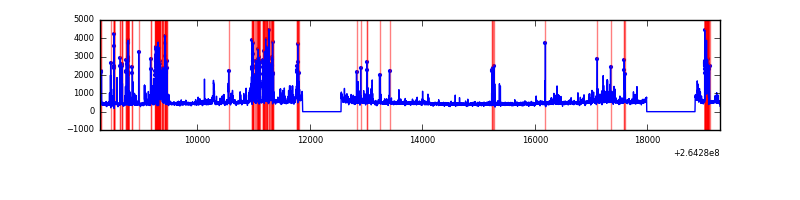 |
| C | 11018 | 9475 | 0 | 0 | 0.00% | 0.00% | 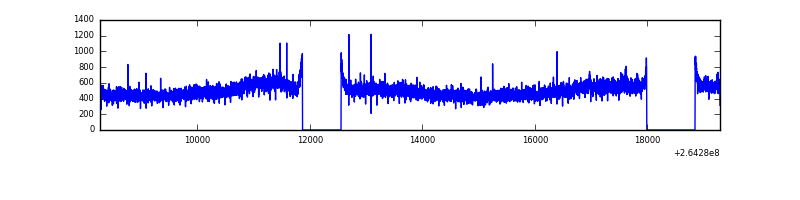 |
| D | 11018 | 9475 | 81 | 81 | 0.74% | 0.85% | 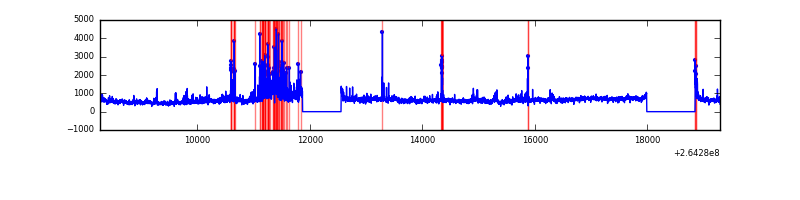 |
Top three noisy pixels from each quadrant. If the there are fewer than three noisy pixels in the level2.evt file, extra rows are filled as -1
| Pixel properties | Quadrant properties | ||||||
|---|---|---|---|---|---|---|---|
| Quadrant | DetID | PixID | Counts | Sigma | Mean | Median | Sigma |
| A | 8 | 15 | 519405 | 2279.97 | 1131 | 1107 | 227.3 |
| A | 9 | 143 | 62303 | 269.2 | 1131 | 1107 | 227.3 |
| A | 12 | 189 | 34702 | 147.78 | 1131 | 1107 | 227.3 |
| B | 10 | 245 | 991019 | 4634.34 | 1117 | 1088 | 213.6 |
| B | 0 | 229 | 199013 | 926.58 | 1117 | 1088 | 213.6 |
| B | 0 | 182 | 76958 | 355.18 | 1117 | 1088 | 213.6 |
| C | 3 | 233 | 424460 | 1670.34 | 1095 | 1104 | 253.5 |
| C | 13 | 61 | 7992 | 27.18 | 1095 | 1104 | 253.5 |
| C | 10 | 22 | 3130 | 7.99 | 1095 | 1104 | 253.5 |
| D | 8 | 195 | 1477615 | 5650.0 | 1091 | 1062 | 261.3 |
| D | 5 | 222 | 291730 | 1112.24 | 1091 | 1062 | 261.3 |
| D | 1 | 52 | 282944 | 1078.62 | 1091 | 1062 | 261.3 |
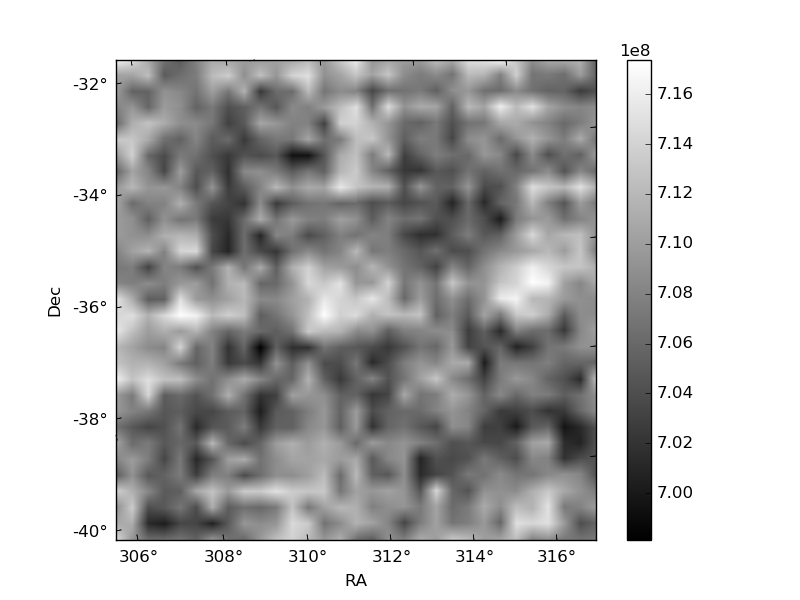
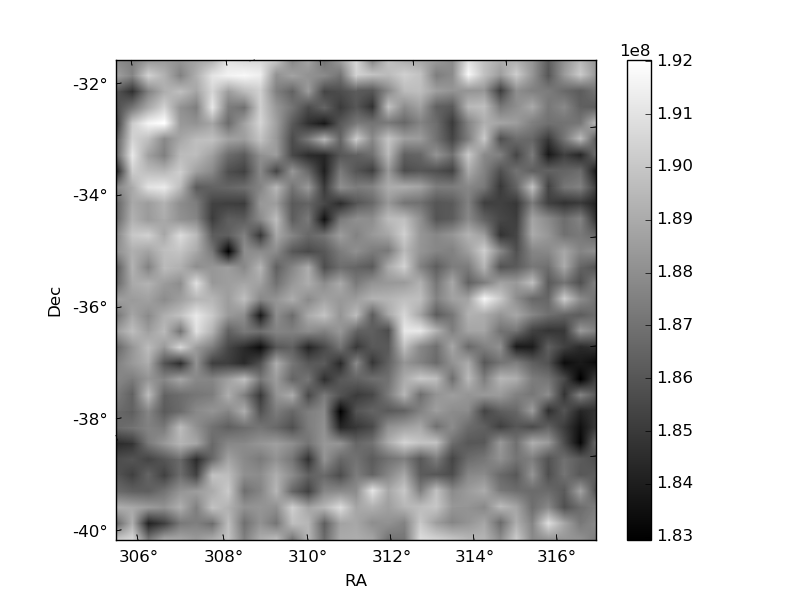
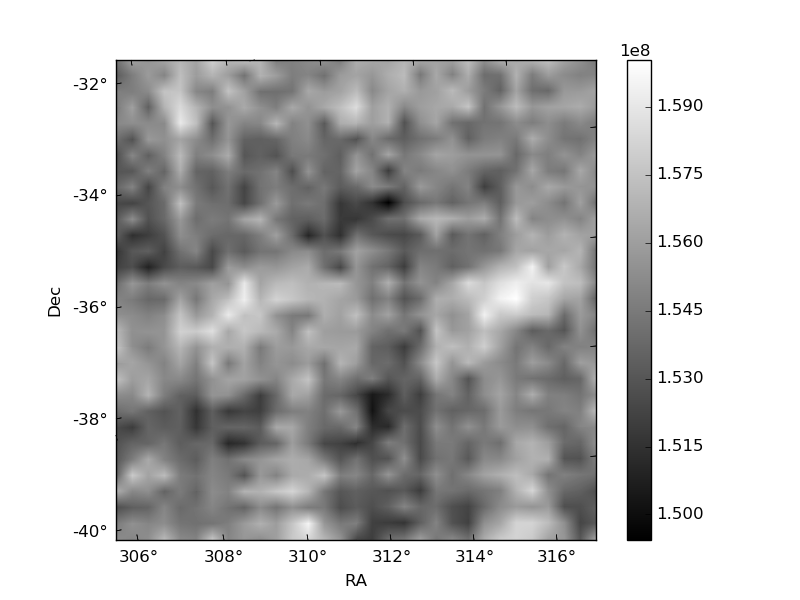
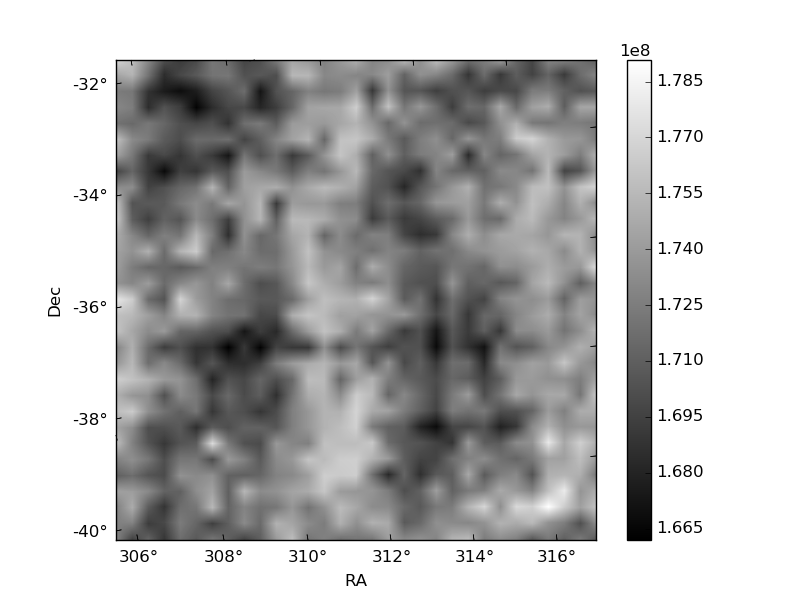
Histogram calculated using DETX and DETY for each event in the final _common_clean file
| Quadrant A | 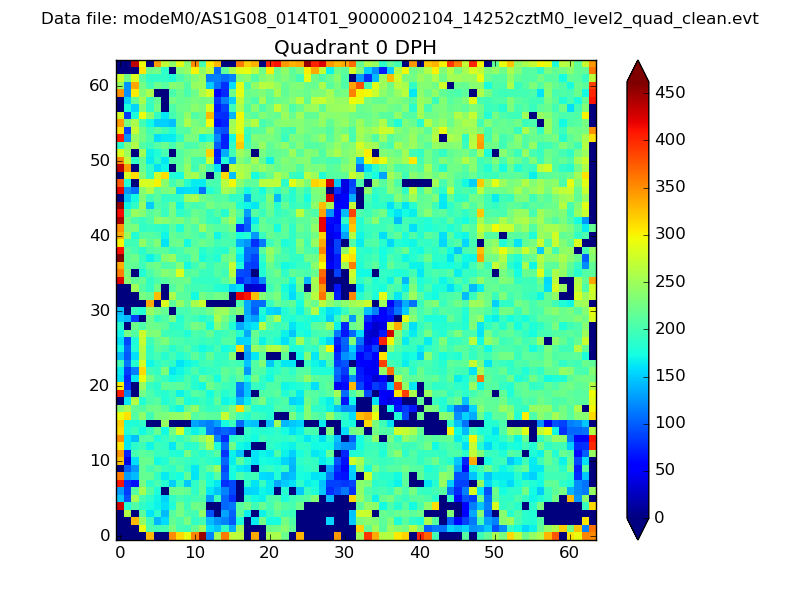 |
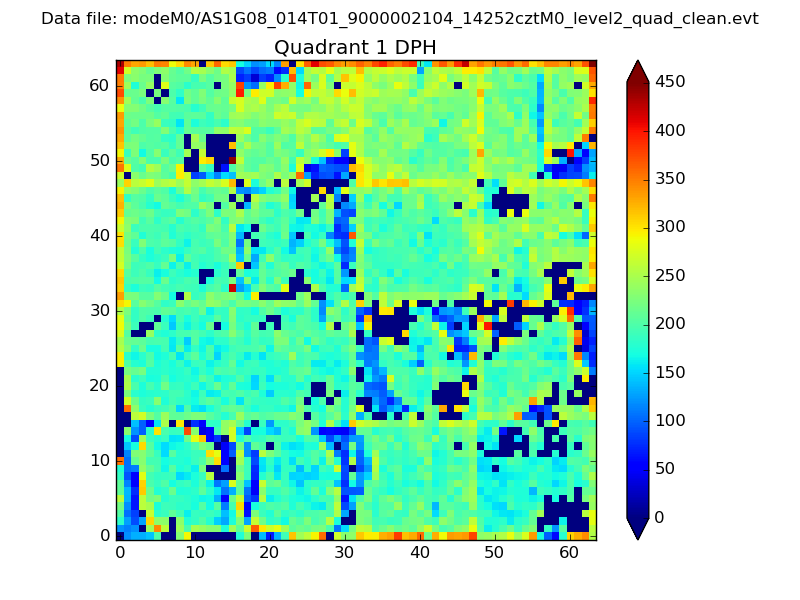 |
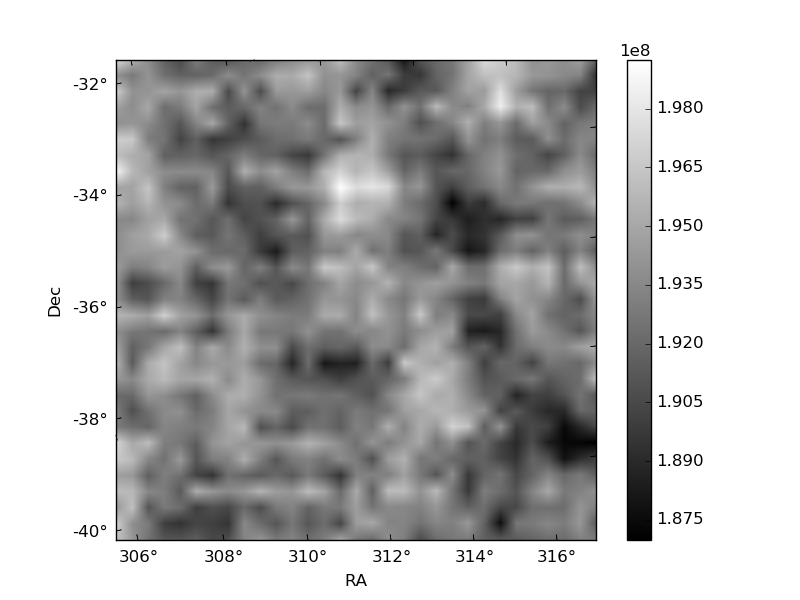
Quadrant B |
|---|---|---|---|
| Quadrant D | 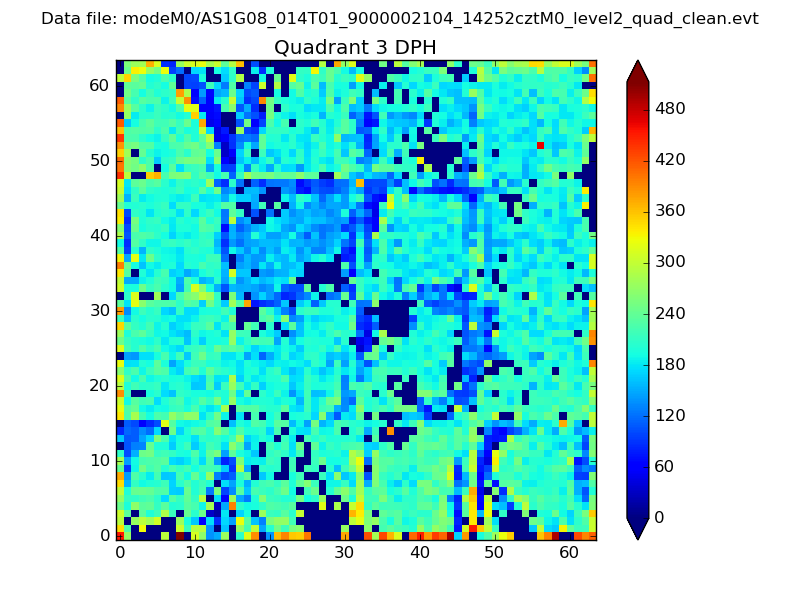 |
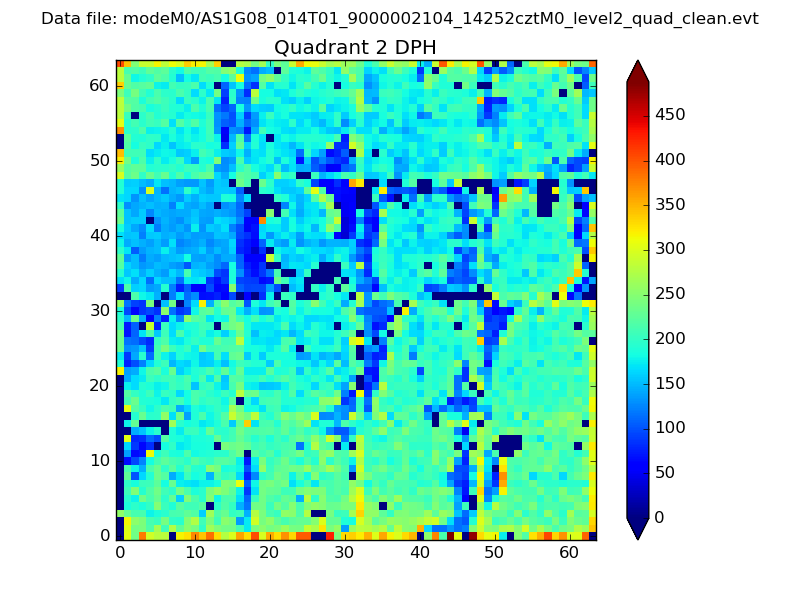 |
Quadrant C |
| Plot type | Count rate plots | Images |
|---|---|---|
| Comparison with Poisson distribution Blue bars denote a histogram of data divided into 1 sec bins. Red curve is a Poisson curve with rate = median count rate of data. |
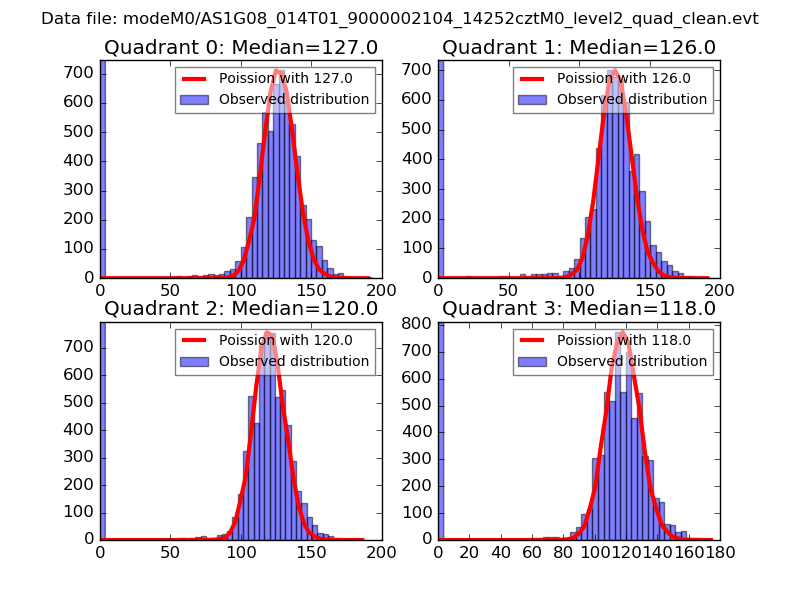 |
 |
| Quadrant-wise count rates Data is divided into 100 sec bins |
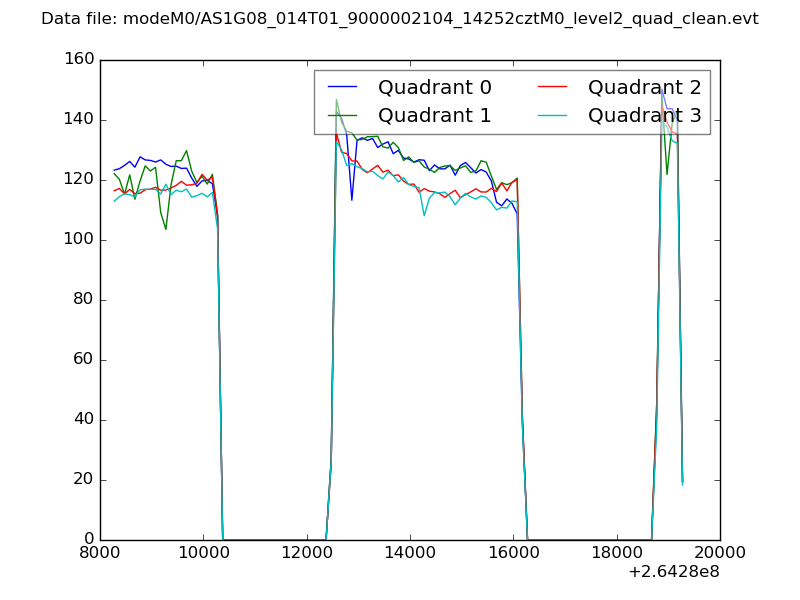 |
|
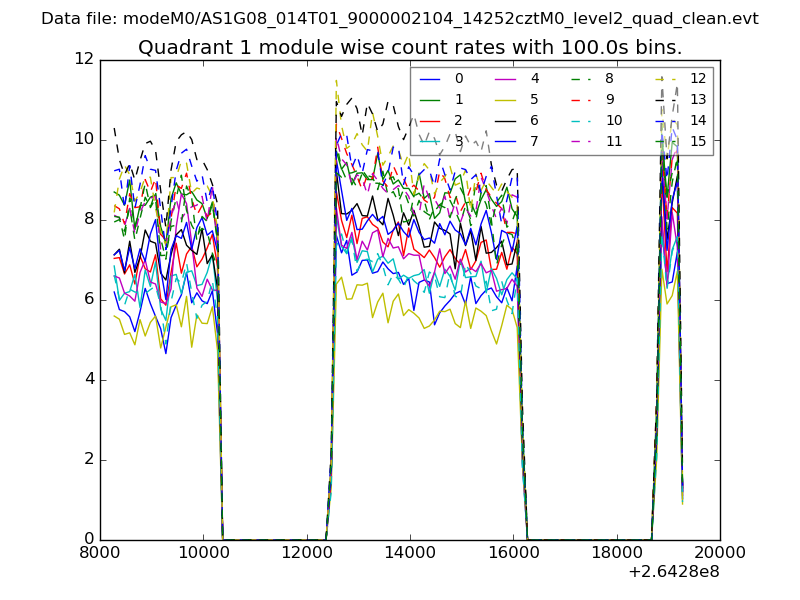
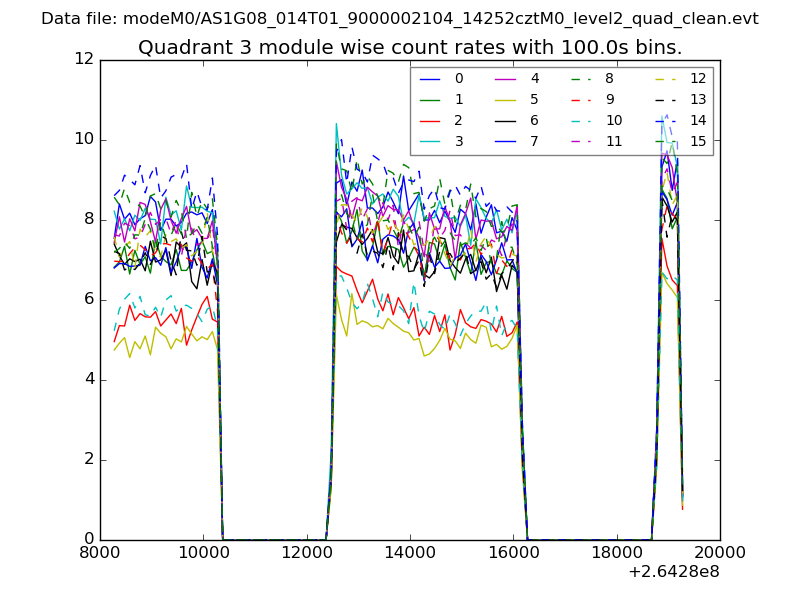
| Module-wise count rates for Quadrant A Data is divided into 100 sec bins |
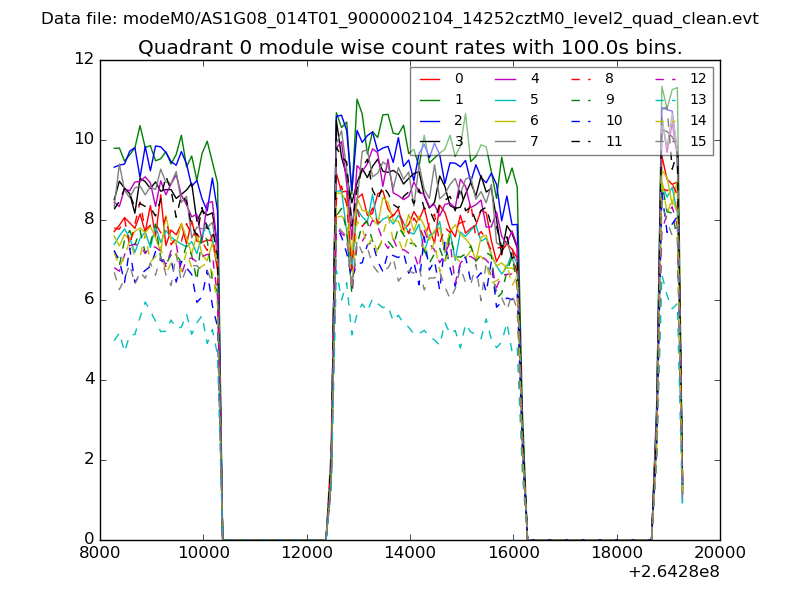 |
 |
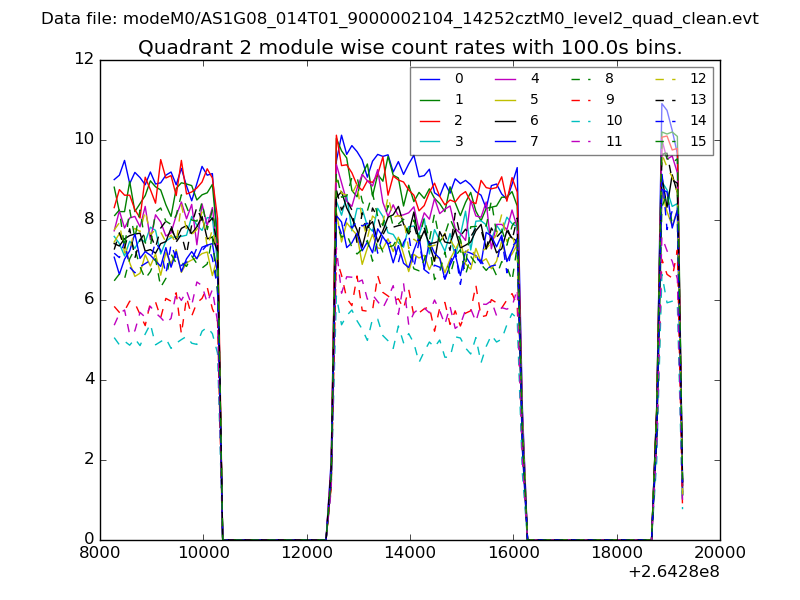
| Module-wise count rates for Quadrant B Data is divided into 100 sec bins |
 |
 |
| Module-wise count rates for Quadrant C Data is divided into 100 sec bins |
 |
 |
| Module-wise count rates for Quadrant D Data is divided into 100 sec bins |
 |
 |
| Parameter | Plot |
|---|---|
| CZT HV Monitor | 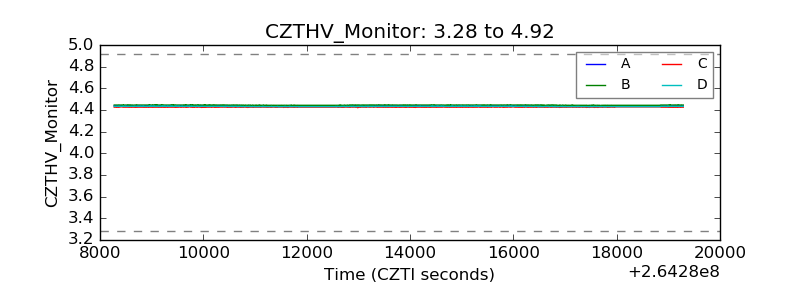 |
| D_VDD | 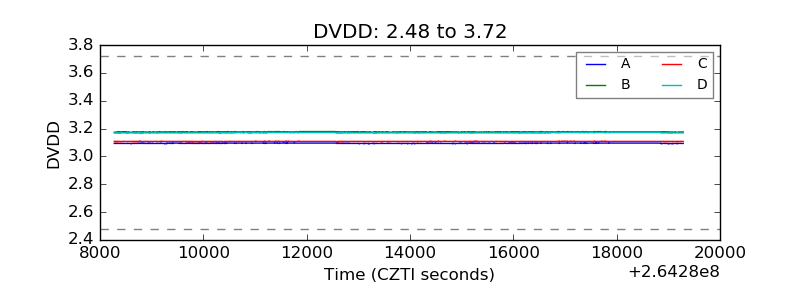 |
| Temperature 1 | 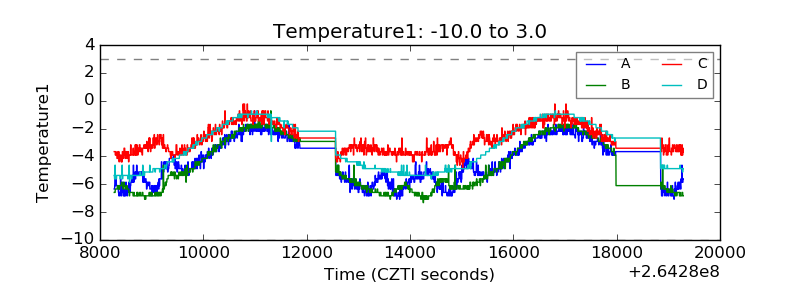 |
| Veto HV Monitor | 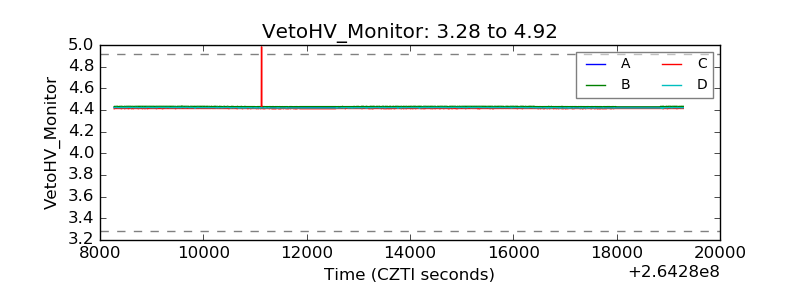 |
| Veto LLD | 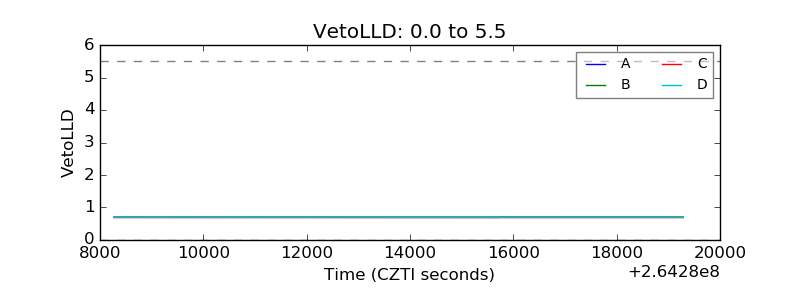 |
| Alpha Counter | 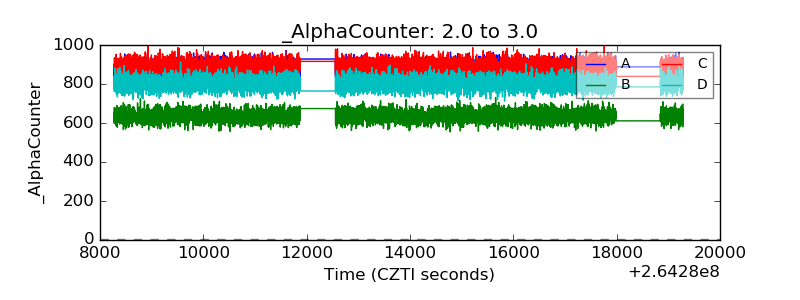 |
| _CPM_Rate | 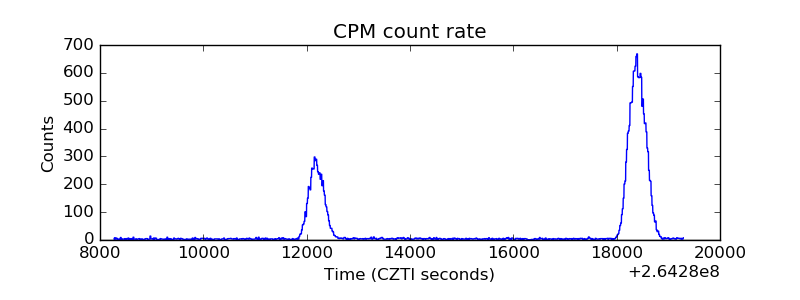 |
| CZT Counter | 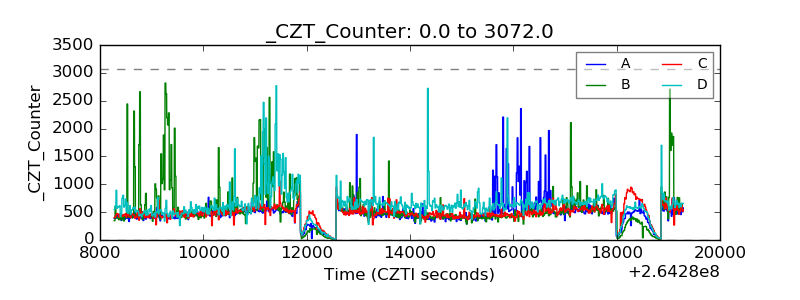 |
| +2.5 Volts monitor |  |
| +5 Volts monitor |  |
| _ROLL_ROT | 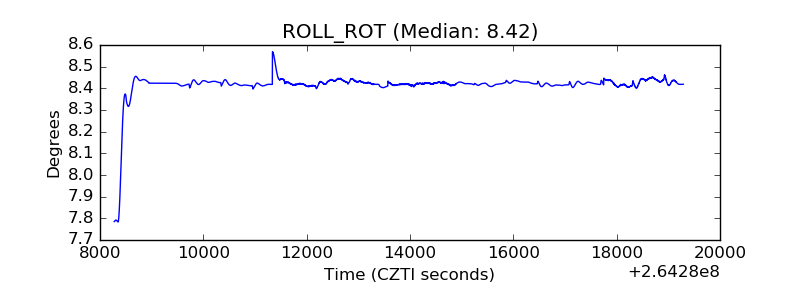 |
| _Roll_DEC | 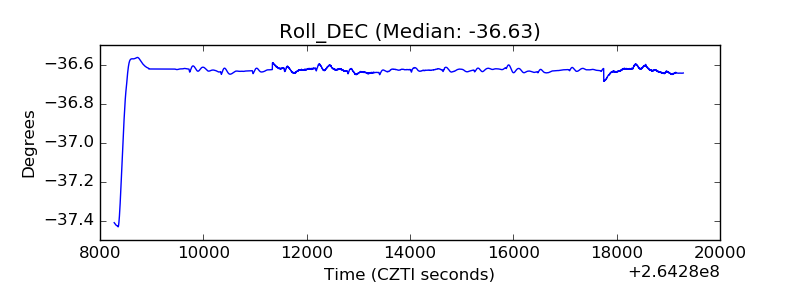 |
| _Roll_RA | 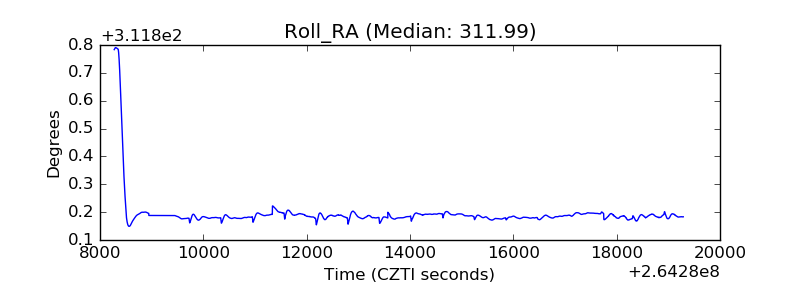 |
| Veto Counter | 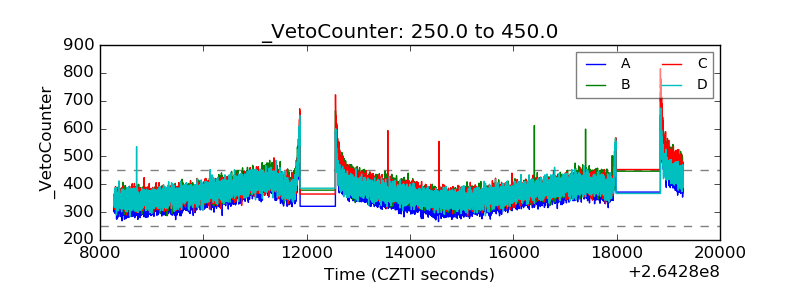 |