| Param | Original file | Final file |
|---|---|---|
| Filename | modeM0/AS1G08_014T01_9000002104_14255cztM0_level2.evt | modeM0/AS1G08_014T01_9000002104_14255cztM0_level2_quad_clean.evt |
| Size (bytes) | 859,901,760 | 149,195,520 |
| Size | 820.1 MB | 142.3 MB |
| Events in quadrant A | 5,578,779 | 970,303 |
| Events in quadrant B | 6,472,915 | 974,161 |
| Events in quadrant C | 5,677,674 | 933,148 |
| Events in quadrant D | 7,577,269 | 887,766 |
| Mode M9 | |||
|---|---|---|---|
| Quadrant | BADHDUFLAG | Total packets | Discarded packets |
| A | 0 | 26 | 2 |
| B | 0 | 29 | 4 |
| C | 0 | 28 | 3 |
| D | 0 | 30 | 6 |
| Mode SS | |||
|---|---|---|---|
| Quadrant | BADHDUFLAG | Total packets | Discarded packets |
| A | 0 | 265 | 39 |
| B | 0 | 267 | 39 |
| C | 0 | 269 | 47 |
| D | 0 | 266 | 50 |
| Mode M0 | |||
|---|---|---|---|
| Quadrant | BADHDUFLAG | Total packets | Discarded packets |
| A | 0 | 28204 | 4657 |
| B | 0 | 30930 | 4777 |
| C | 0 | 27628 | 4541 |
| D | 0 | 36821 | 6431 |
| Quadrant | Total seconds | Saturated seconds | Saturation percentage |
|---|---|---|---|
| A | 10906 | 54 | 0.495140% |
| B | 10918 | 368 | 3.370581% |
| C | 10936 | 34 | 0.310900% |
| D | 10696 | 119 | 1.112565% |
Noise dominated data is calculated using 1-second bins in cleaned event files. If a bin has >2000 counts, and if more than 50% of those come from <1% of pixels, then it is considered to be noise-dominated and hence unusable.
| Quadrant | # 1 sec bins | Bins with >0 counts | Bins with >2000 counts | High rate bins dominated by noise | Noise dominated (total time) | Noise dominated (detector-on time) | Marked lightcurve |
|---|---|---|---|---|---|---|---|
| A | 20515 | 11457 | 2 | 2 | 0.01% | 0.02% | 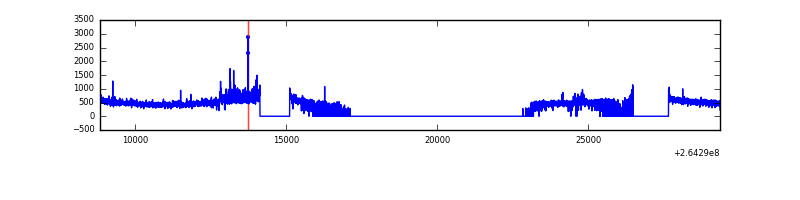 |
| B | 20515 | 11467 | 191 | 191 | 0.93% | 1.67% | 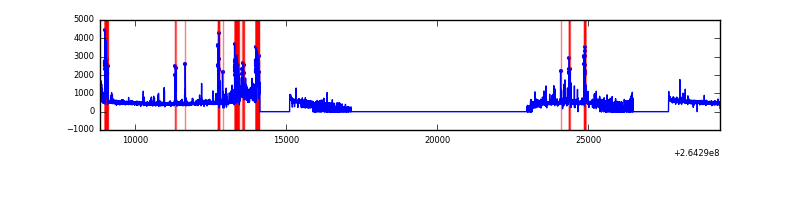 |
| C | 20515 | 11491 | 0 | 0 | 0.00% | 0.00% | 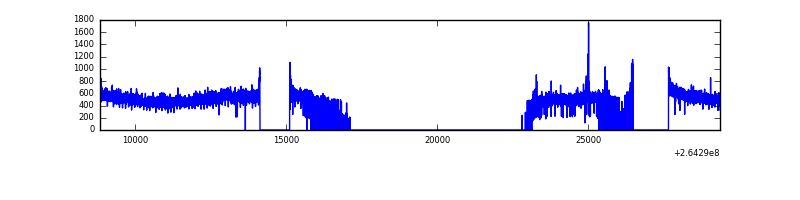 |
| D | 20515 | 11206 | 33 | 33 | 0.16% | 0.29% | 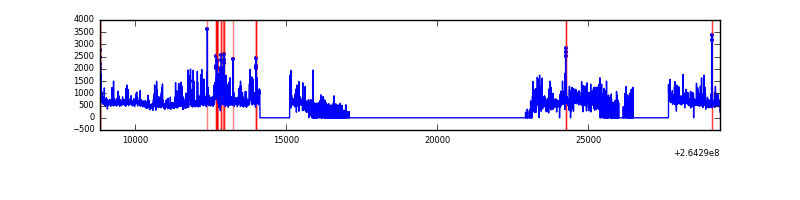 |
Top three noisy pixels from each quadrant. If the there are fewer than three noisy pixels in the level2.evt file, extra rows are filled as -1
| Pixel properties | Quadrant properties | ||||||
|---|---|---|---|---|---|---|---|
| Quadrant | DetID | PixID | Counts | Sigma | Mean | Median | Sigma |
| A | 8 | 15 | 206218 | 755.69 | 1353 | 1325 | 271.1 |
| A | 12 | 189 | 124981 | 456.07 | 1353 | 1325 | 271.1 |
| A | 9 | 143 | 25584 | 89.47 | 1353 | 1325 | 271.1 |
| B | 0 | 182 | 598895 | 2414.41 | 1332 | 1301 | 247.5 |
| B | 0 | 229 | 285152 | 1146.82 | 1332 | 1301 | 247.5 |
| B | 10 | 245 | 258063 | 1037.37 | 1332 | 1301 | 247.5 |
| C | 3 | 233 | 538477 | 1775.38 | 1315 | 1324 | 302.6 |
| C | 13 | 61 | 9405 | 26.71 | 1315 | 1324 | 302.6 |
| C | 14 | 234 | 8685 | 24.33 | 1315 | 1324 | 302.6 |
| D | 8 | 195 | 1223253 | 4044.88 | 1282 | 1254 | 302.1 |
| D | 13 | 122 | 676676 | 2235.68 | 1282 | 1254 | 302.1 |
| D | 5 | 222 | 307841 | 1014.82 | 1282 | 1254 | 302.1 |
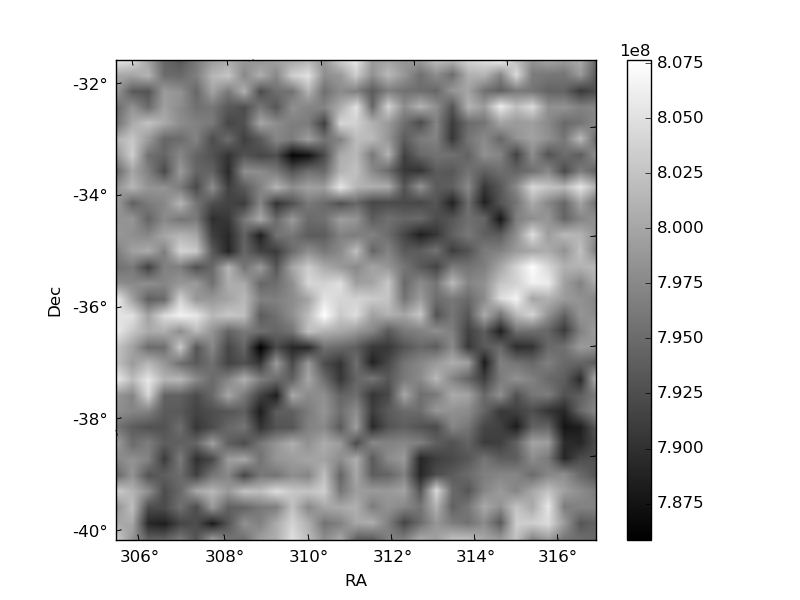
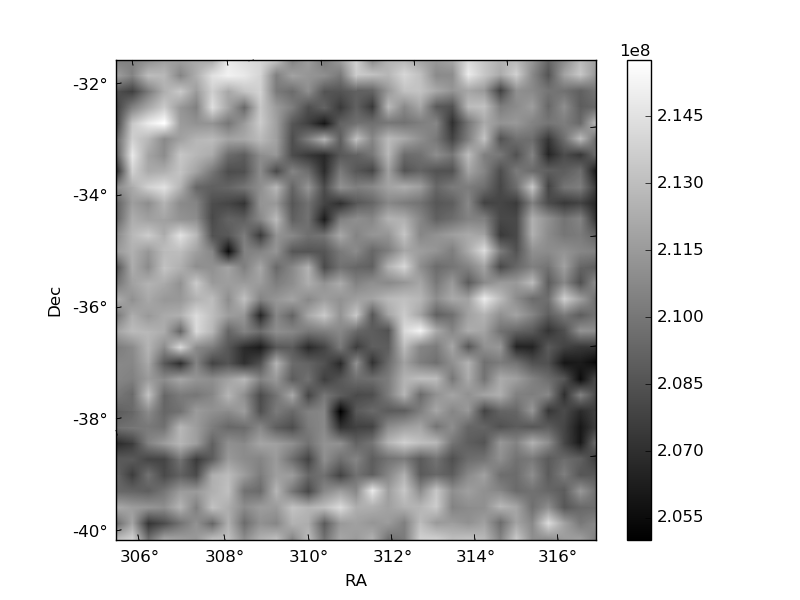
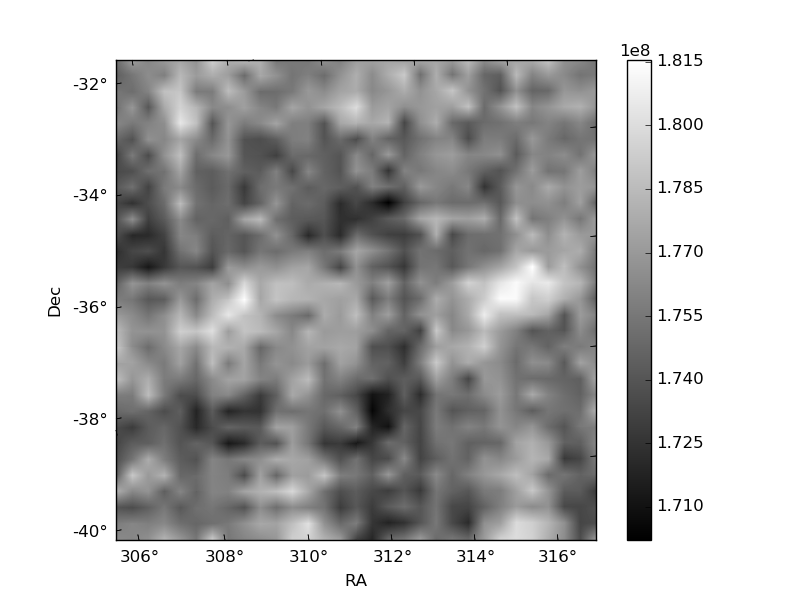
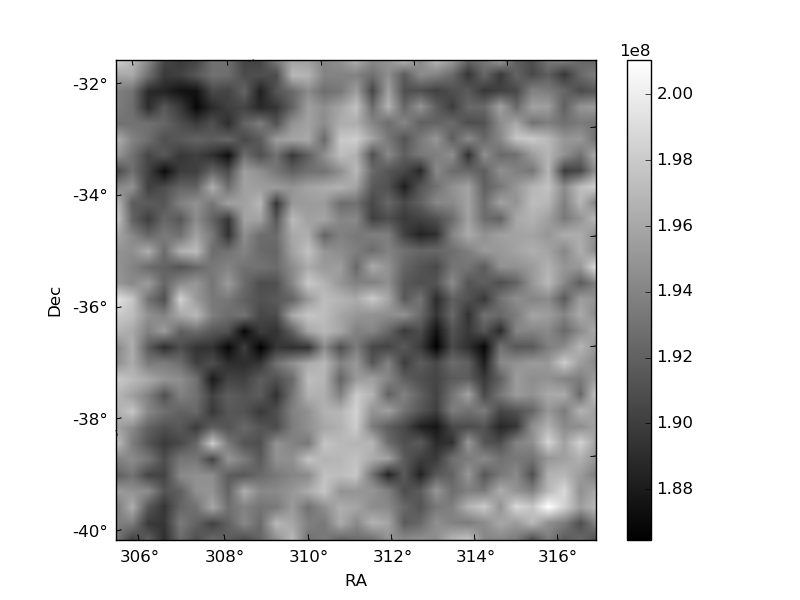
Histogram calculated using DETX and DETY for each event in the final _common_clean file
| Quadrant A | 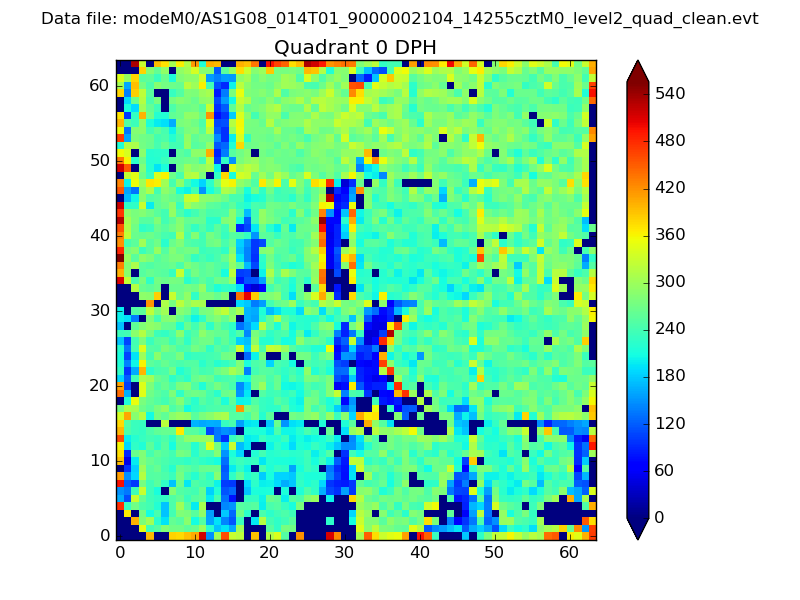 |
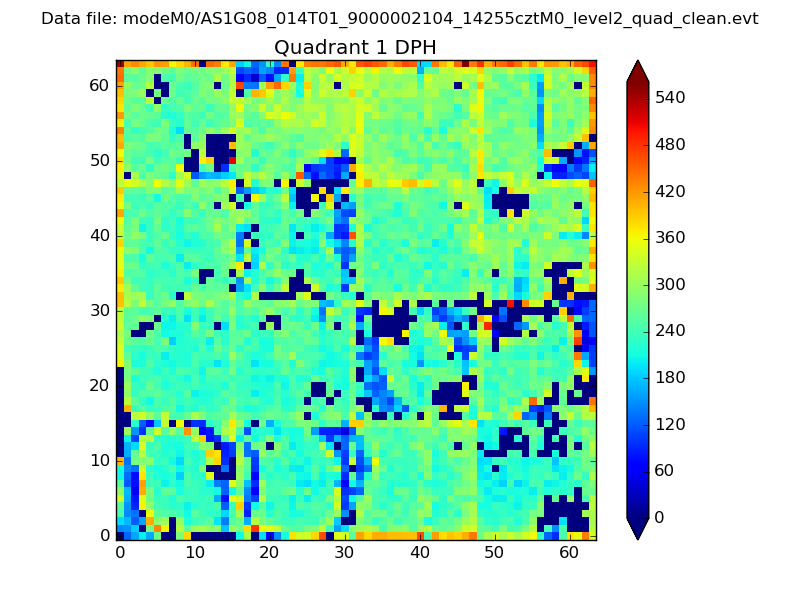 |
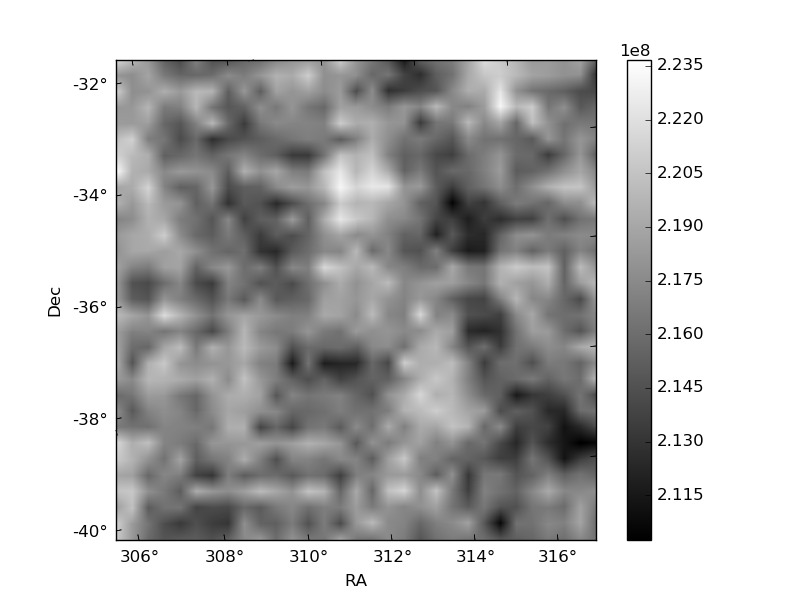
Quadrant B |
|---|---|---|---|
| Quadrant D | 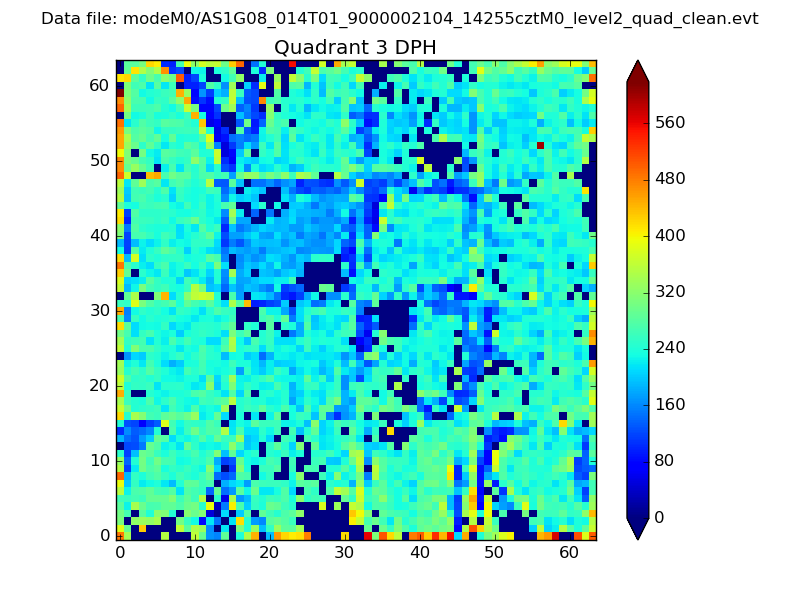 |
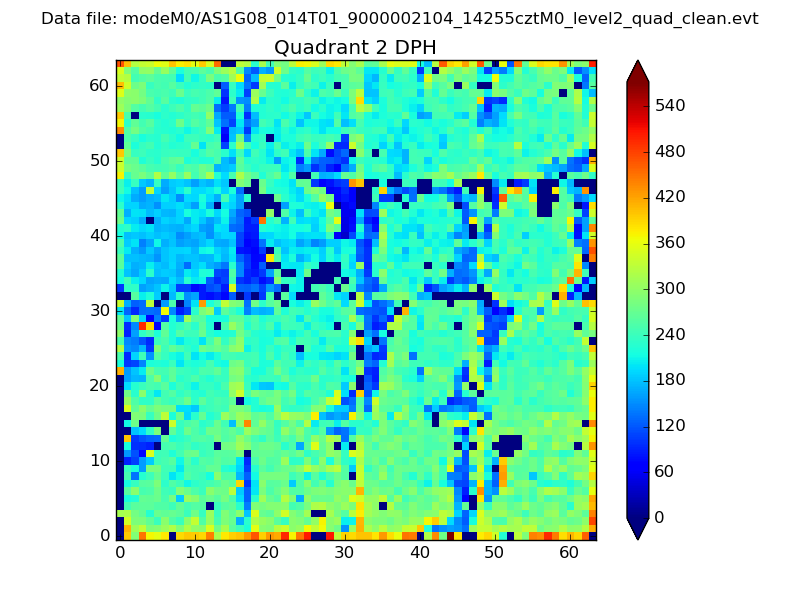 |
Quadrant C |
| Plot type | Count rate plots | Images |
|---|---|---|
| Comparison with Poisson distribution Blue bars denote a histogram of data divided into 1 sec bins. Red curve is a Poisson curve with rate = median count rate of data. |
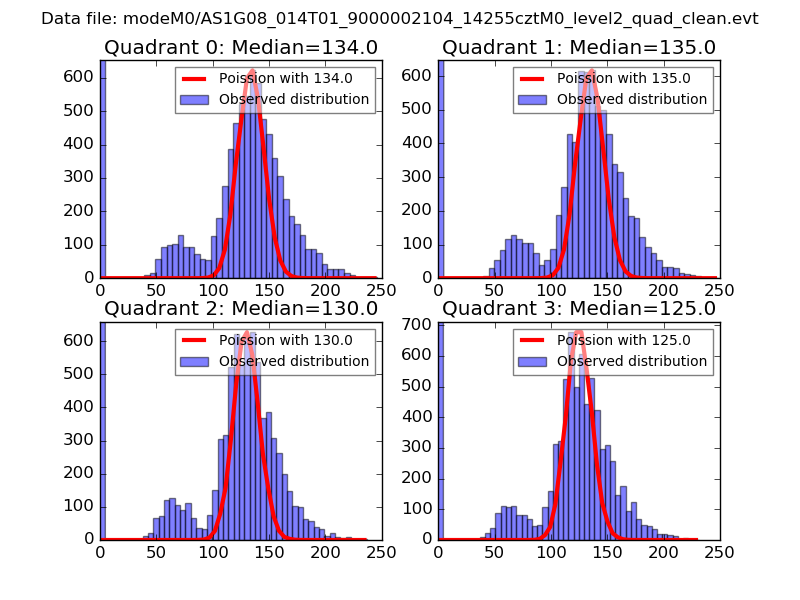 |
 |
| Quadrant-wise count rates Data is divided into 100 sec bins |
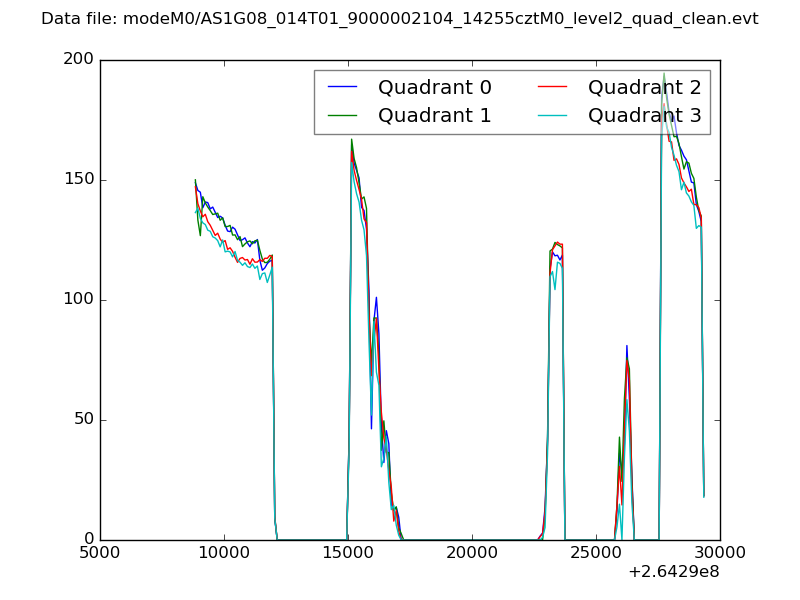 |
|
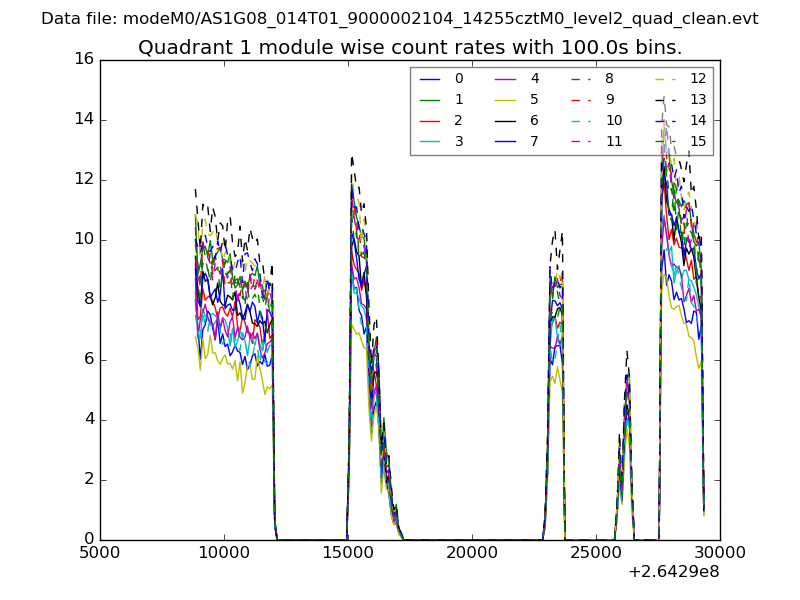
| Module-wise count rates for Quadrant A Data is divided into 100 sec bins |
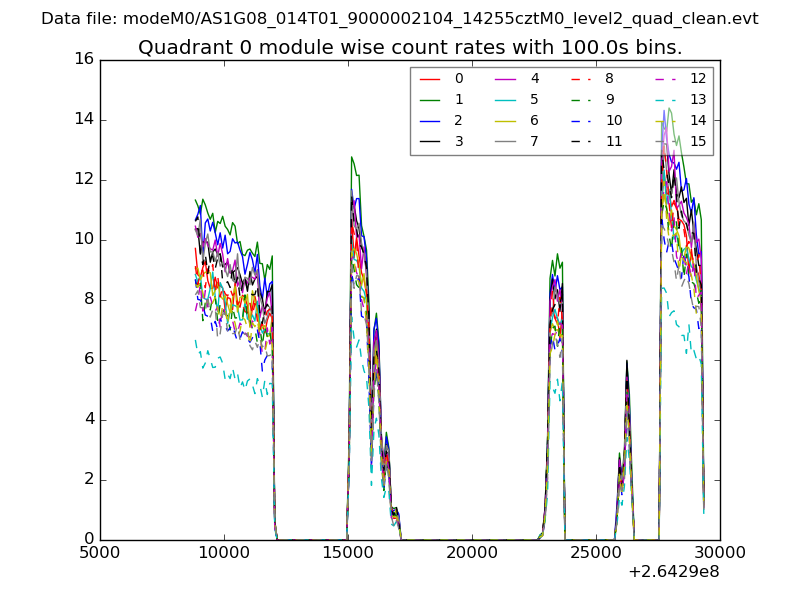 |
 |
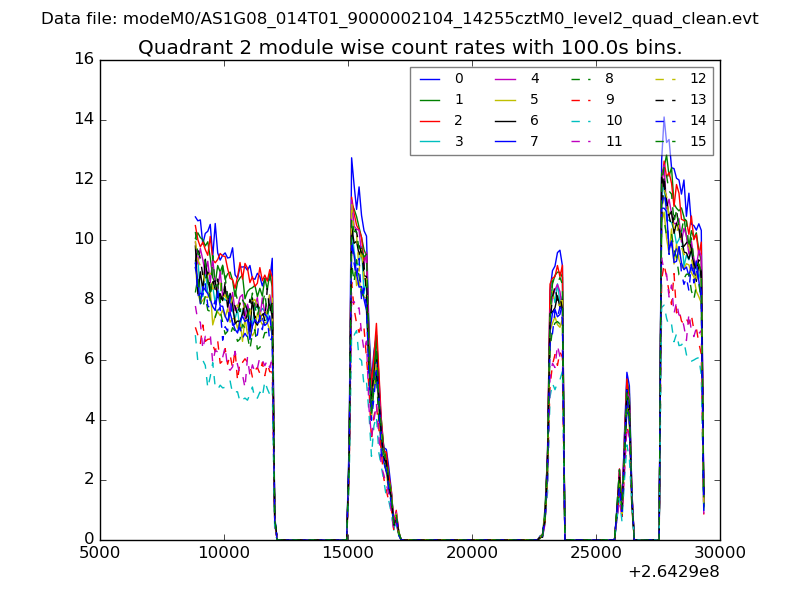
| Module-wise count rates for Quadrant B Data is divided into 100 sec bins |
 |
 |
| Module-wise count rates for Quadrant C Data is divided into 100 sec bins |
 |
 |
| Module-wise count rates for Quadrant D Data is divided into 100 sec bins |
 |
 |
| Parameter | Plot |
|---|---|
| CZT HV Monitor | 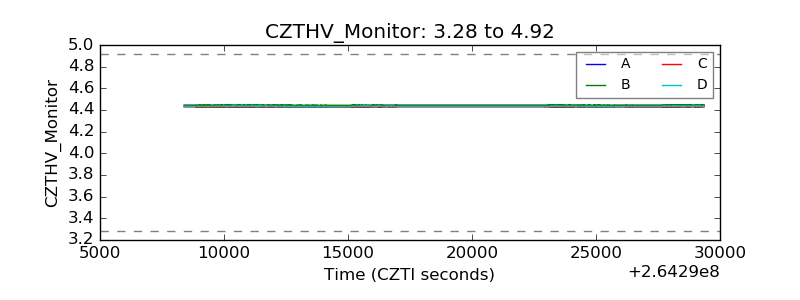 |
| D_VDD | 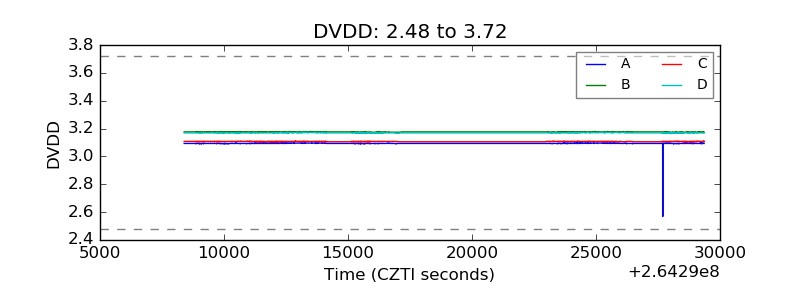 |
| Temperature 1 | 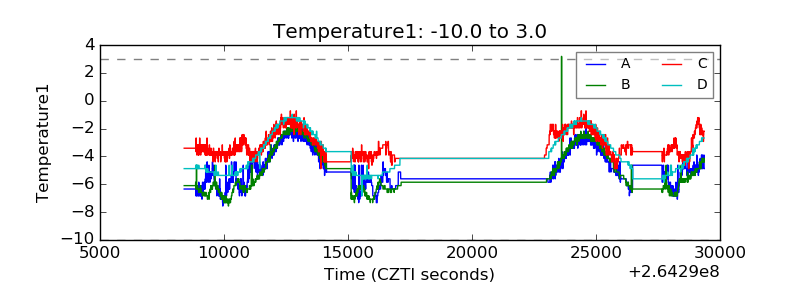 |
| Veto HV Monitor | 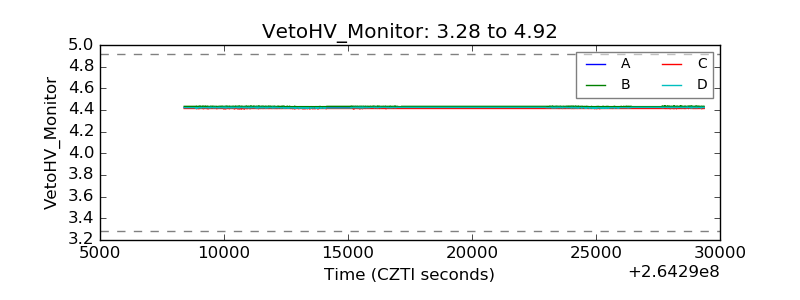 |
| Veto LLD | 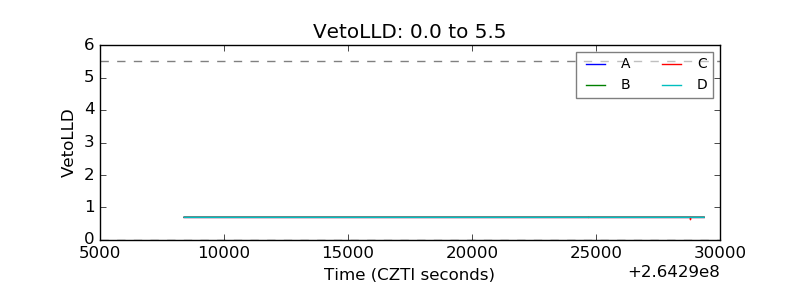 |
| Alpha Counter | 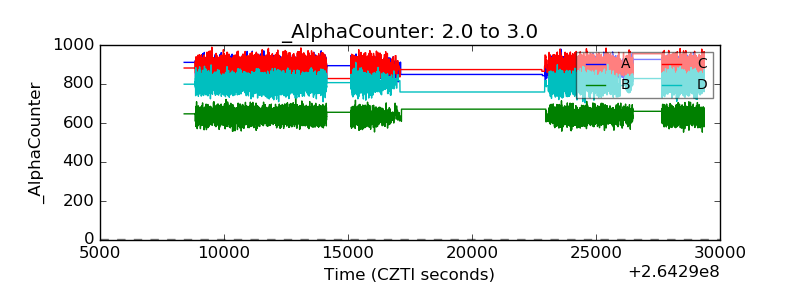 |
| _CPM_Rate | 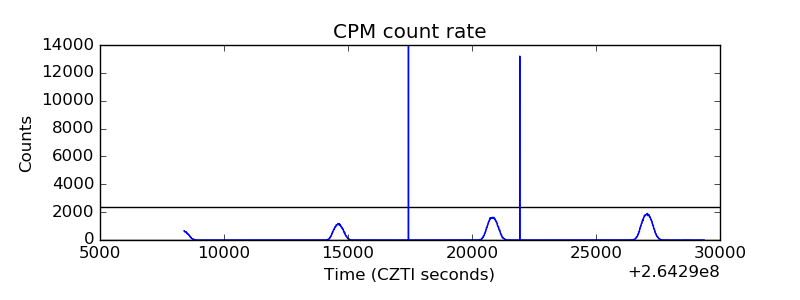 |
| CZT Counter | 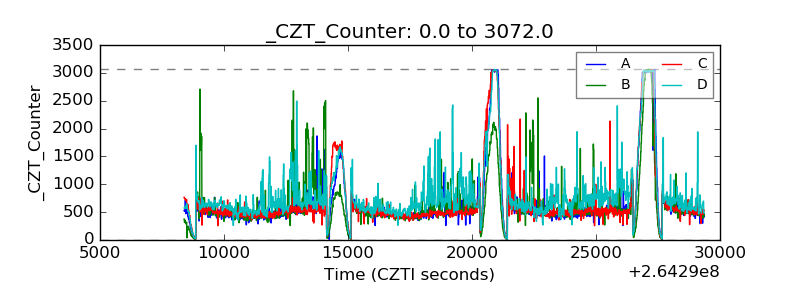 |
| +2.5 Volts monitor |  |
| +5 Volts monitor |  |
| _ROLL_ROT | 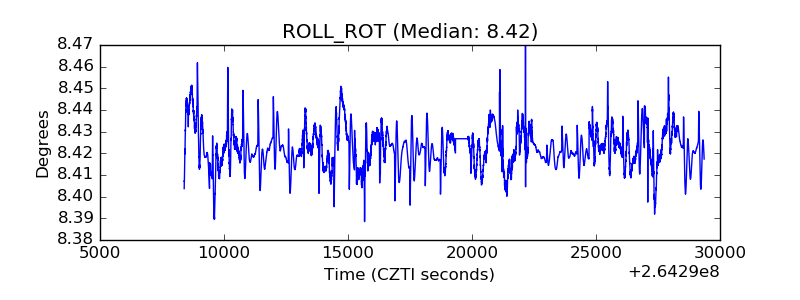 |
| _Roll_DEC | 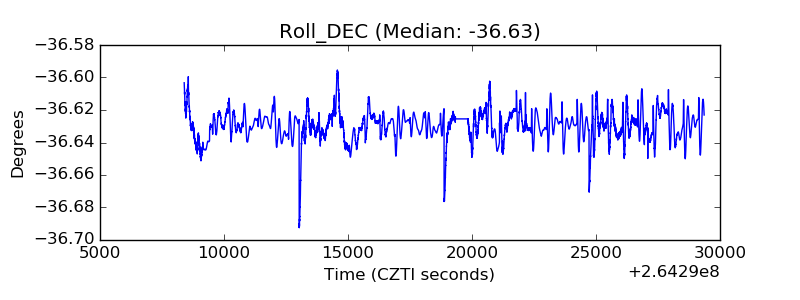 |
| _Roll_RA | 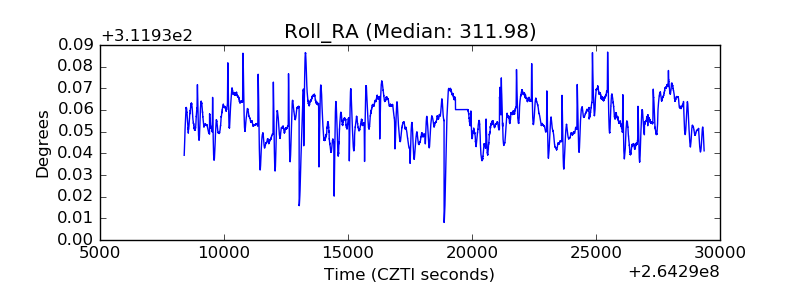 |
| Veto Counter |  |