| Param | Original file | Final file |
|---|---|---|
| Filename | modeM0/AS1G08_014T01_9000002104_14256cztM0_level2.evt | modeM0/AS1G08_014T01_9000002104_14256cztM0_level2_quad_clean.evt |
| Size (bytes) | 1,832,045,760 | 302,538,240 |
| Size | 1.7 GB | 288.5 MB |
| Events in quadrant A | 11,942,267 | 1,948,492 |
| Events in quadrant B | 13,388,138 | 1,944,255 |
| Events in quadrant C | 12,229,918 | 1,858,142 |
| Events in quadrant D | 16,363,865 | 1,820,237 |
| Mode M9 | |||
|---|---|---|---|
| Quadrant | BADHDUFLAG | Total packets | Discarded packets |
| A | 0 | 55 | 0 |
| B | 0 | 55 | 0 |
| C | 0 | 55 | 0 |
| D | 0 | 55 | 0 |
| Mode SS | |||
|---|---|---|---|
| Quadrant | BADHDUFLAG | Total packets | Discarded packets |
| A | 0 | 470 | 0 |
| B | 0 | 470 | 0 |
| C | 0 | 470 | 0 |
| D | 0 | 470 | 0 |
| Mode M0 | |||
|---|---|---|---|
| Quadrant | BADHDUFLAG | Total packets | Discarded packets |
| A | 0 | 49737 | 6 |
| B | 0 | 54276 | 5 |
| C | 0 | 49602 | 5 |
| D | 0 | 65023 | 5 |
| Quadrant | Total seconds | Saturated seconds | Saturation percentage |
|---|---|---|---|
| A | 23149 | 169 | 0.730053% |
| B | 23149 | 599 | 2.587585% |
| C | 23149 | 176 | 0.760292% |
| D | 23149 | 347 | 1.498985% |
Noise dominated data is calculated using 1-second bins in cleaned event files. If a bin has >2000 counts, and if more than 50% of those come from <1% of pixels, then it is considered to be noise-dominated and hence unusable.
| Quadrant | # 1 sec bins | Bins with >0 counts | Bins with >2000 counts | High rate bins dominated by noise | Noise dominated (total time) | Noise dominated (detector-on time) | Marked lightcurve |
|---|---|---|---|---|---|---|---|
| A | 28526 | 23157 | 2 | 2 | 0.01% | 0.01% | 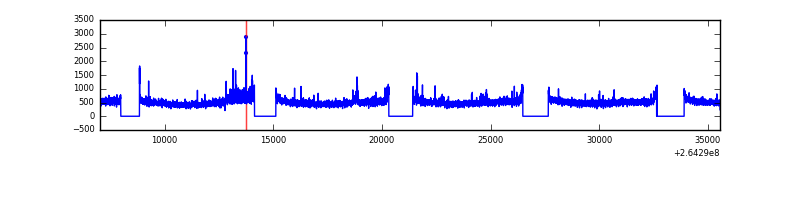 |
| B | 28526 | 23157 | 244 | 244 | 0.86% | 1.05% | 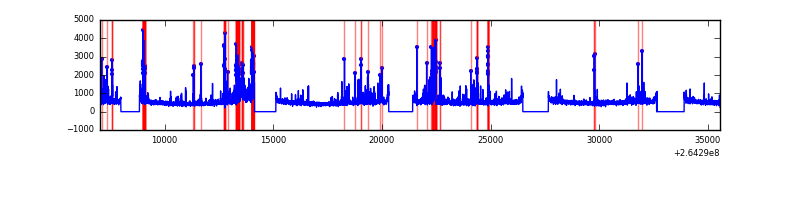 |
| C | 28526 | 23157 | 23 | 23 | 0.08% | 0.10% | 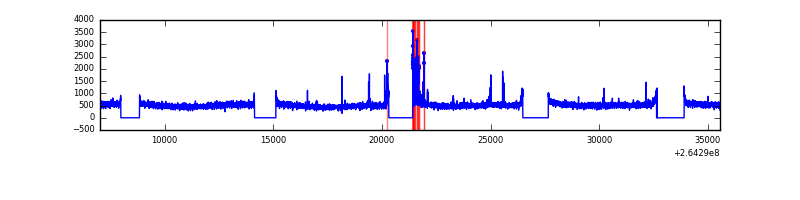 |
| D | 28526 | 23157 | 104 | 104 | 0.36% | 0.45% | 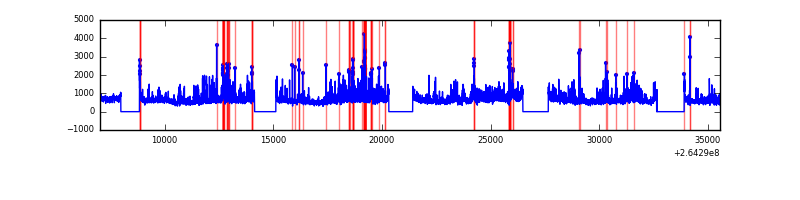 |
Top three noisy pixels from each quadrant. If the there are fewer than three noisy pixels in the level2.evt file, extra rows are filled as -1
| Pixel properties | Quadrant properties | ||||||
|---|---|---|---|---|---|---|---|
| Quadrant | DetID | PixID | Counts | Sigma | Mean | Median | Sigma |
| A | 8 | 15 | 300580 | 508.32 | 2936 | 2879 | 585.7 |
| A | 12 | 189 | 297247 | 502.62 | 2936 | 2879 | 585.7 |
| A | 9 | 143 | 28234 | 43.29 | 2936 | 2879 | 585.7 |
| B | 0 | 182 | 678860 | 1255.73 | 2887 | 2818 | 538.4 |
| B | 10 | 245 | 636869 | 1177.73 | 2887 | 2818 | 538.4 |
| B | 0 | 229 | 521412 | 963.27 | 2887 | 2818 | 538.4 |
| C | 3 | 233 | 1204187 | 1856.19 | 2823 | 2842 | 647.2 |
| C | 13 | 61 | 20088 | 26.65 | 2823 | 2842 | 647.2 |
| C | 14 | 234 | 15361 | 19.34 | 2823 | 2842 | 647.2 |
| D | 8 | 195 | 2285416 | 3435.46 | 2830 | 2764 | 664.4 |
| D | 13 | 122 | 1942974 | 2920.07 | 2830 | 2764 | 664.4 |
| D | 5 | 222 | 544565 | 815.43 | 2830 | 2764 | 664.4 |
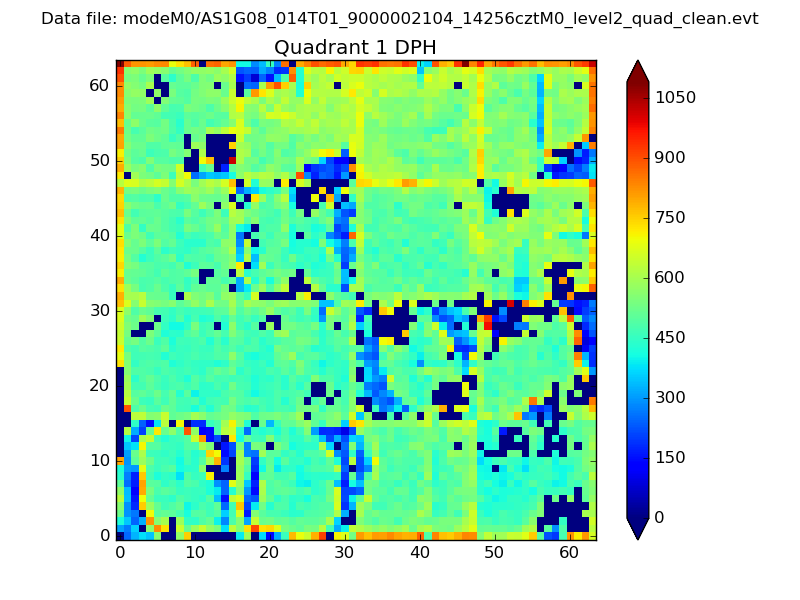
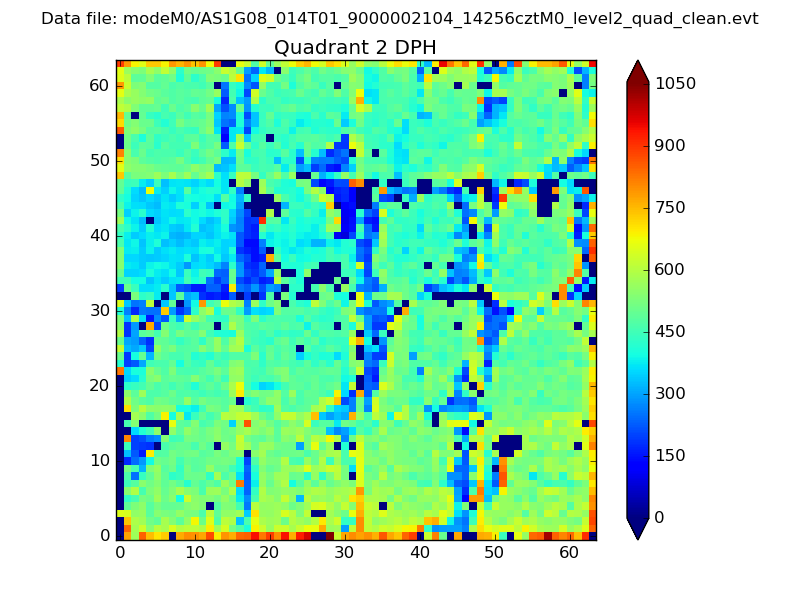
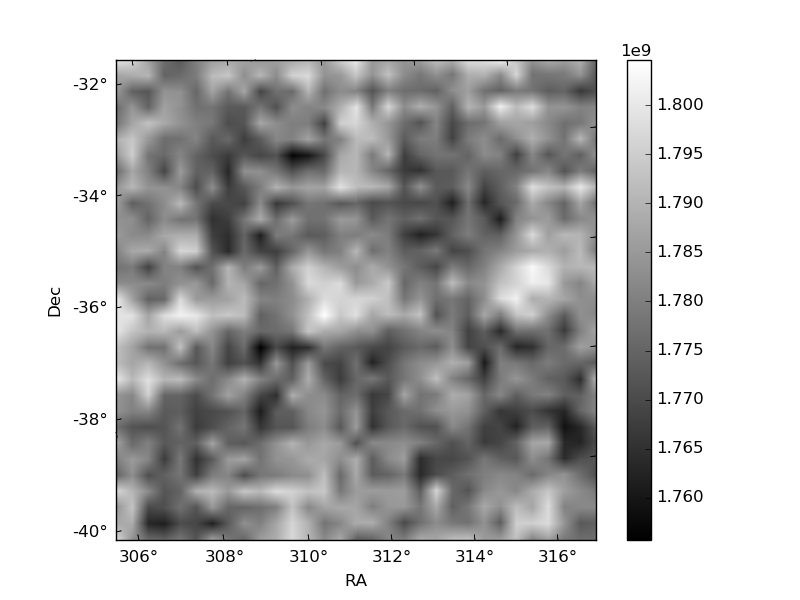
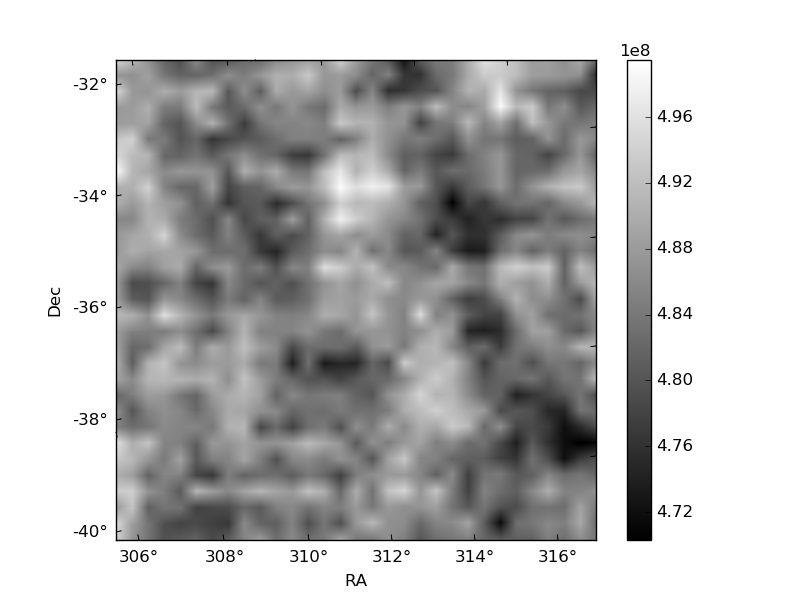
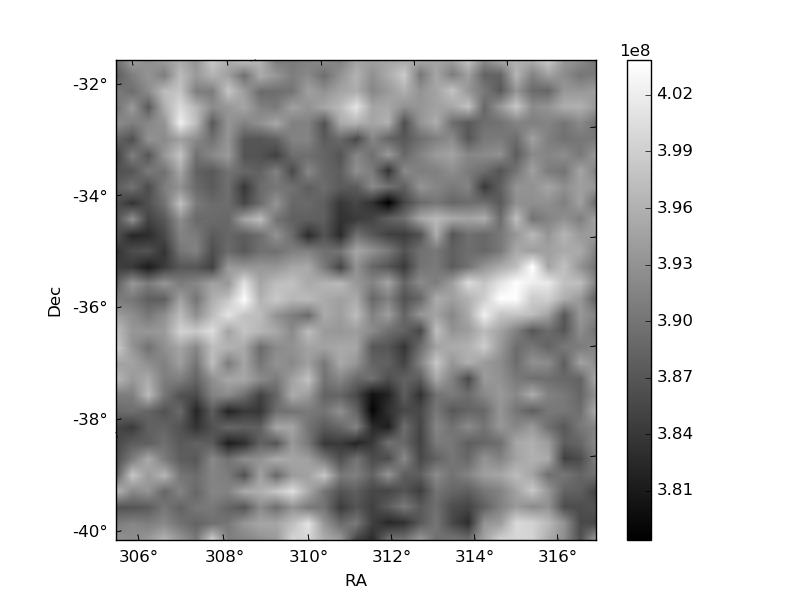
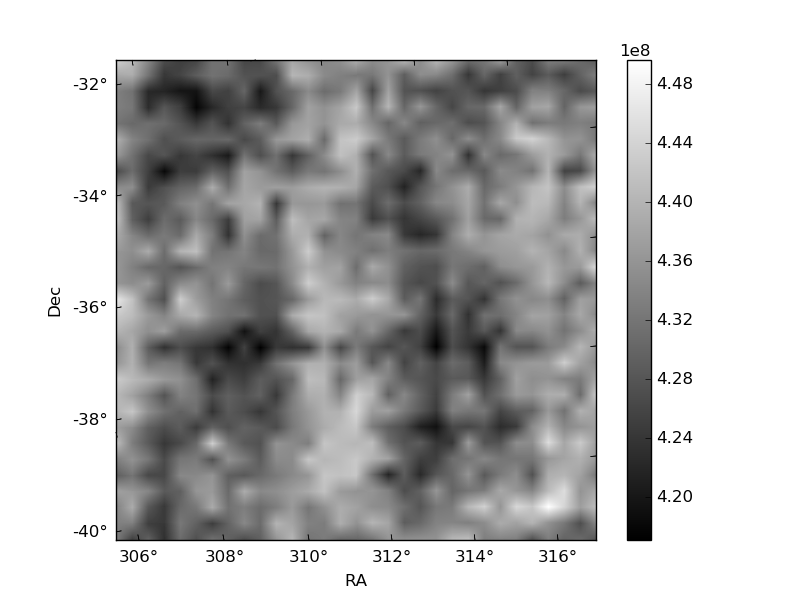
Histogram calculated using DETX and DETY for each event in the final _common_clean file
| Quadrant A |  |
 |
Quadrant B |
|---|---|---|---|
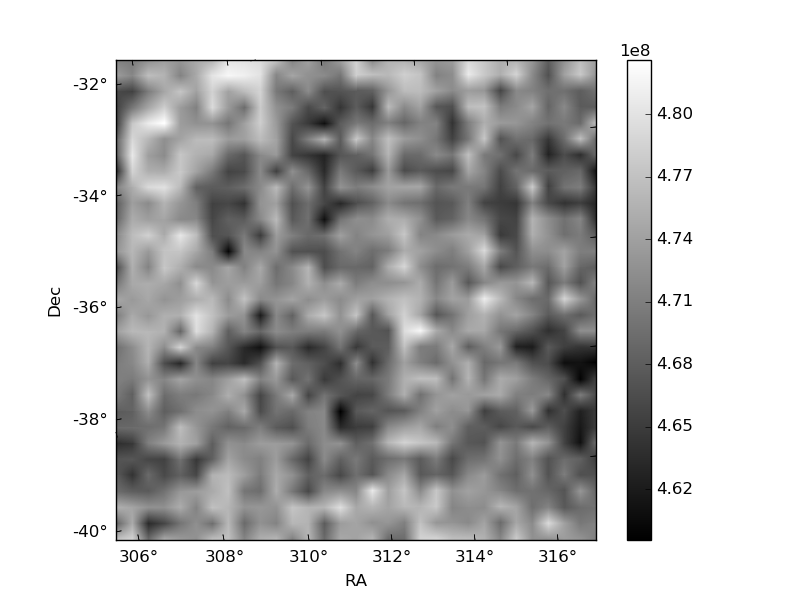
| Quadrant D | 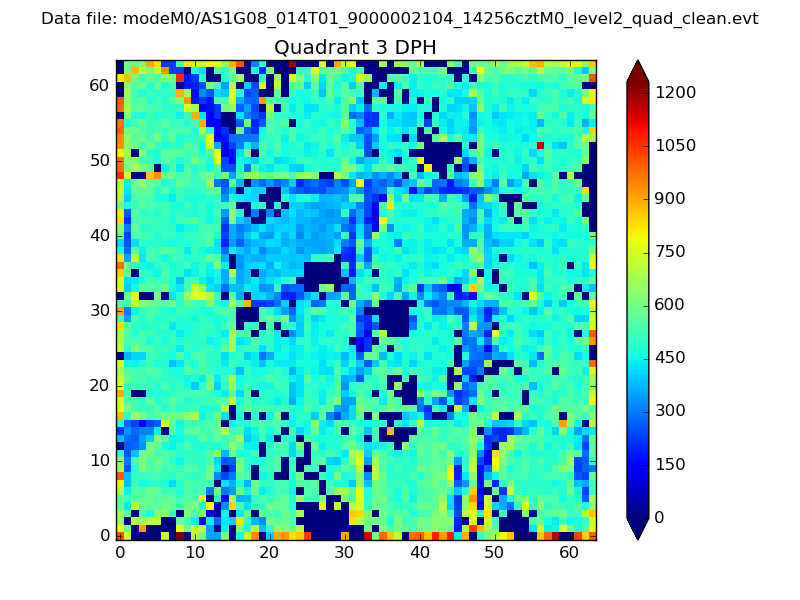 |
 |
Quadrant C |
| Plot type | Count rate plots | Images |
|---|---|---|
| Comparison with Poisson distribution Blue bars denote a histogram of data divided into 1 sec bins. Red curve is a Poisson curve with rate = median count rate of data. |
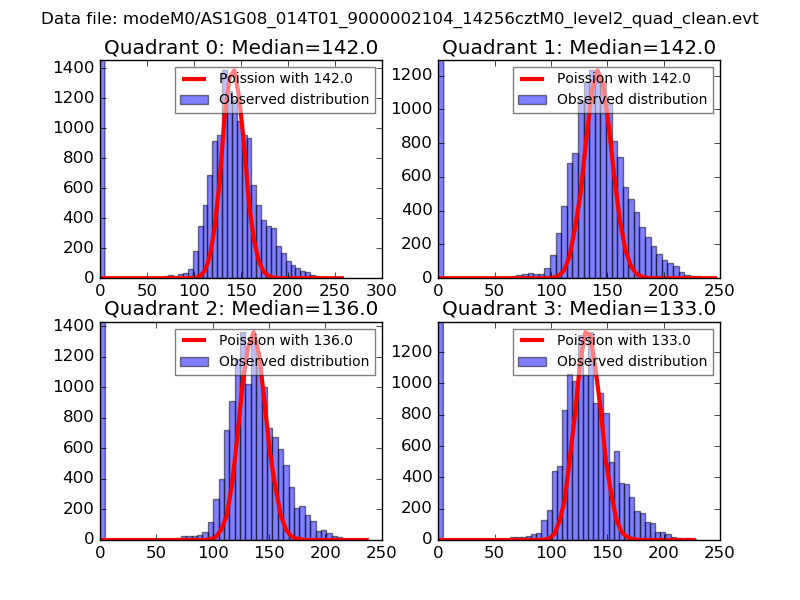 |
 |
| Quadrant-wise count rates Data is divided into 100 sec bins |
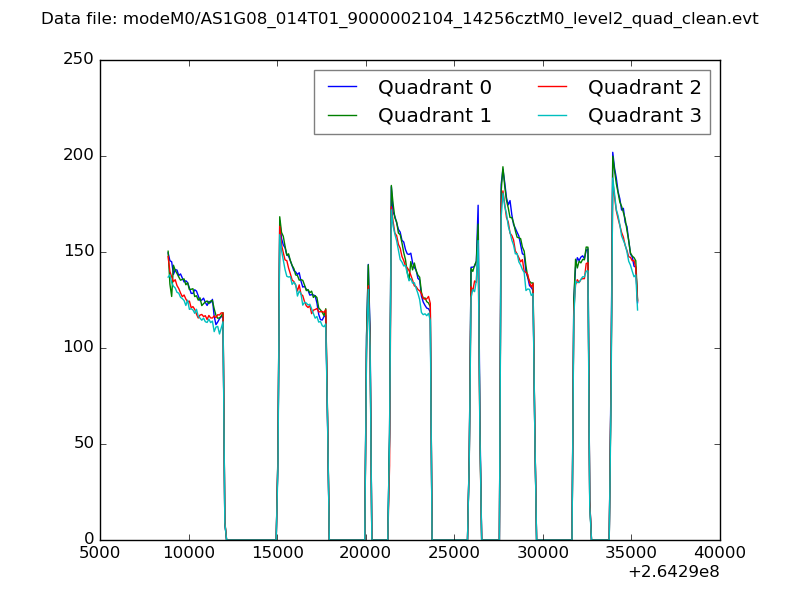 |
|
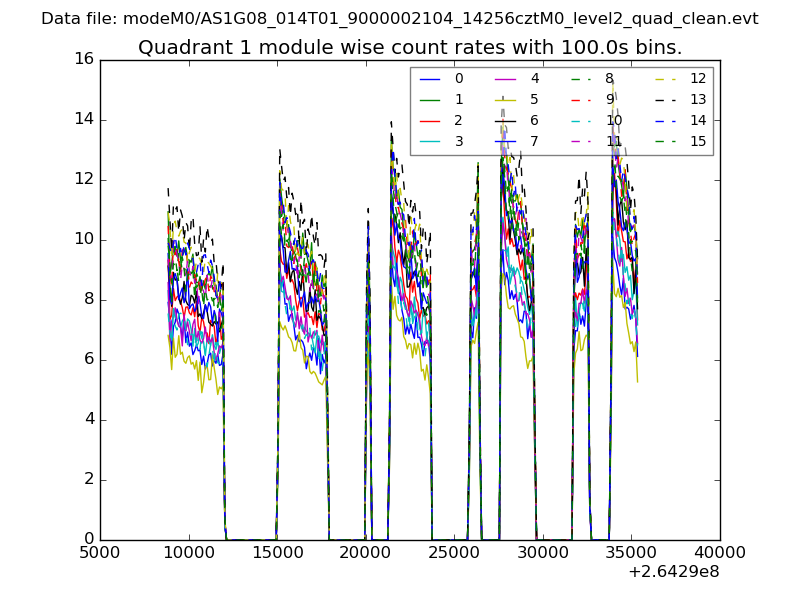
| Module-wise count rates for Quadrant A Data is divided into 100 sec bins |
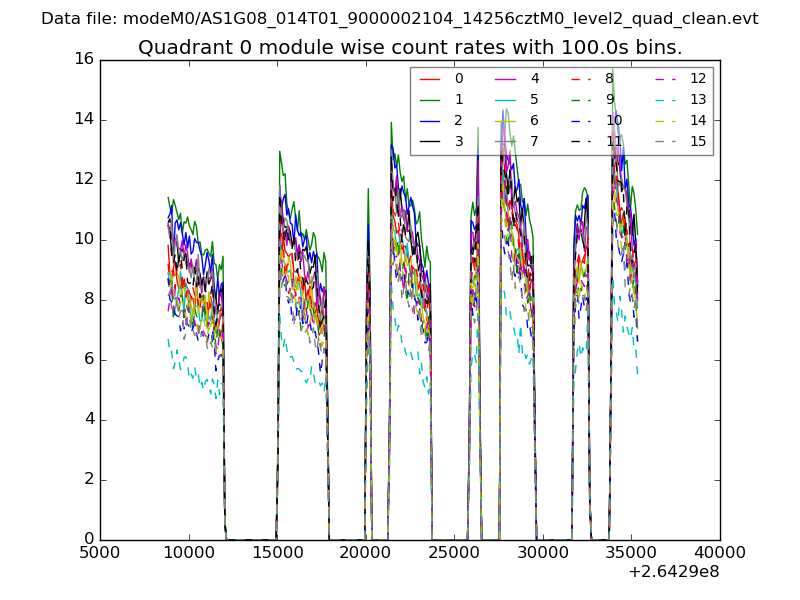 |
 |
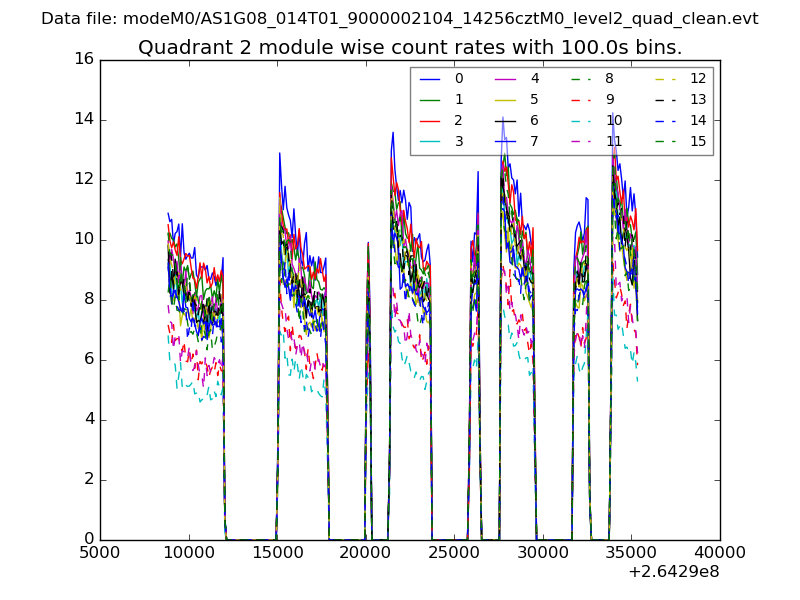
| Module-wise count rates for Quadrant B Data is divided into 100 sec bins |
 |
 |
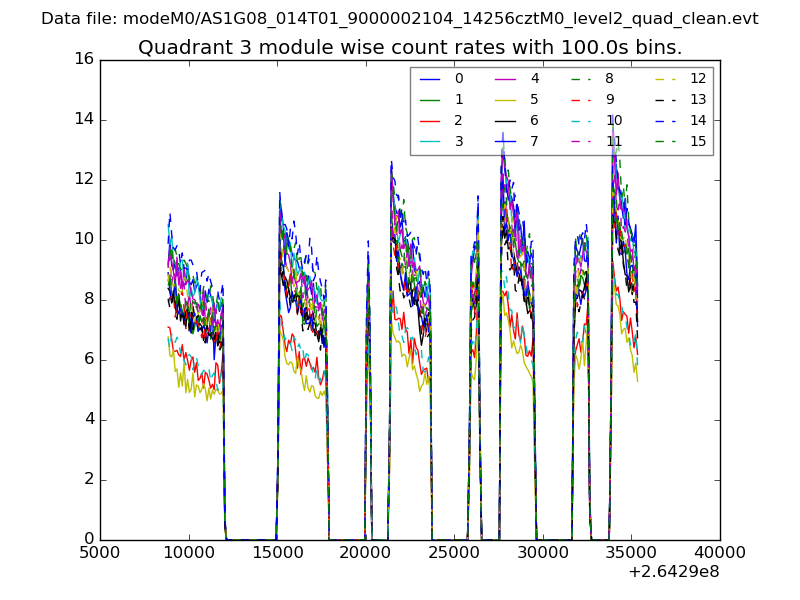
| Module-wise count rates for Quadrant C Data is divided into 100 sec bins |
 |
 |
| Module-wise count rates for Quadrant D Data is divided into 100 sec bins |
 |
 |
| Parameter | Plot |
|---|---|
| CZT HV Monitor | 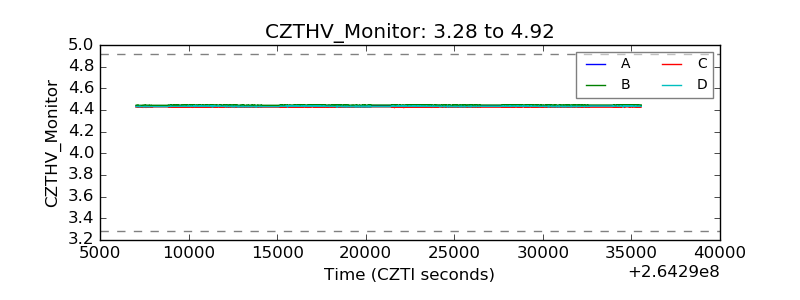 |
| D_VDD | 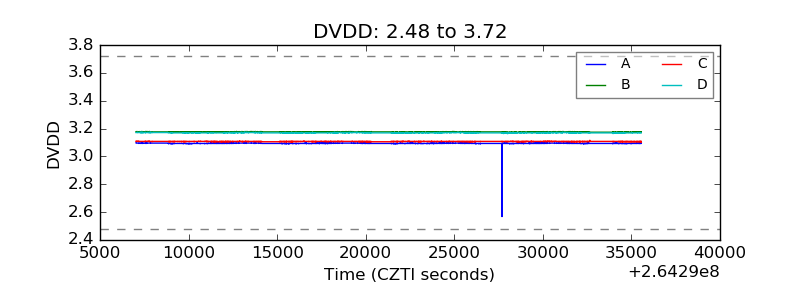 |
| Temperature 1 | 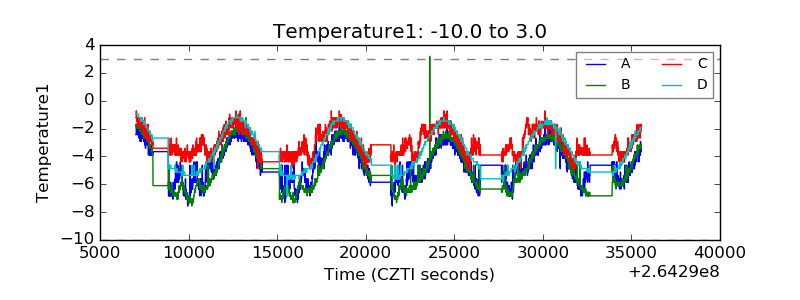 |
| Veto HV Monitor |  |
| Veto LLD | 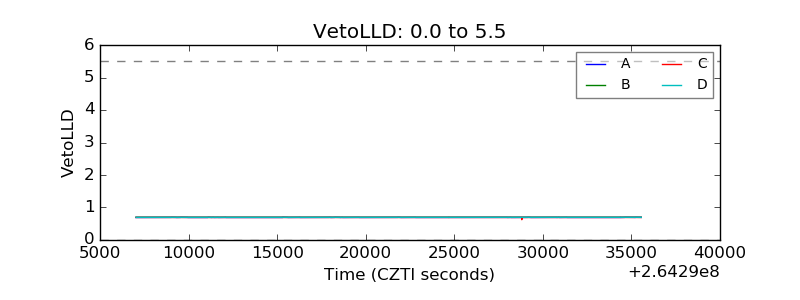 |
| Alpha Counter | 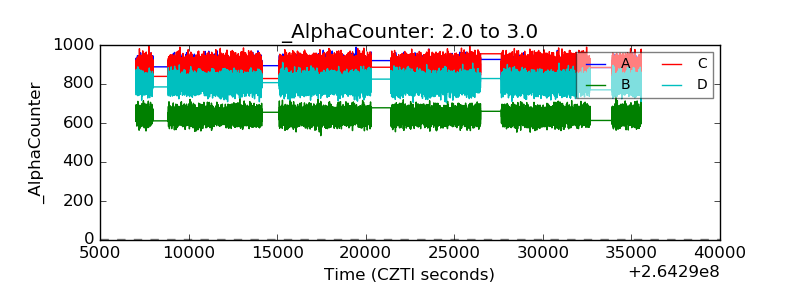 |
| _CPM_Rate | 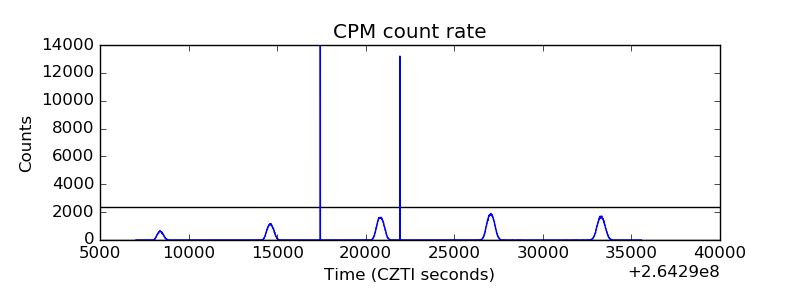 |
| CZT Counter |  |
| +2.5 Volts monitor | 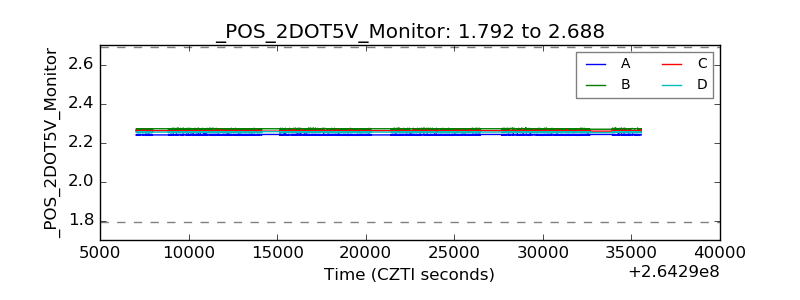 |
| +5 Volts monitor |  |
| _ROLL_ROT | 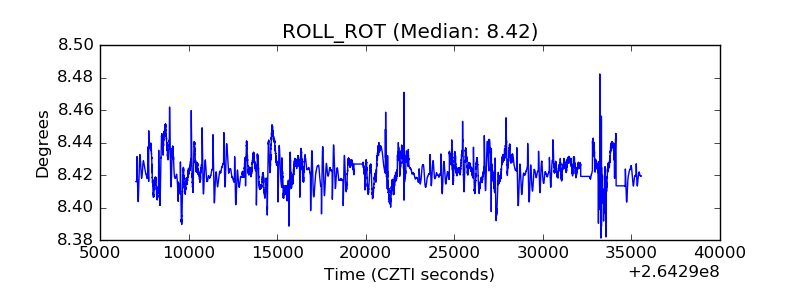 |
| _Roll_DEC | 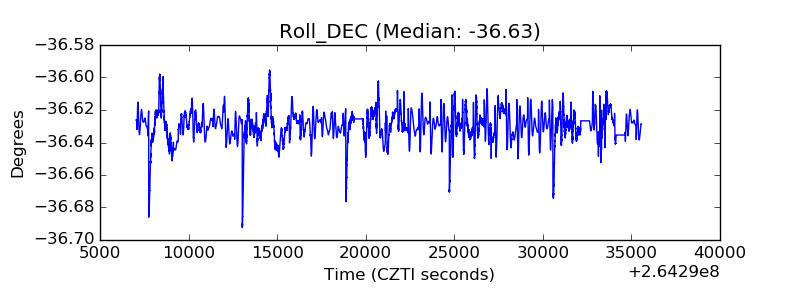 |
| _Roll_RA |  |
| Veto Counter | 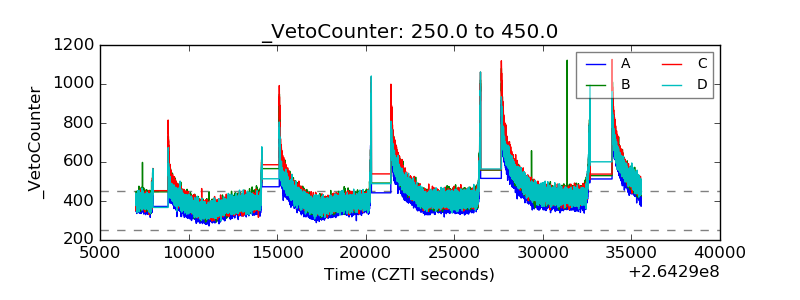 |