| Param | Original file | Final file |
|---|---|---|
| Filename | modeM0/AS1G08_014T01_9000002104_14258cztM0_level2.evt | modeM0/AS1G08_014T01_9000002104_14258cztM0_level2_quad_clean.evt |
| Size (bytes) | 481,898,880 | 75,556,800 |
| Size | 459.6 MB | 72.1 MB |
| Events in quadrant A | 3,247,546 | 473,942 |
| Events in quadrant B | 3,533,387 | 474,979 |
| Events in quadrant C | 3,411,921 | 451,744 |
| Events in quadrant D | 3,971,124 | 444,815 |
| Mode M9 | |||
|---|---|---|---|
| Quadrant | BADHDUFLAG | Total packets | Discarded packets |
| A | 0 | 11 | 0 |
| B | 0 | 11 | 0 |
| C | 0 | 11 | 0 |
| D | 0 | 11 | 0 |
| Mode SS | |||
|---|---|---|---|
| Quadrant | BADHDUFLAG | Total packets | Discarded packets |
| A | 0 | 130 | 0 |
| B | 0 | 130 | 0 |
| C | 0 | 130 | 0 |
| D | 0 | 130 | 0 |
| Mode M0 | |||
|---|---|---|---|
| Quadrant | BADHDUFLAG | Total packets | Discarded packets |
| A | 0 | 13302 | 2 |
| B | 0 | 14292 | 1 |
| C | 0 | 13531 | 1 |
| D | 0 | 15737 | 1 |
| Quadrant | Total seconds | Saturated seconds | Saturation percentage |
|---|---|---|---|
| A | 6335 | 132 | 2.083662% |
| B | 6335 | 163 | 2.573007% |
| C | 6335 | 81 | 1.278611% |
| D | 6335 | 134 | 2.115233% |
Noise dominated data is calculated using 1-second bins in cleaned event files. If a bin has >2000 counts, and if more than 50% of those come from <1% of pixels, then it is considered to be noise-dominated and hence unusable.
| Quadrant | # 1 sec bins | Bins with >0 counts | Bins with >2000 counts | High rate bins dominated by noise | Noise dominated (total time) | Noise dominated (detector-on time) | Marked lightcurve |
|---|---|---|---|---|---|---|---|
| A | 7501 | 6337 | 2 | 2 | 0.03% | 0.03% | 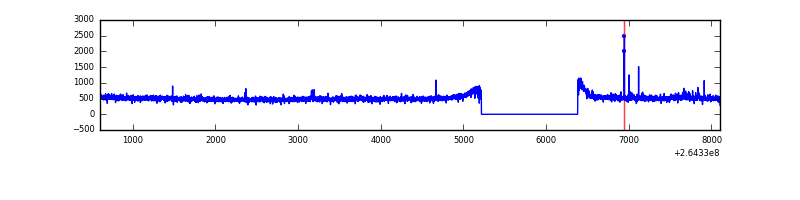 |
| B | 7501 | 6337 | 23 | 23 | 0.31% | 0.36% | 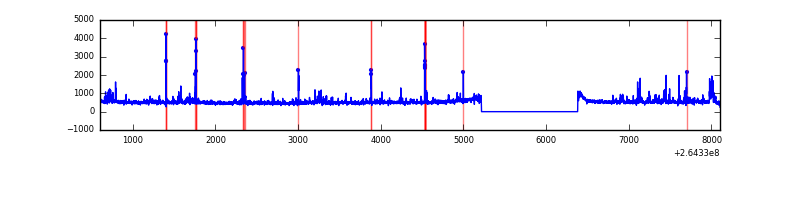 |
| C | 7501 | 6337 | 0 | 0 | 0.00% | 0.00% | 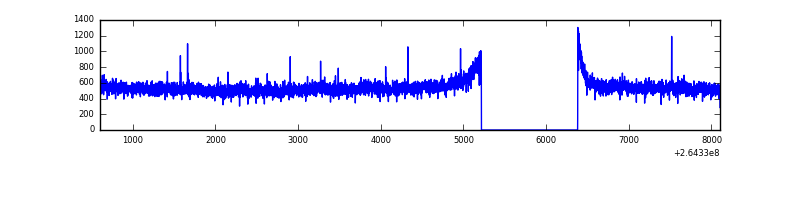 |
| D | 7501 | 6336 | 24 | 24 | 0.32% | 0.38% | 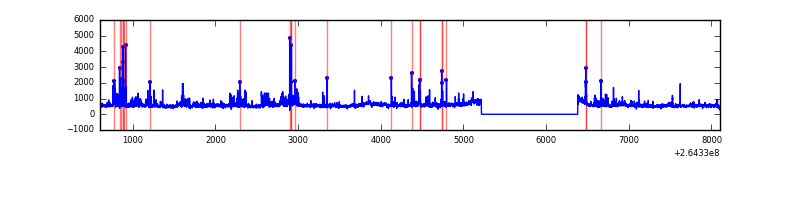 |
Top three noisy pixels from each quadrant. If the there are fewer than three noisy pixels in the level2.evt file, extra rows are filled as -1
| Pixel properties | Quadrant properties | ||||||
|---|---|---|---|---|---|---|---|
| Quadrant | DetID | PixID | Counts | Sigma | Mean | Median | Sigma |
| A | 8 | 15 | 34555 | 203.18 | 825 | 809 | 166.1 |
| A | 12 | 189 | 21498 | 124.57 | 825 | 809 | 166.1 |
| A | 9 | 143 | 12096 | 67.96 | 825 | 809 | 166.1 |
| B | 0 | 229 | 178886 | 1150.73 | 809 | 791 | 154.8 |
| B | 10 | 245 | 45545 | 289.17 | 809 | 791 | 154.8 |
| B | 10 | 244 | 42836 | 271.67 | 809 | 791 | 154.8 |
| C | 3 | 233 | 346631 | 1913.54 | 785 | 789 | 180.7 |
| C | 13 | 61 | 5661 | 26.96 | 785 | 789 | 180.7 |
| C | 10 | 22 | 5526 | 26.21 | 785 | 789 | 180.7 |
| D | 8 | 195 | 332644 | 1775.1 | 794 | 775 | 187.0 |
| D | 10 | 199 | 208666 | 1111.97 | 794 | 775 | 187.0 |
| D | 5 | 222 | 197640 | 1052.99 | 794 | 775 | 187.0 |
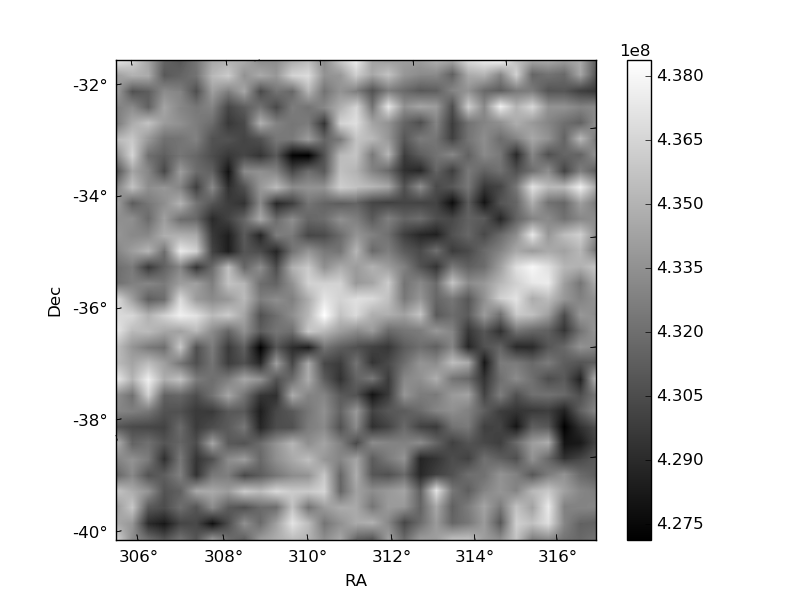
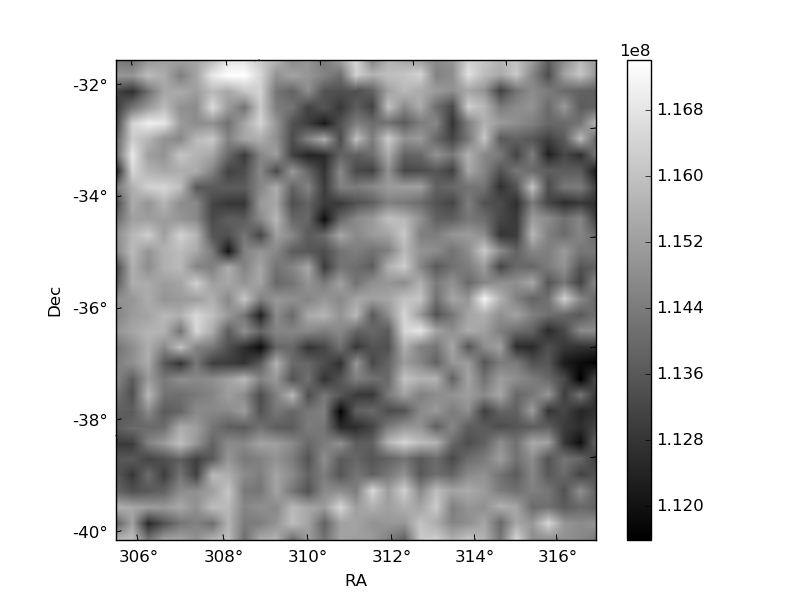
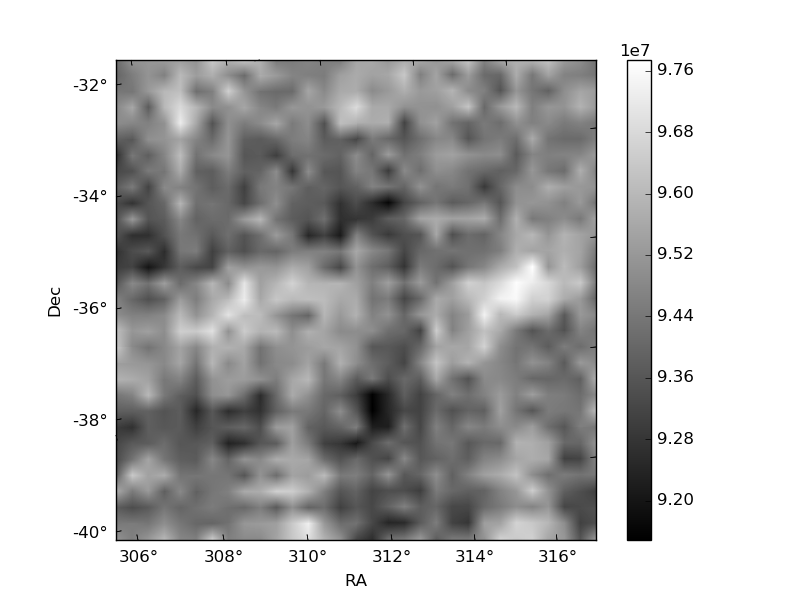
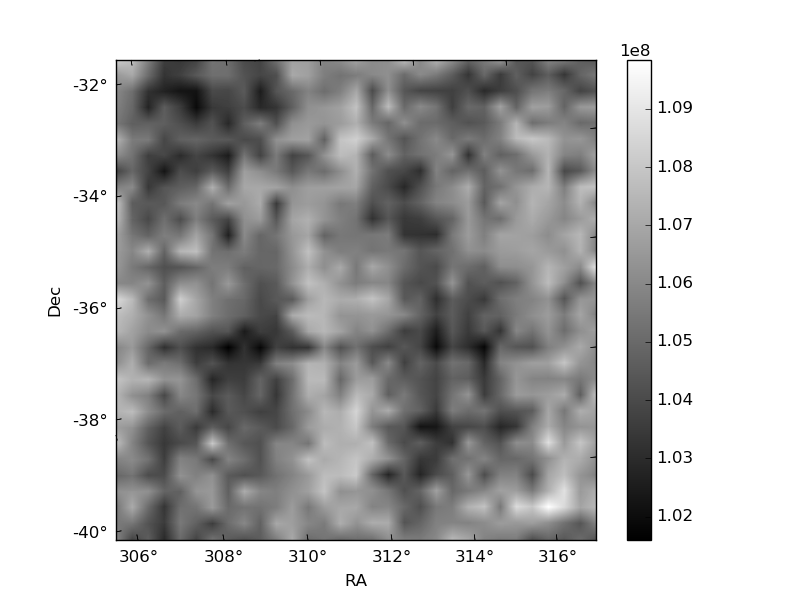
Histogram calculated using DETX and DETY for each event in the final _common_clean file
| Quadrant A | 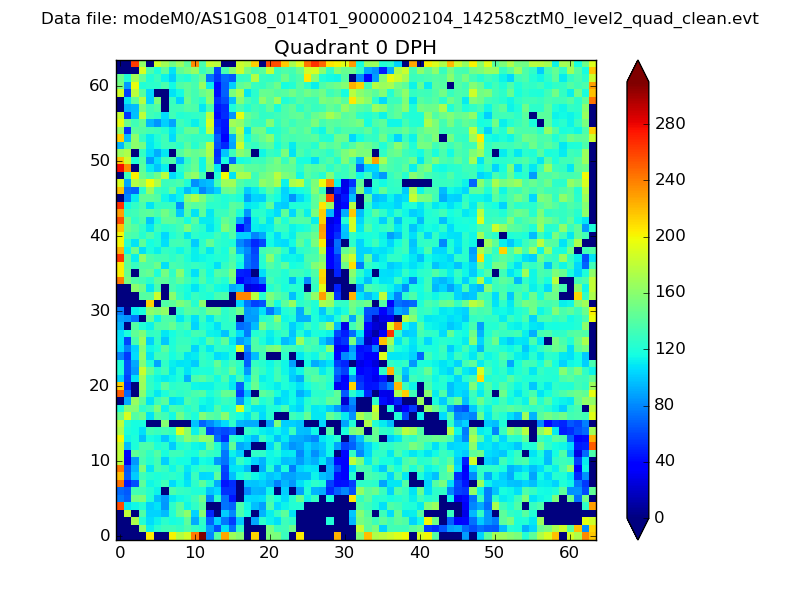 |
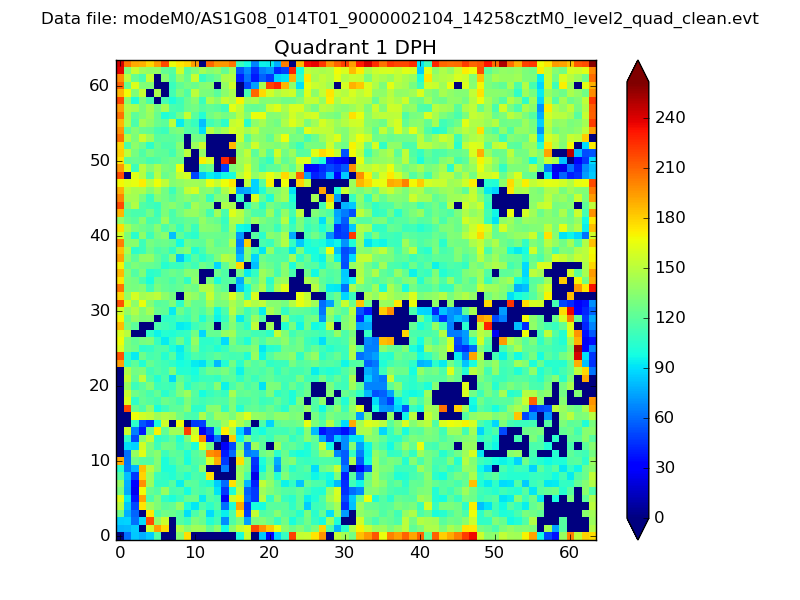 |
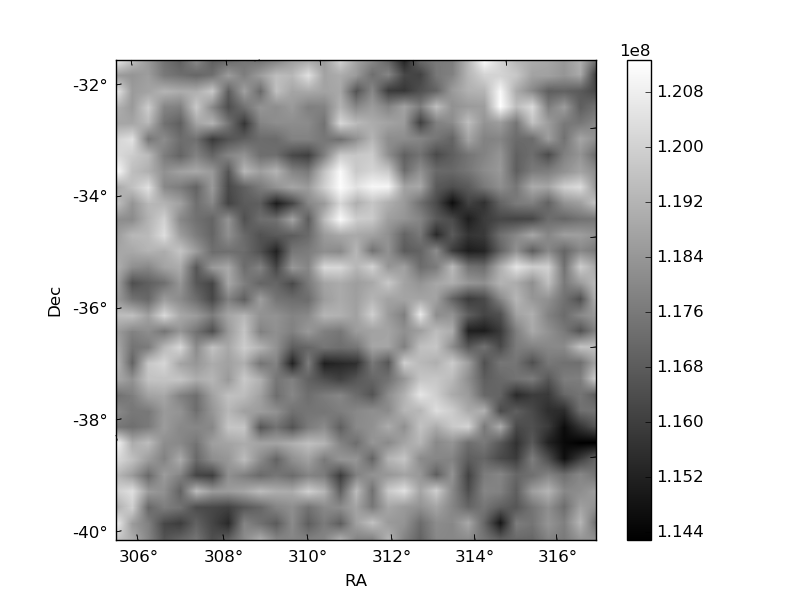
Quadrant B |
|---|---|---|---|
| Quadrant D | 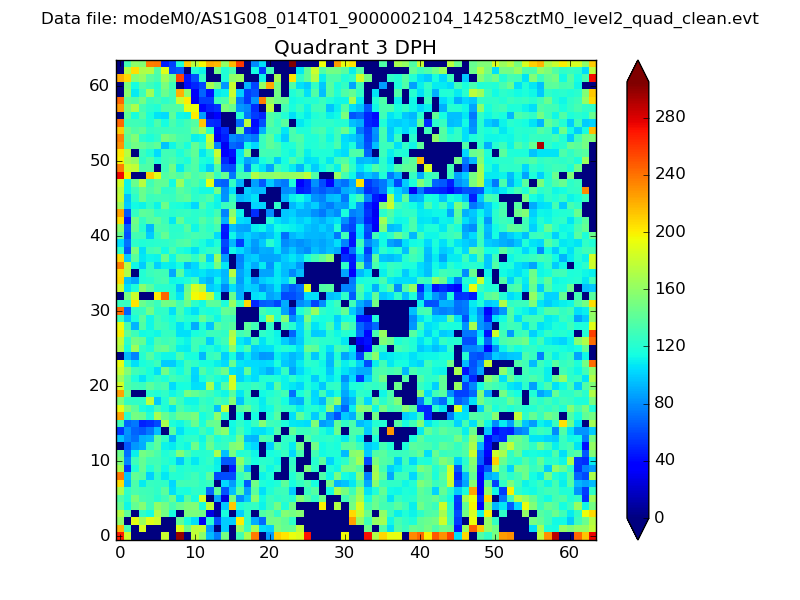 |
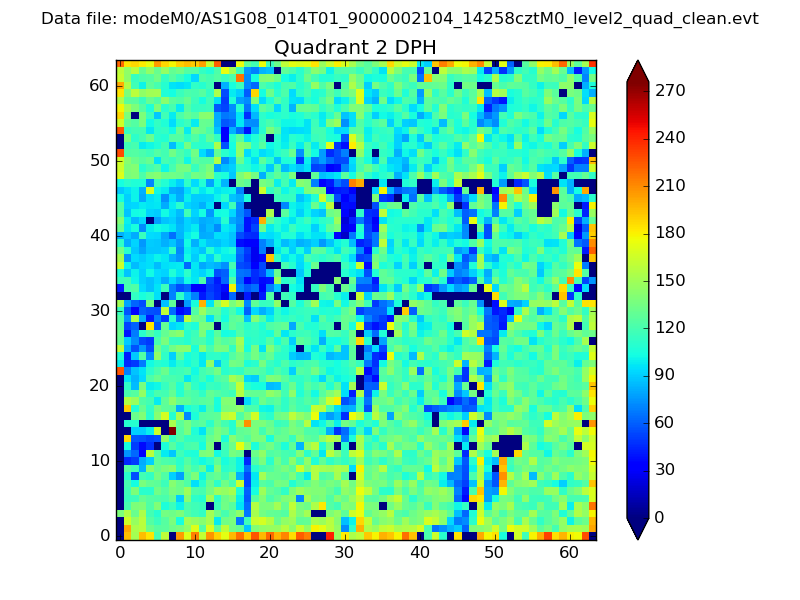 |
Quadrant C |
| Plot type | Count rate plots | Images |
|---|---|---|
| Comparison with Poisson distribution Blue bars denote a histogram of data divided into 1 sec bins. Red curve is a Poisson curve with rate = median count rate of data. |
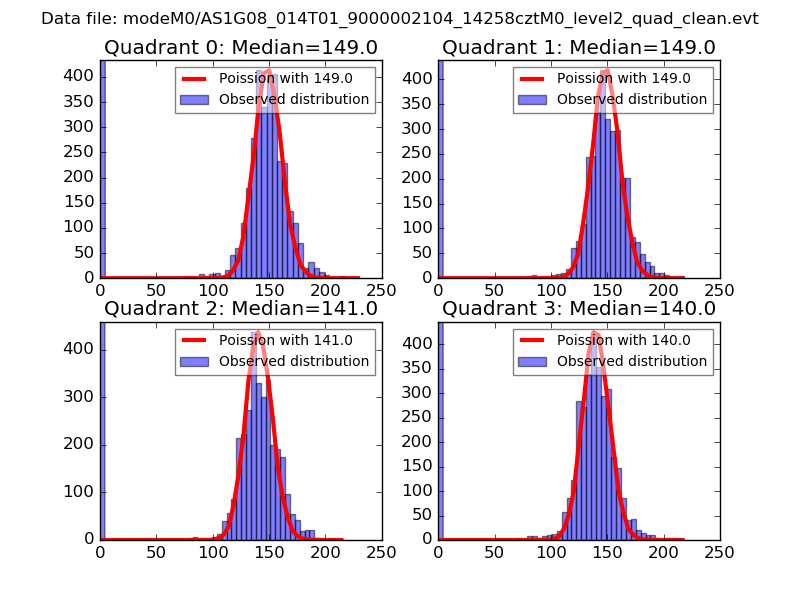 |
 |
| Quadrant-wise count rates Data is divided into 100 sec bins |
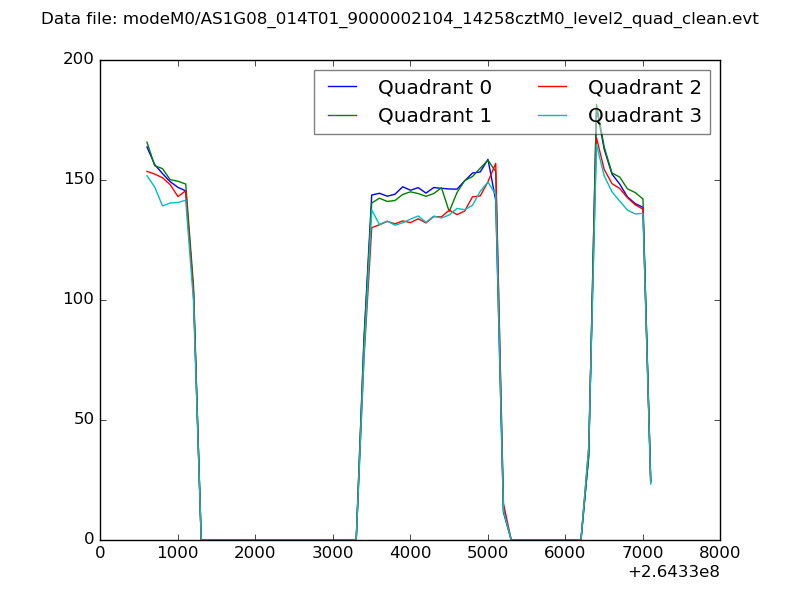 |
|
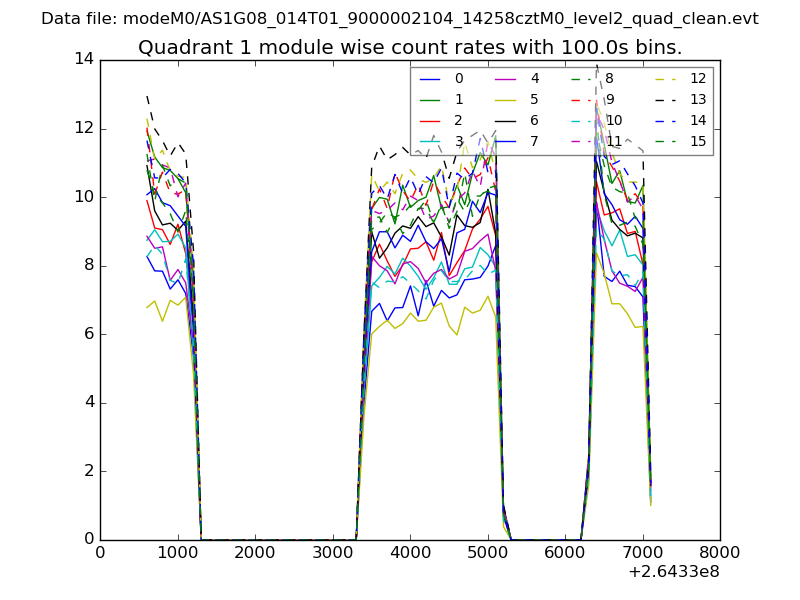
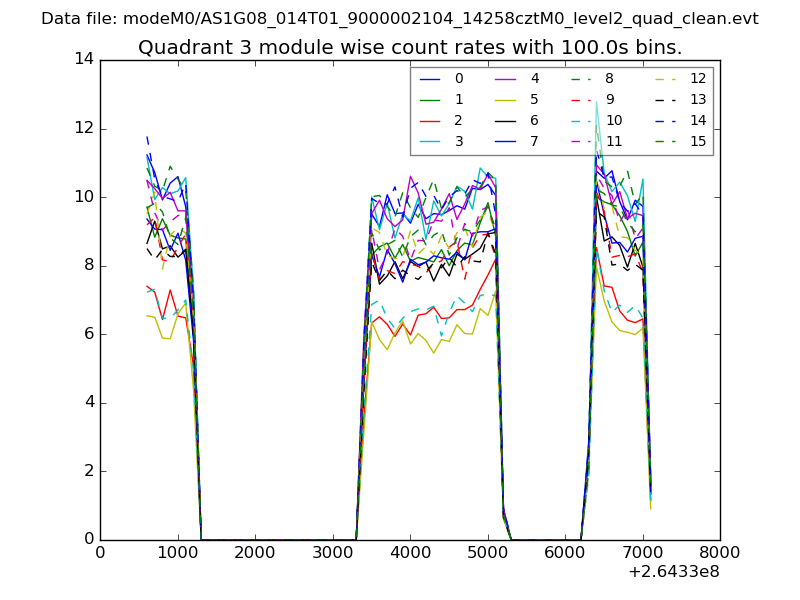
| Module-wise count rates for Quadrant A Data is divided into 100 sec bins |
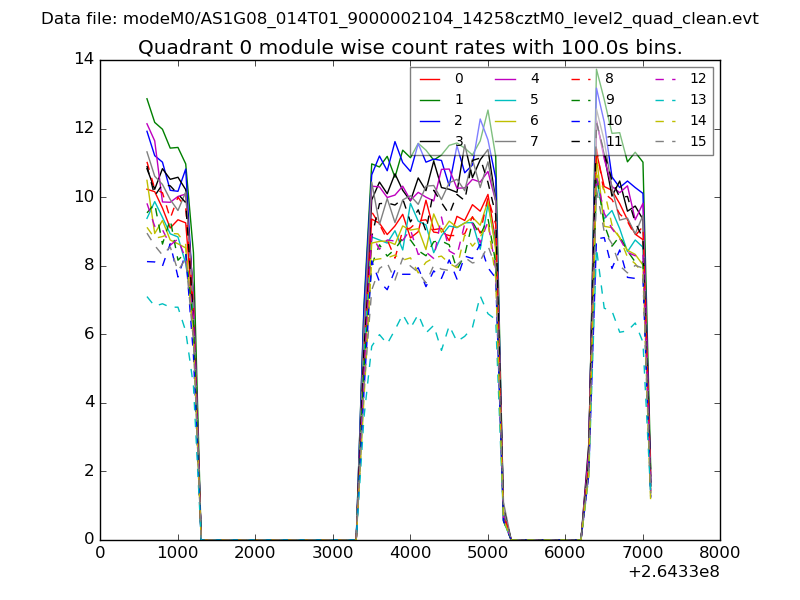 |
 |
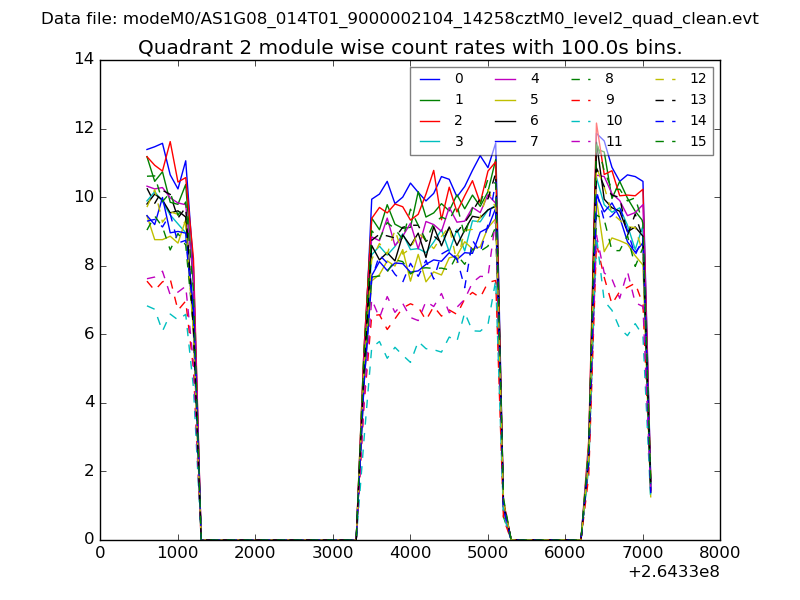
| Module-wise count rates for Quadrant B Data is divided into 100 sec bins |
 |
 |
| Module-wise count rates for Quadrant C Data is divided into 100 sec bins |
 |
 |
| Module-wise count rates for Quadrant D Data is divided into 100 sec bins |
 |
 |
| Parameter | Plot |
|---|---|
| CZT HV Monitor | 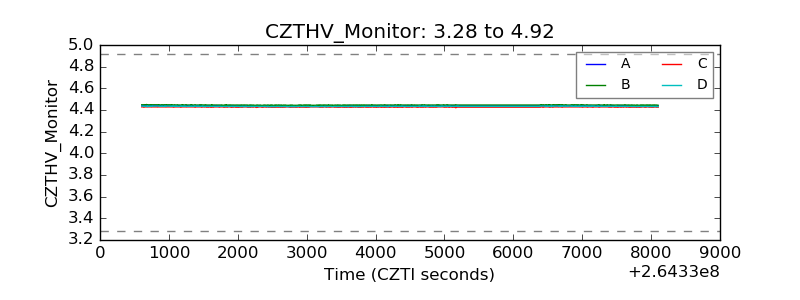 |
| D_VDD | 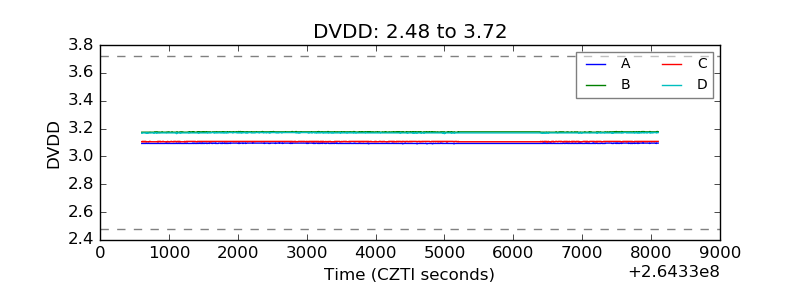 |
| Temperature 1 | 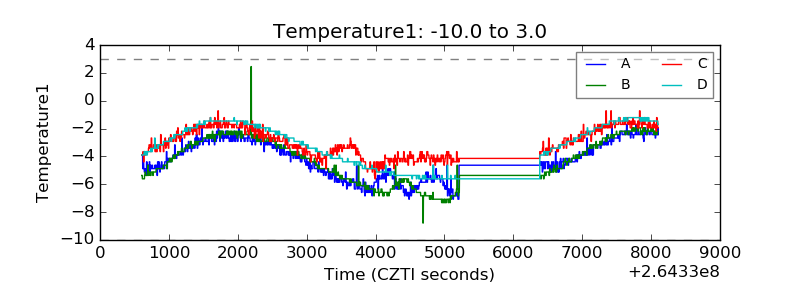 |
| Veto HV Monitor | 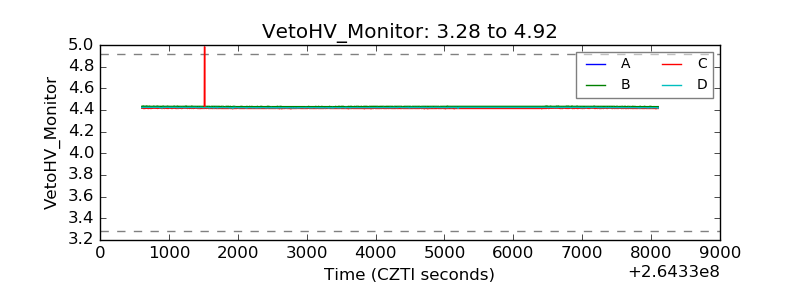 |
| Veto LLD | 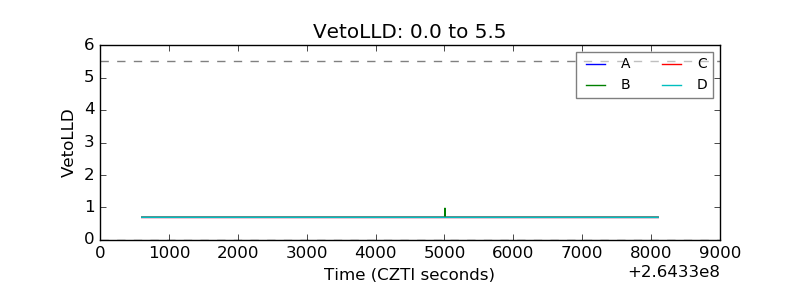 |
| Alpha Counter | 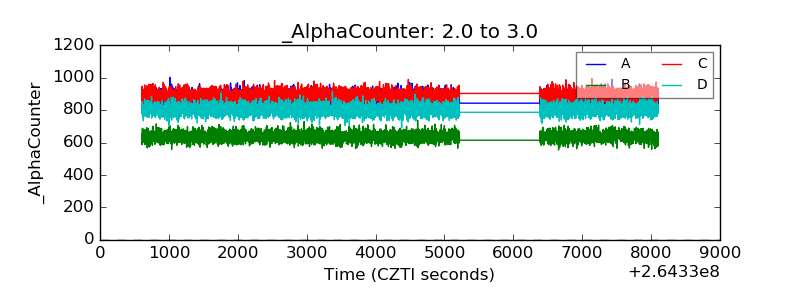 |
| _CPM_Rate | 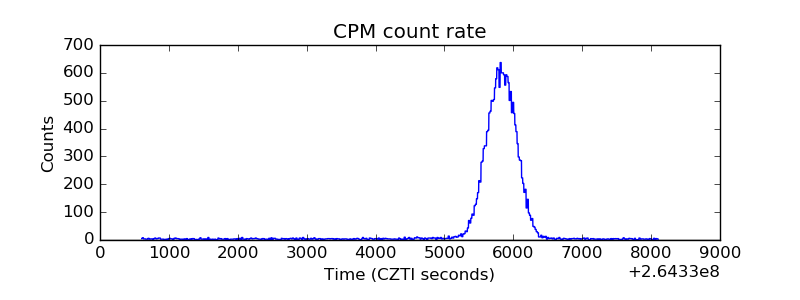 |
| CZT Counter | 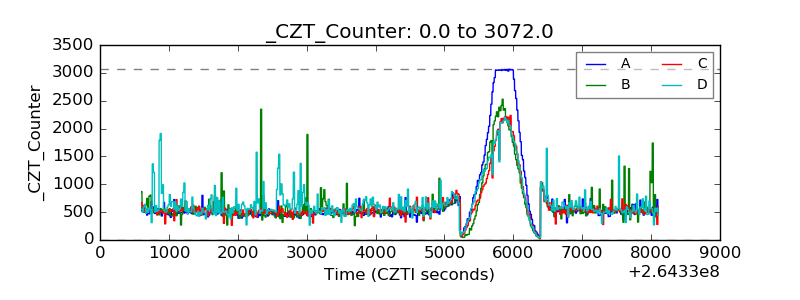 |
| +2.5 Volts monitor |  |
| +5 Volts monitor |  |
| _ROLL_ROT | 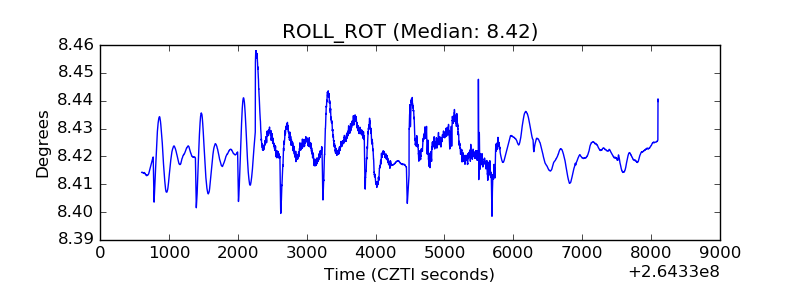 |
| _Roll_DEC | 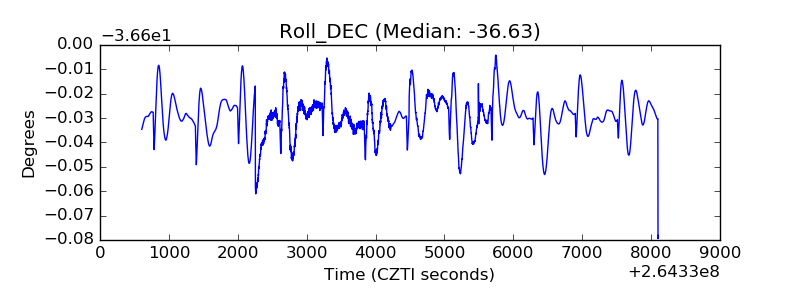 |
| _Roll_RA | 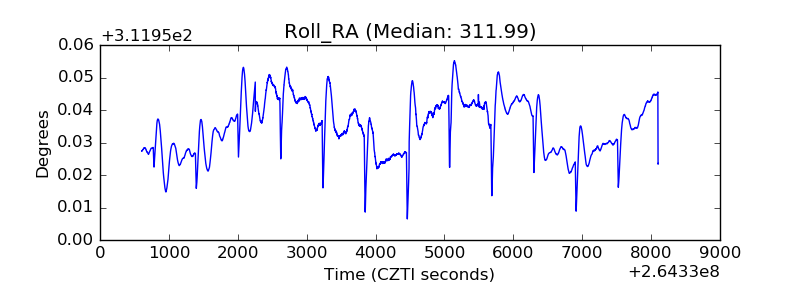 |
| Veto Counter | 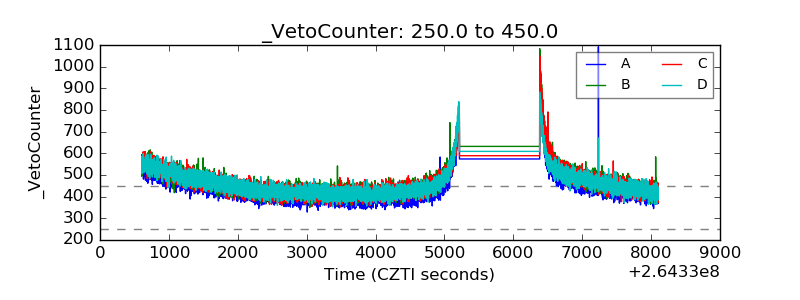 |