| Param | Original file | Final file |
|---|---|---|
| Filename | modeM0/AS1G08_014T01_9000002104_14259cztM0_level2.evt | modeM0/AS1G08_014T01_9000002104_14259cztM0_level2_quad_clean.evt |
| Size (bytes) | 570,430,080 | 79,349,760 |
| Size | 544.0 MB | 75.7 MB |
| Events in quadrant A | 4,591,523 | 491,380 |
| Events in quadrant B | 4,393,285 | 492,655 |
| Events in quadrant C | 3,729,901 | 470,350 |
| Events in quadrant D | 4,090,739 | 464,824 |
| Mode M9 | |||
|---|---|---|---|
| Quadrant | BADHDUFLAG | Total packets | Discarded packets |
| A | 0 | 11 | 0 |
| B | 0 | 11 | 0 |
| C | 0 | 11 | 0 |
| D | 0 | 12 | 0 |
| Mode SS | |||
|---|---|---|---|
| Quadrant | BADHDUFLAG | Total packets | Discarded packets |
| A | 0 | 142 | 0 |
| B | 0 | 142 | 0 |
| C | 0 | 142 | 0 |
| D | 0 | 142 | 0 |
| Mode M0 | |||
|---|---|---|---|
| Quadrant | BADHDUFLAG | Total packets | Discarded packets |
| A | 0 | 18413 | 3 |
| B | 0 | 17290 | 2 |
| C | 0 | 14767 | 2 |
| D | 0 | 16341 | 2 |
| Quadrant | Total seconds | Saturated seconds | Saturation percentage |
|---|---|---|---|
| A | 6931 | 247 | 3.563699% |
| B | 6931 | 378 | 5.453758% |
| C | 6931 | 126 | 1.817919% |
| D | 6931 | 190 | 2.741307% |
Noise dominated data is calculated using 1-second bins in cleaned event files. If a bin has >2000 counts, and if more than 50% of those come from <1% of pixels, then it is considered to be noise-dominated and hence unusable.
| Quadrant | # 1 sec bins | Bins with >0 counts | Bins with >2000 counts | High rate bins dominated by noise | Noise dominated (total time) | Noise dominated (detector-on time) | Marked lightcurve |
|---|---|---|---|---|---|---|---|
| A | 7872 | 6932 | 39 | 39 | 0.50% | 0.56% | 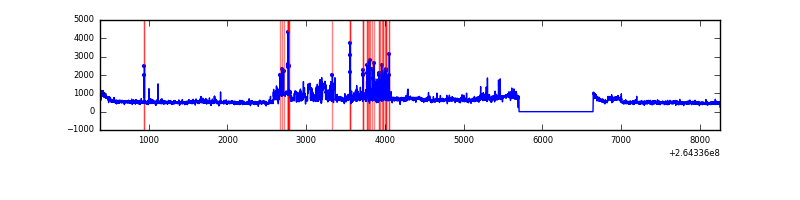 |
| B | 7872 | 6932 | 122 | 122 | 1.55% | 1.76% | 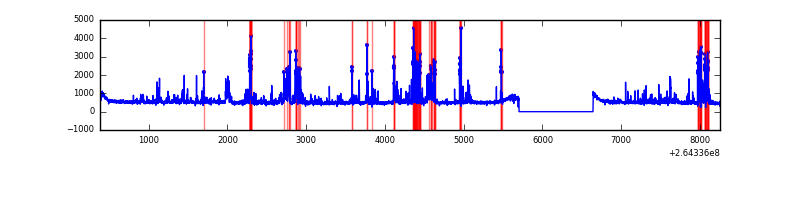 |
| C | 7872 | 6932 | 0 | 0 | 0.00% | 0.00% | 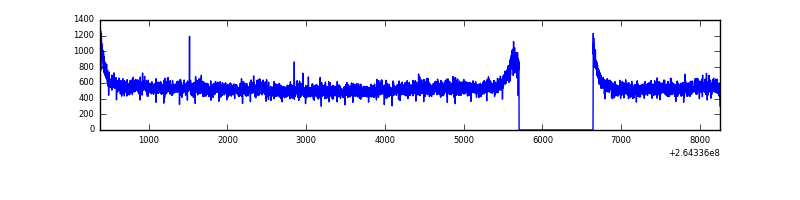 |
| D | 7872 | 6932 | 21 | 21 | 0.27% | 0.30% | 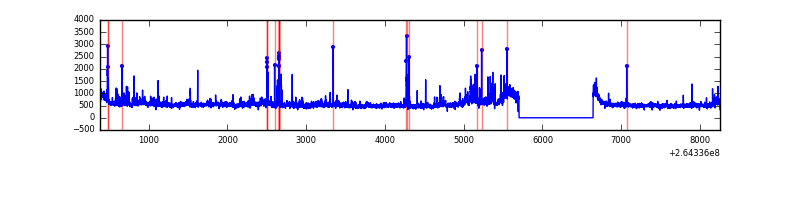 |
Top three noisy pixels from each quadrant. If the there are fewer than three noisy pixels in the level2.evt file, extra rows are filled as -1
| Pixel properties | Quadrant properties | ||||||
|---|---|---|---|---|---|---|---|
| Quadrant | DetID | PixID | Counts | Sigma | Mean | Median | Sigma |
| A | 0 | 23 | 966071 | 5423.11 | 885 | 869 | 178.0 |
| A | 8 | 15 | 78520 | 436.29 | 885 | 869 | 178.0 |
| A | 0 | 226 | 69583 | 386.08 | 885 | 869 | 178.0 |
| B | 10 | 245 | 691432 | 4141.95 | 870 | 848 | 166.7 |
| B | 0 | 229 | 174041 | 1038.77 | 870 | 848 | 166.7 |
| B | 3 | 209 | 26736 | 155.27 | 870 | 848 | 166.7 |
| C | 3 | 233 | 407820 | 2056.7 | 852 | 856 | 197.9 |
| C | 13 | 61 | 5968 | 25.83 | 852 | 856 | 197.9 |
| C | 10 | 22 | 2885 | 10.25 | 852 | 856 | 197.9 |
| D | 8 | 195 | 385788 | 1893.53 | 857 | 836 | 203.3 |
| D | 10 | 199 | 272565 | 1336.6 | 857 | 836 | 203.3 |
| D | 5 | 222 | 96145 | 468.81 | 857 | 836 | 203.3 |
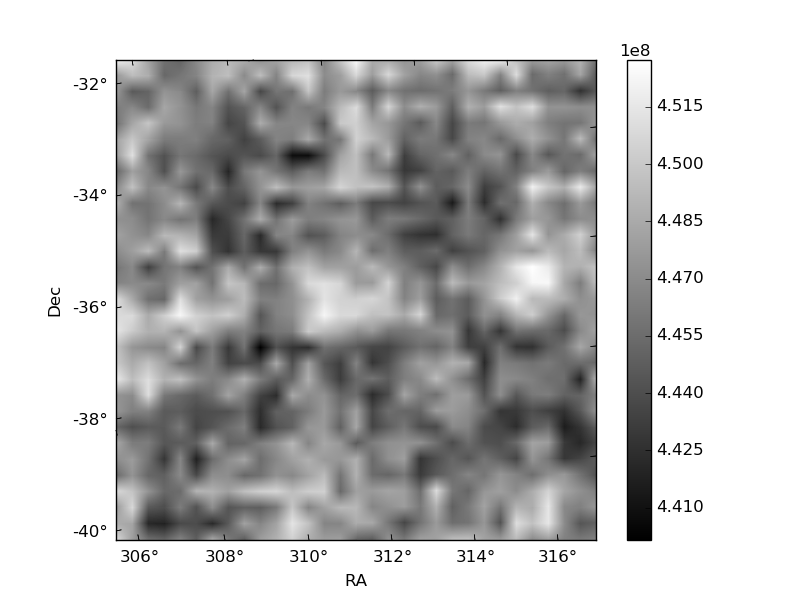
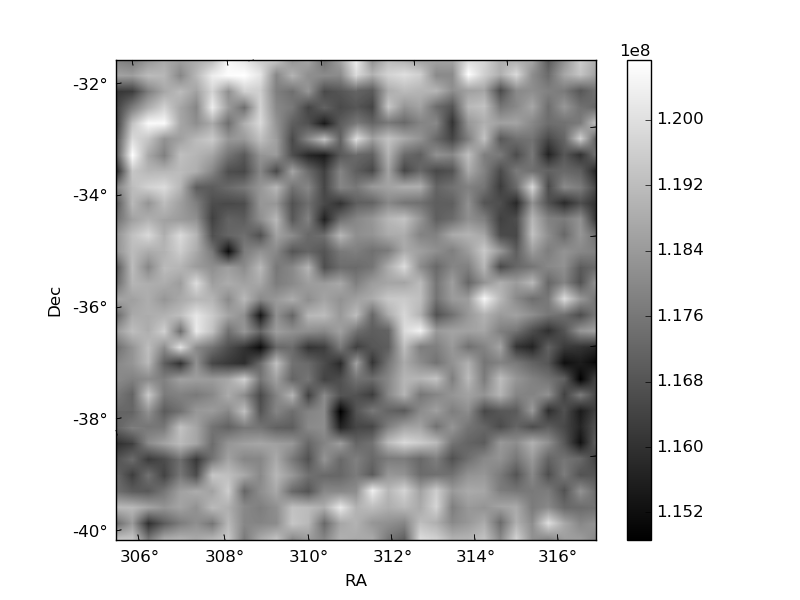
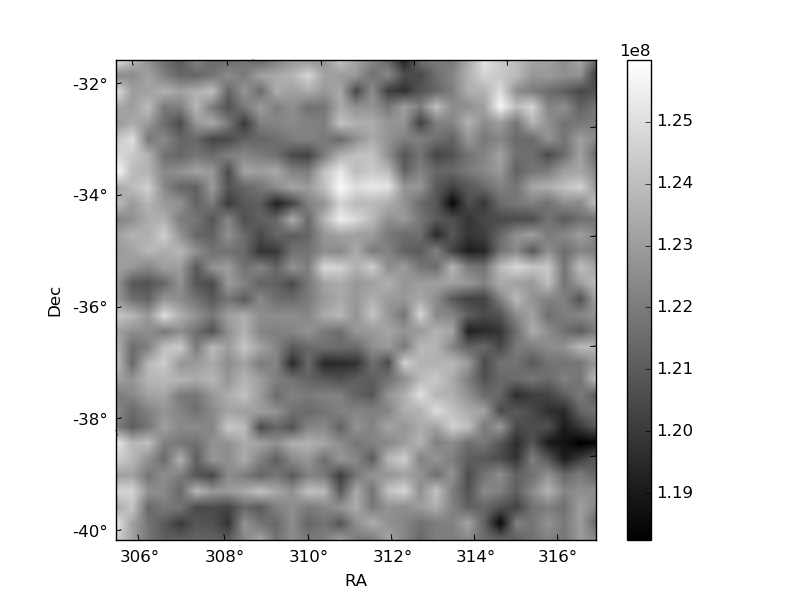
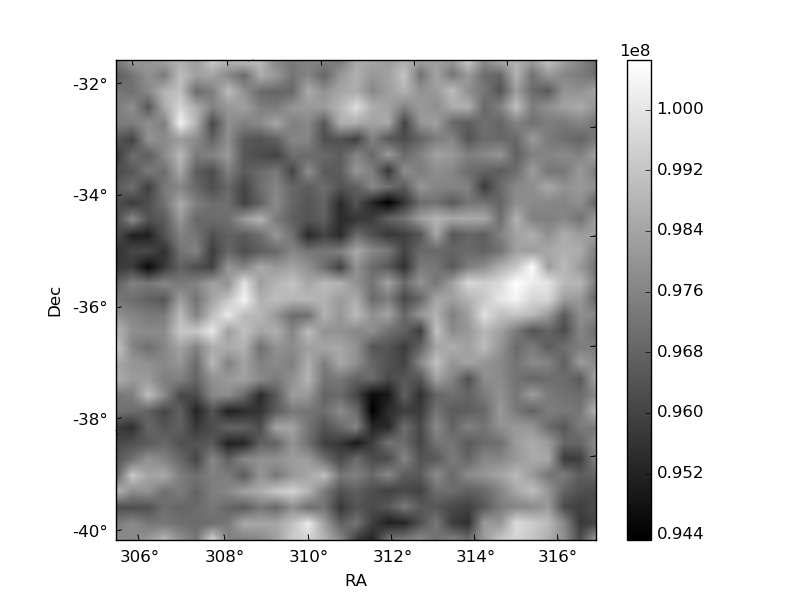
Histogram calculated using DETX and DETY for each event in the final _common_clean file
| Quadrant A | 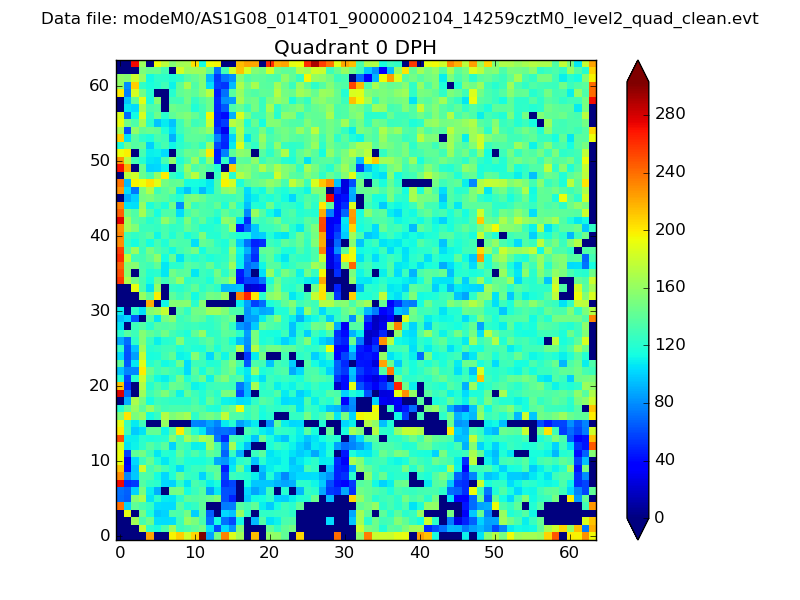 |
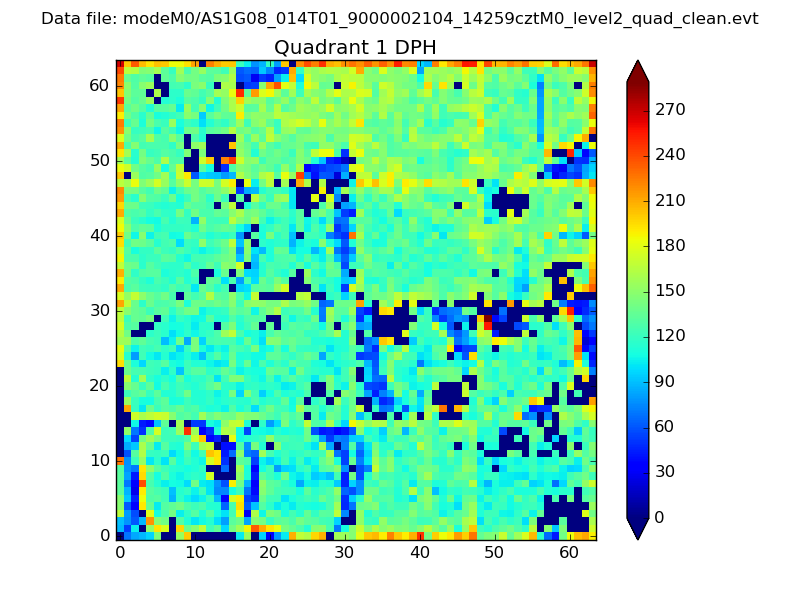 |
Quadrant B |
|---|---|---|---|
| Quadrant D | 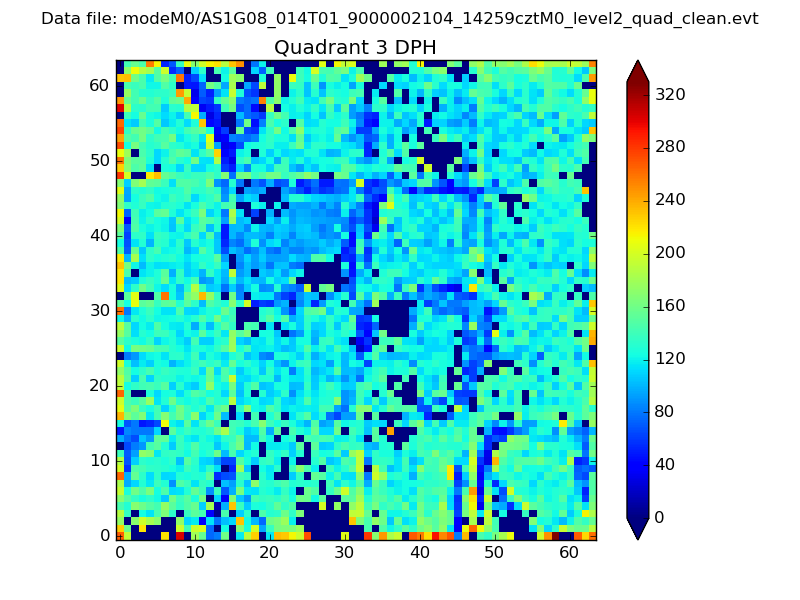 |
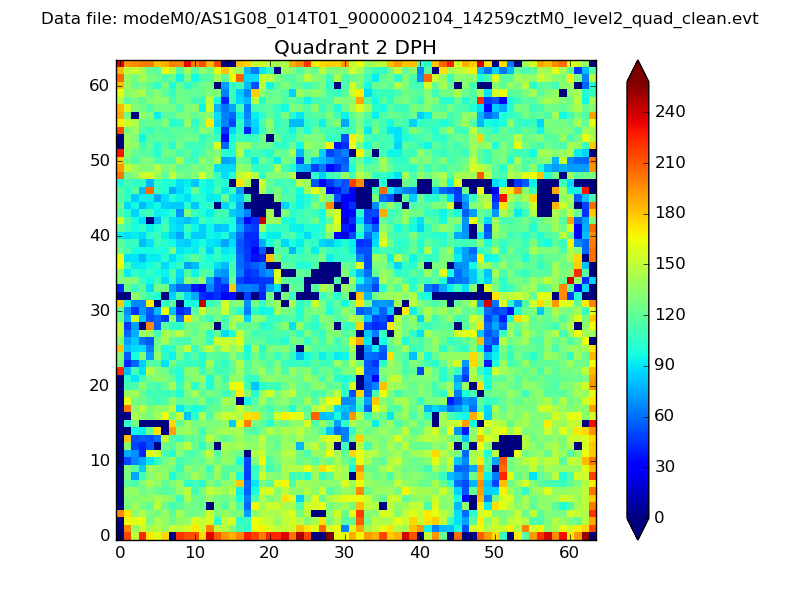 |
Quadrant C |
| Plot type | Count rate plots | Images |
|---|---|---|
| Comparison with Poisson distribution Blue bars denote a histogram of data divided into 1 sec bins. Red curve is a Poisson curve with rate = median count rate of data. |
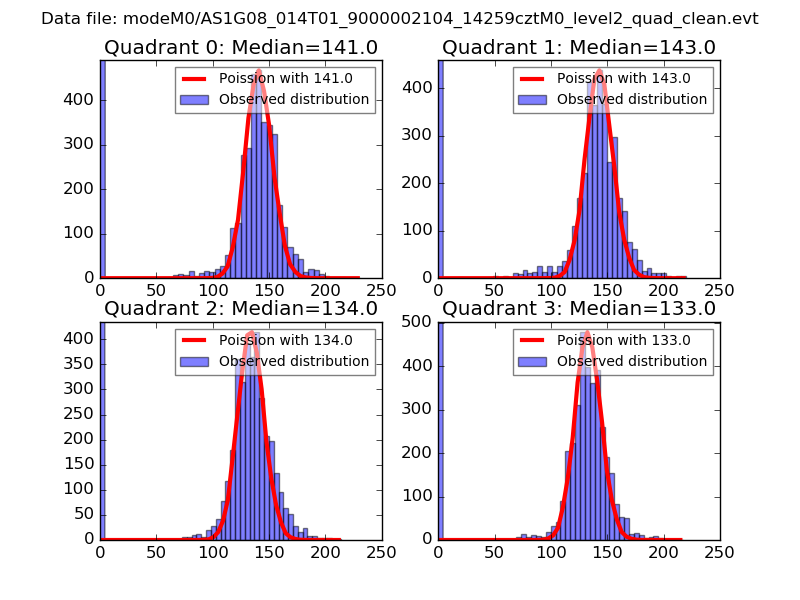 |
 |
| Quadrant-wise count rates Data is divided into 100 sec bins |
 |
|
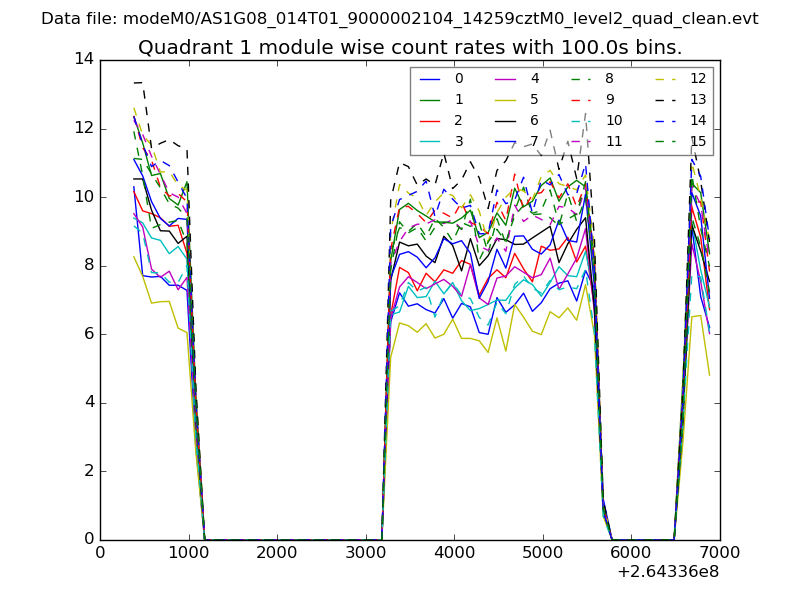
| Module-wise count rates for Quadrant A Data is divided into 100 sec bins |
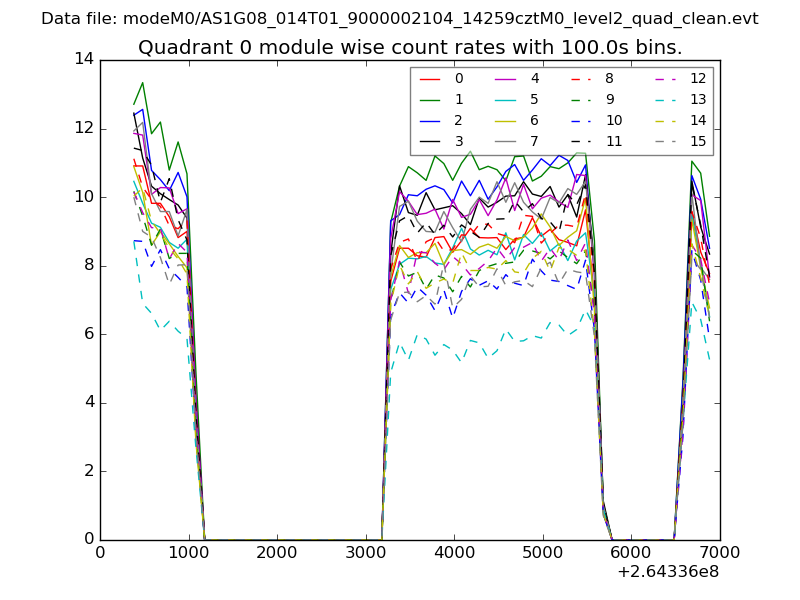 |
 |
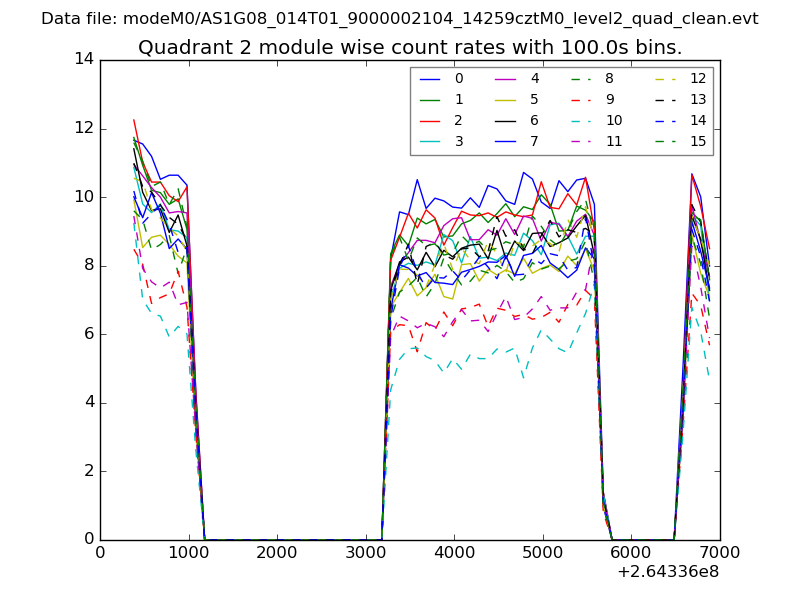
| Module-wise count rates for Quadrant B Data is divided into 100 sec bins |
 |
 |
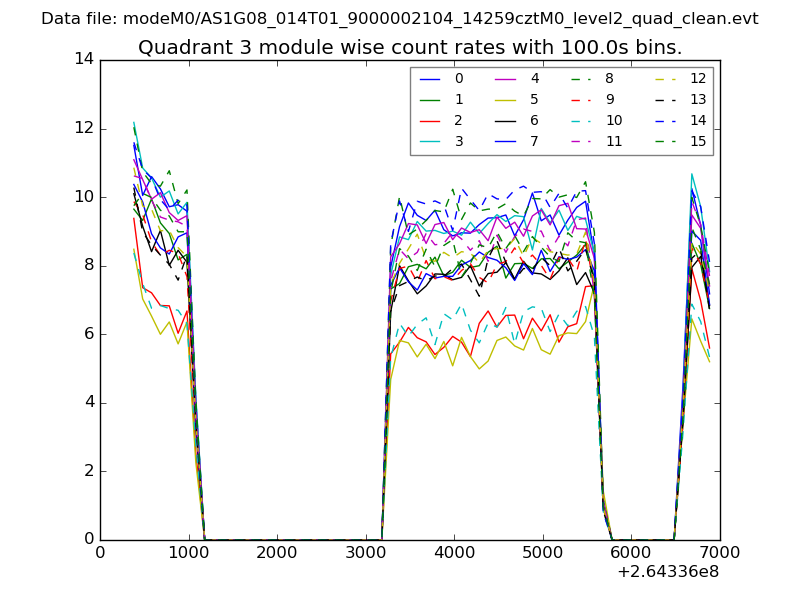
| Module-wise count rates for Quadrant C Data is divided into 100 sec bins |
 |
 |
| Module-wise count rates for Quadrant D Data is divided into 100 sec bins |
 |
 |
| Parameter | Plot |
|---|---|
| CZT HV Monitor | 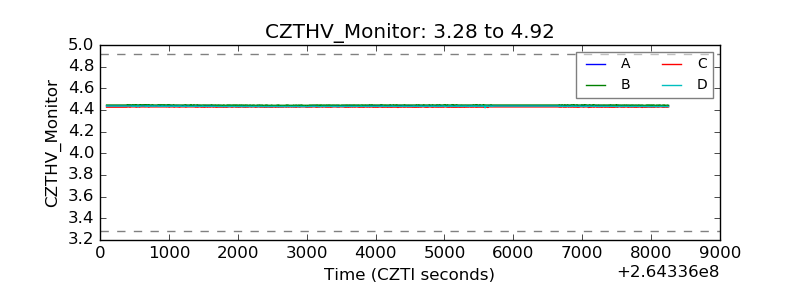 |
| D_VDD | 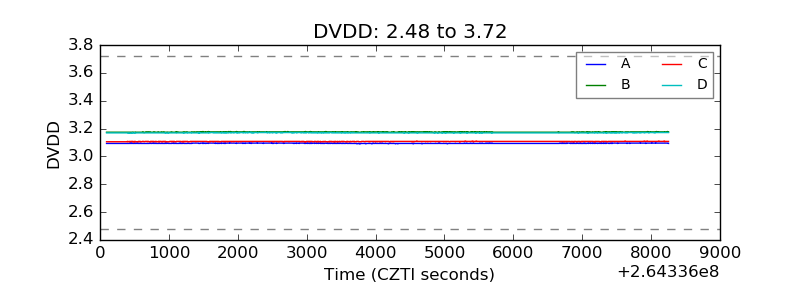 |
| Temperature 1 | 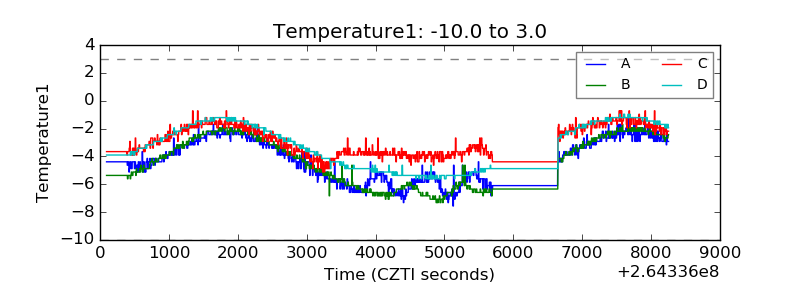 |
| Veto HV Monitor | 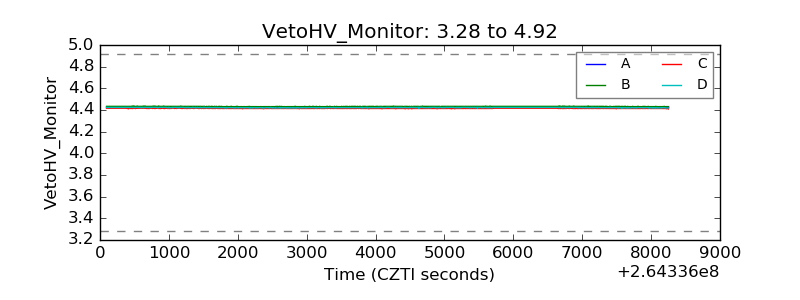 |
| Veto LLD | 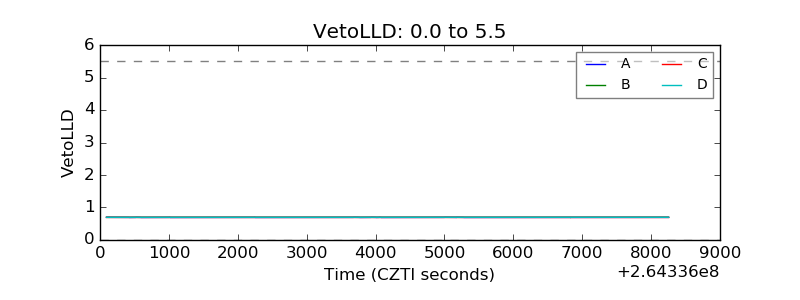 |
| Alpha Counter | 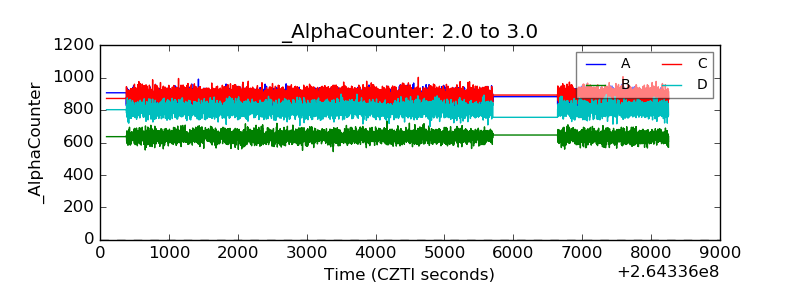 |
| _CPM_Rate | 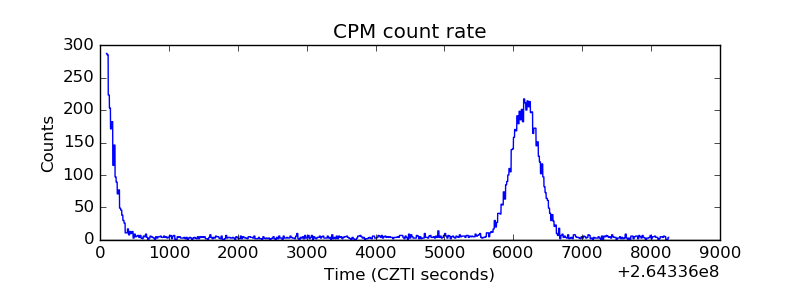 |
| CZT Counter | 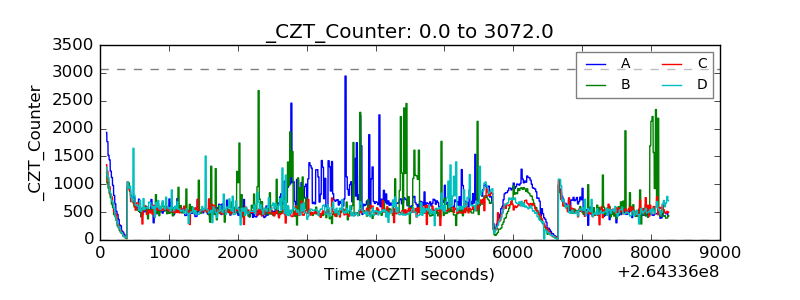 |
| +2.5 Volts monitor | 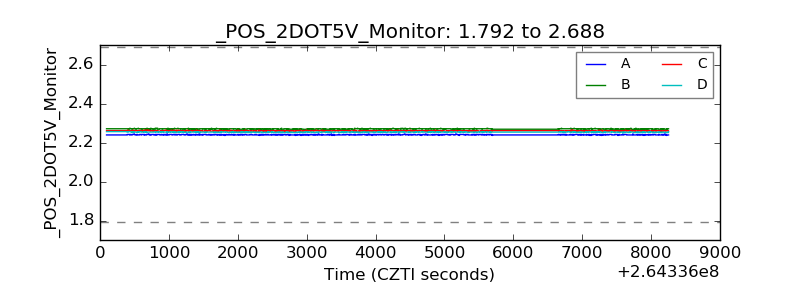 |
| +5 Volts monitor |  |
| _ROLL_ROT | 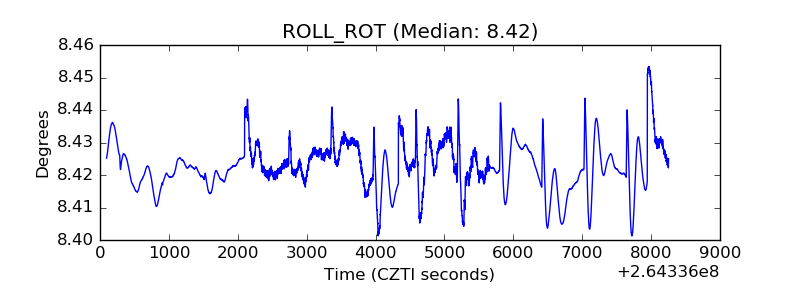 |
| _Roll_DEC | 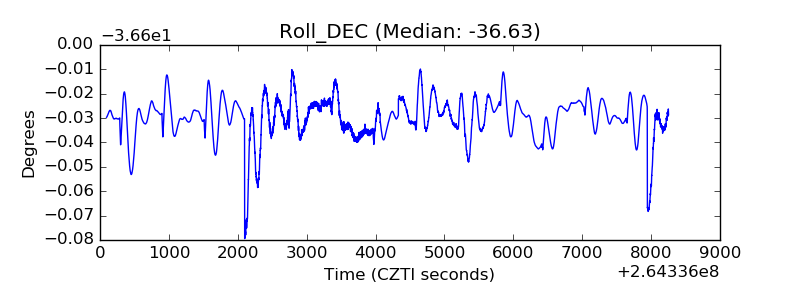 |
| _Roll_RA | 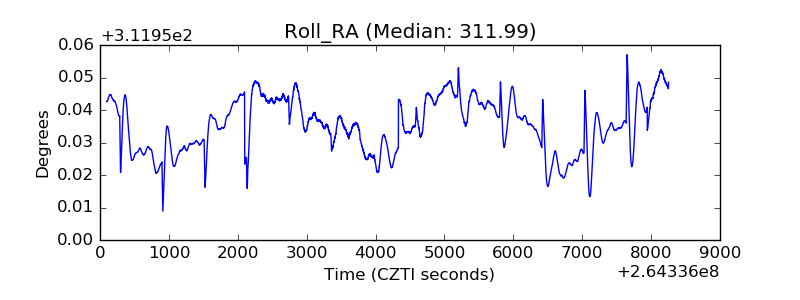 |
| Veto Counter | 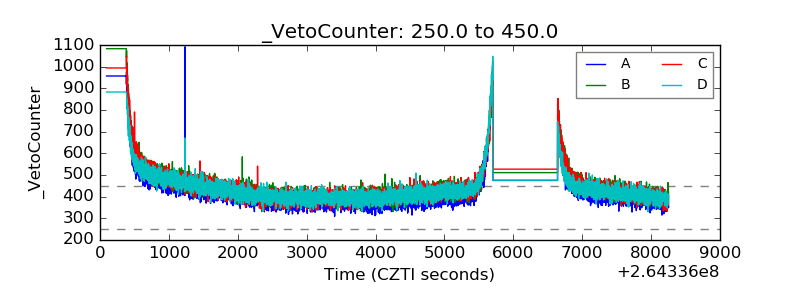 |