| Param | Original file | Final file |
|---|---|---|
| Filename | modeM0/AS1G08_014T01_9000002104_14260cztM0_level2.evt | modeM0/AS1G08_014T01_9000002104_14260cztM0_level2_quad_clean.evt |
| Size (bytes) | 622,912,320 | 76,446,720 |
| Size | 594.1 MB | 72.9 MB |
| Events in quadrant A | 3,642,069 | 473,400 |
| Events in quadrant B | 4,365,538 | 471,344 |
| Events in quadrant C | 3,941,116 | 443,353 |
| Events in quadrant D | 6,424,699 | 421,333 |
| Mode M9 | |||
|---|---|---|---|
| Quadrant | BADHDUFLAG | Total packets | Discarded packets |
| A | 0 | 9 | 0 |
| B | 0 | 9 | 0 |
| C | 0 | 9 | 0 |
| D | 0 | 10 | 0 |
| Mode SS | |||
|---|---|---|---|
| Quadrant | BADHDUFLAG | Total packets | Discarded packets |
| A | 0 | 148 | 0 |
| B | 0 | 148 | 0 |
| C | 0 | 148 | 0 |
| D | 0 | 148 | 0 |
| Mode M0 | |||
|---|---|---|---|
| Quadrant | BADHDUFLAG | Total packets | Discarded packets |
| A | 0 | 15350 | 3 |
| B | 0 | 17525 | 2 |
| C | 0 | 15634 | 2 |
| D | 0 | 23989 | 2 |
| Quadrant | Total seconds | Saturated seconds | Saturation percentage |
|---|---|---|---|
| A | 7251 | 156 | 2.151427% |
| B | 7251 | 394 | 5.433733% |
| C | 7251 | 106 | 1.461867% |
| D | 7251 | 861 | 11.874224% |
Noise dominated data is calculated using 1-second bins in cleaned event files. If a bin has >2000 counts, and if more than 50% of those come from <1% of pixels, then it is considered to be noise-dominated and hence unusable.
| Quadrant | # 1 sec bins | Bins with >0 counts | Bins with >2000 counts | High rate bins dominated by noise | Noise dominated (total time) | Noise dominated (detector-on time) | Marked lightcurve |
|---|---|---|---|---|---|---|---|
| A | 7862 | 7253 | 0 | 0 | 0.00% | 0.00% | 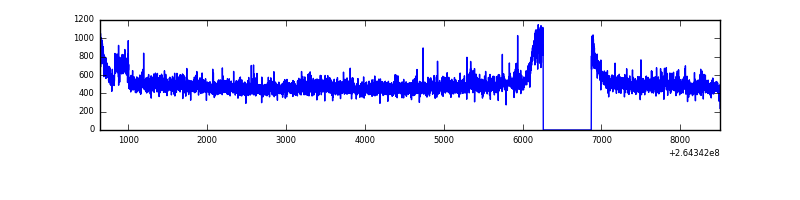 |
| B | 7862 | 7252 | 133 | 133 | 1.69% | 1.83% | 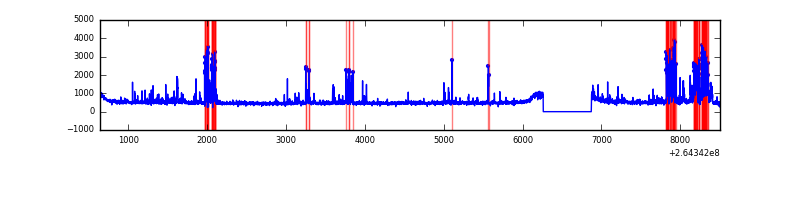 |
| C | 7862 | 7253 | 0 | 0 | 0.00% | 0.00% | 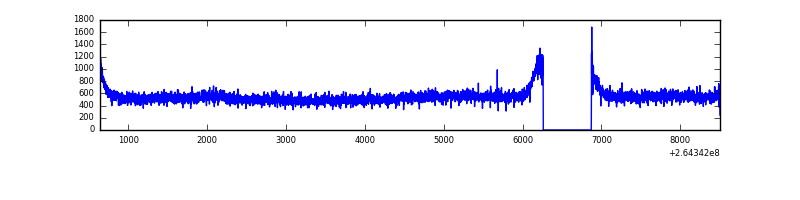 |
| D | 7862 | 7253 | 577 | 577 | 7.34% | 7.96% | 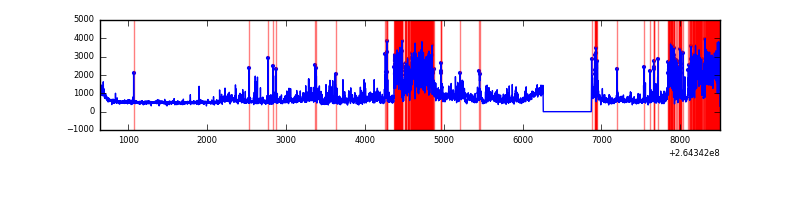 |
Top three noisy pixels from each quadrant. If the there are fewer than three noisy pixels in the level2.evt file, extra rows are filled as -1
| Pixel properties | Quadrant properties | ||||||
|---|---|---|---|---|---|---|---|
| Quadrant | DetID | PixID | Counts | Sigma | Mean | Median | Sigma |
| A | 12 | 189 | 67787 | 360.41 | 913 | 895 | 185.6 |
| A | 0 | 23 | 31299 | 163.81 | 913 | 895 | 185.6 |
| A | 8 | 15 | 29293 | 153.0 | 913 | 895 | 185.6 |
| B | 0 | 182 | 420993 | 2440.86 | 892 | 871 | 172.1 |
| B | 0 | 229 | 193387 | 1118.5 | 892 | 871 | 172.1 |
| B | 10 | 245 | 169610 | 980.36 | 892 | 871 | 172.1 |
| C | 3 | 233 | 530844 | 2600.49 | 873 | 878 | 203.8 |
| C | 13 | 61 | 6277 | 26.49 | 873 | 878 | 203.8 |
| C | 8 | 128 | 4652 | 18.52 | 873 | 878 | 203.8 |
| D | 13 | 122 | 2014487 | 10041.28 | 846 | 826 | 200.5 |
| D | 5 | 222 | 556075 | 2768.79 | 846 | 826 | 200.5 |
| D | 8 | 195 | 390855 | 1944.91 | 846 | 826 | 200.5 |
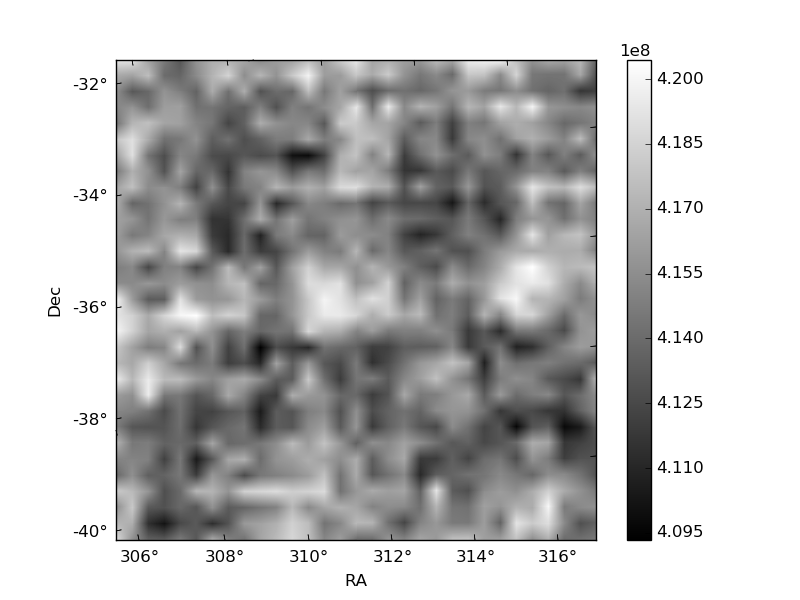
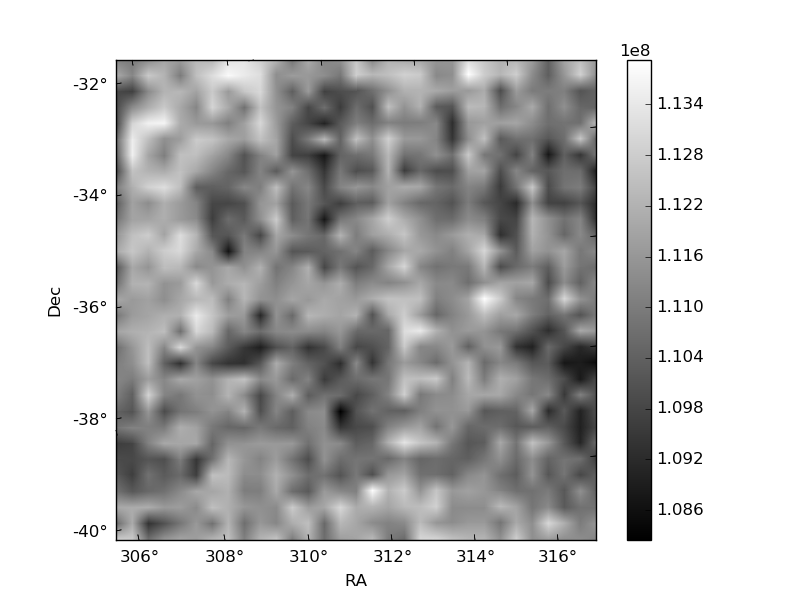
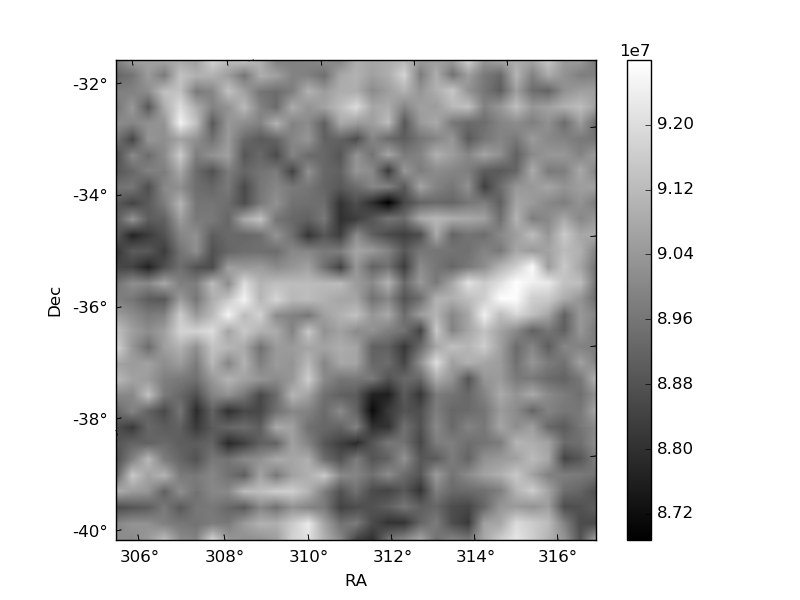
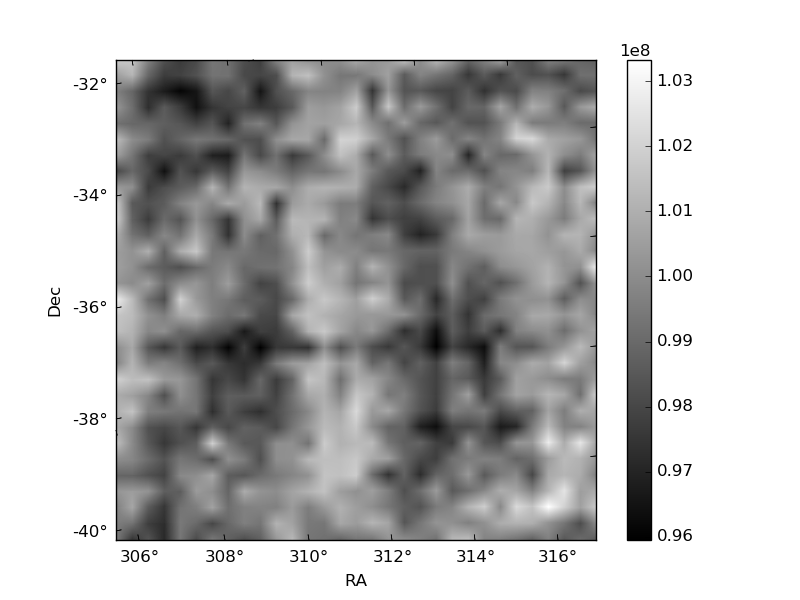
Histogram calculated using DETX and DETY for each event in the final _common_clean file
| Quadrant A | 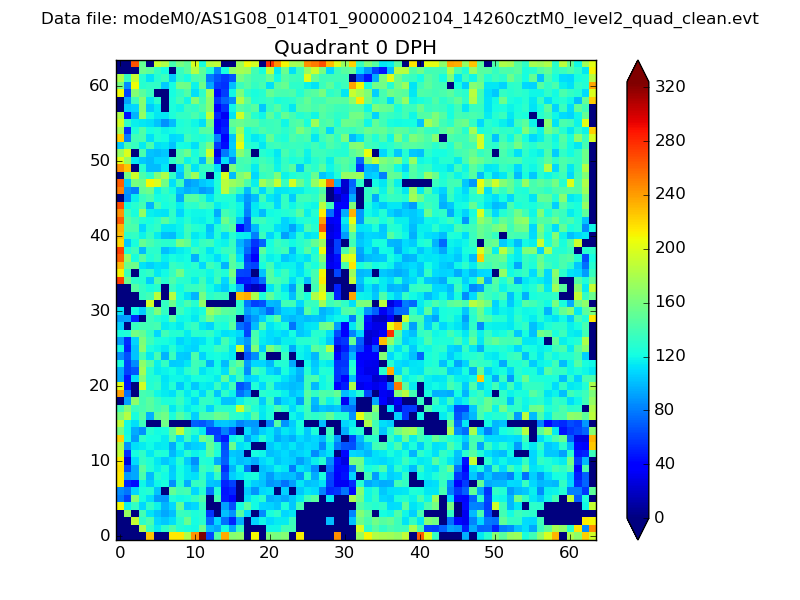 |
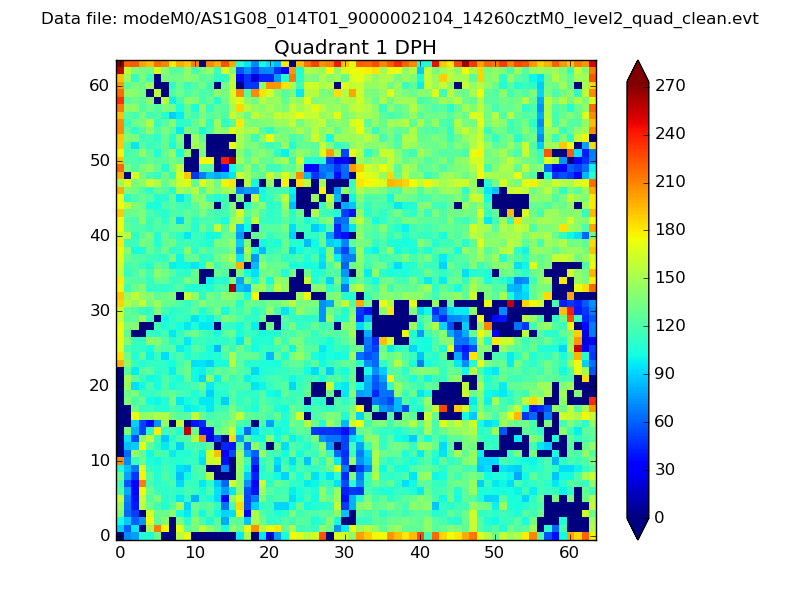 |
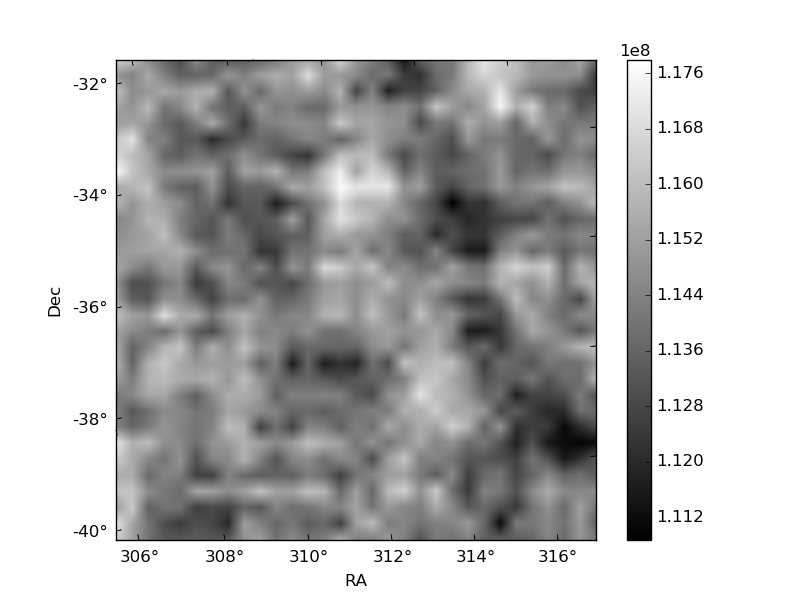
Quadrant B |
|---|---|---|---|
| Quadrant D | 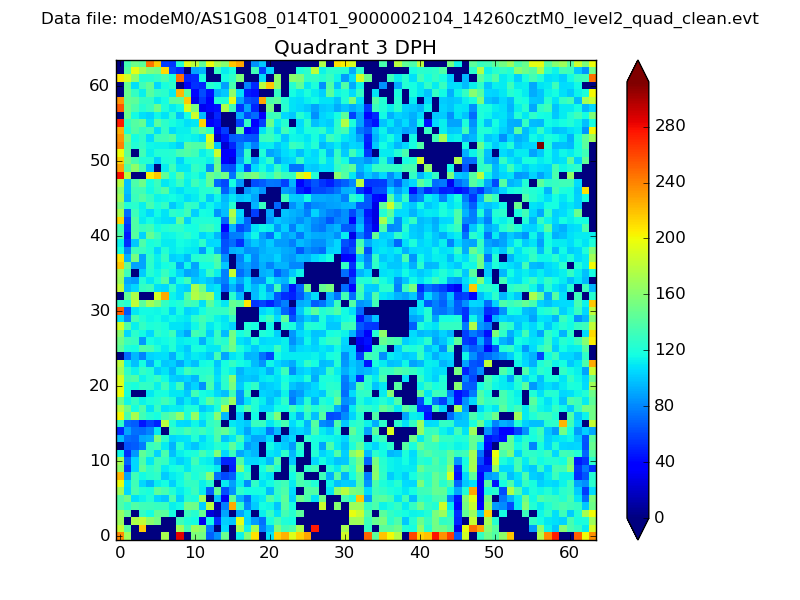 |
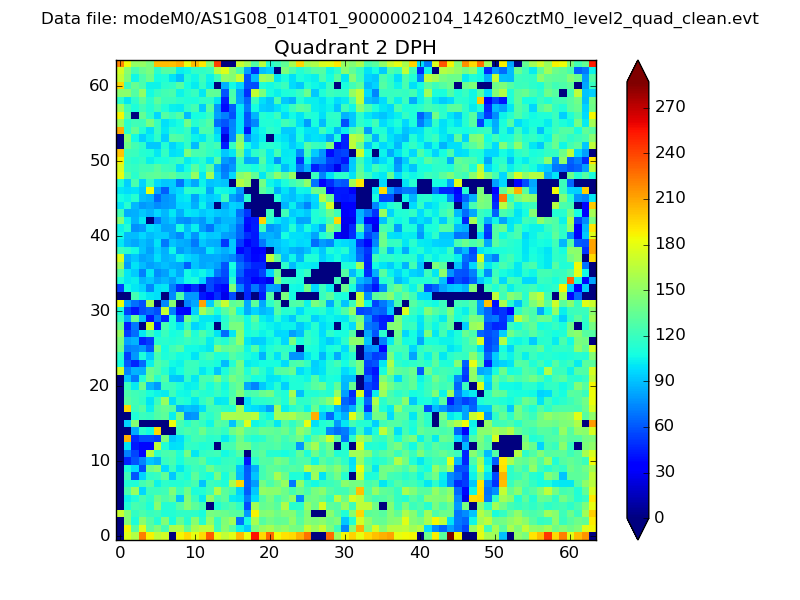 |
Quadrant C |
| Plot type | Count rate plots | Images |
|---|---|---|
| Comparison with Poisson distribution Blue bars denote a histogram of data divided into 1 sec bins. Red curve is a Poisson curve with rate = median count rate of data. |
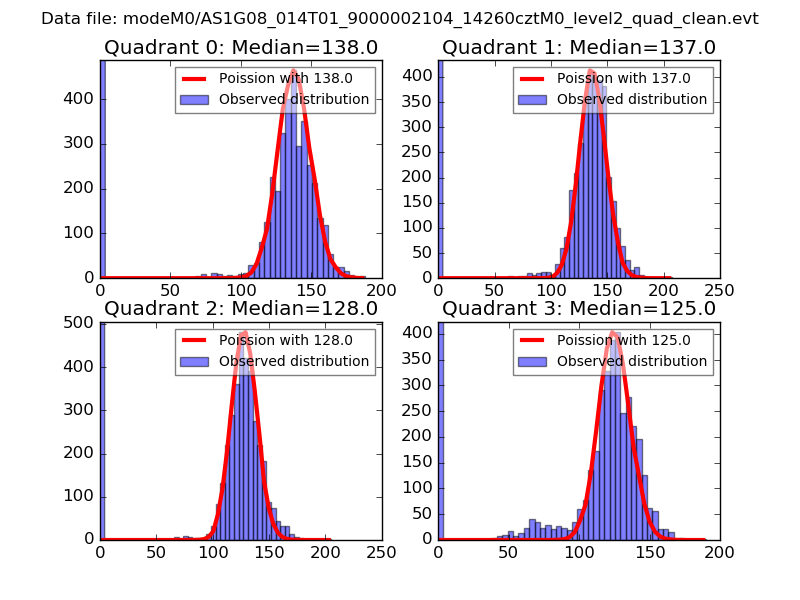 |
 |
| Quadrant-wise count rates Data is divided into 100 sec bins |
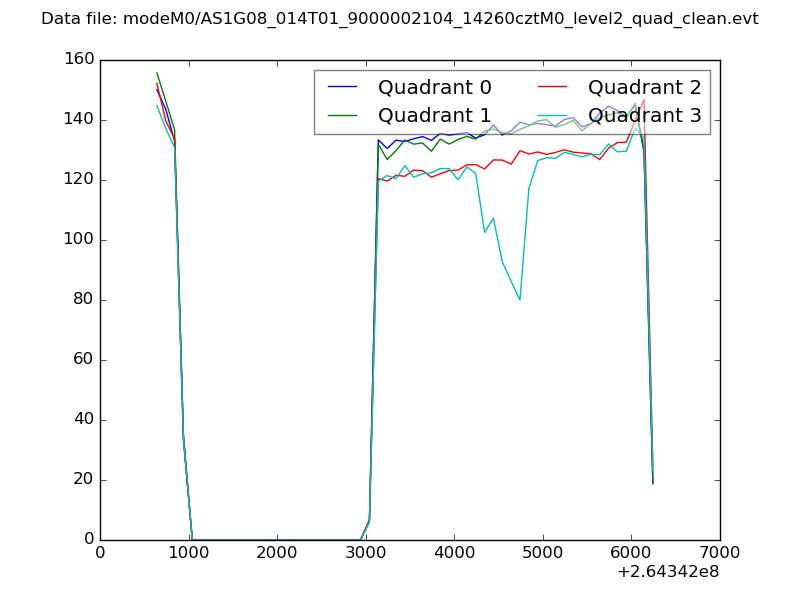 |
|
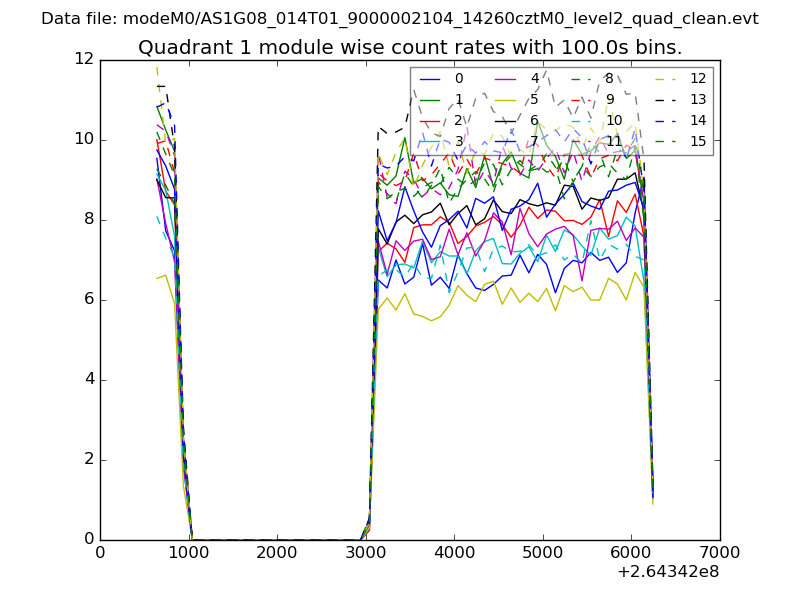
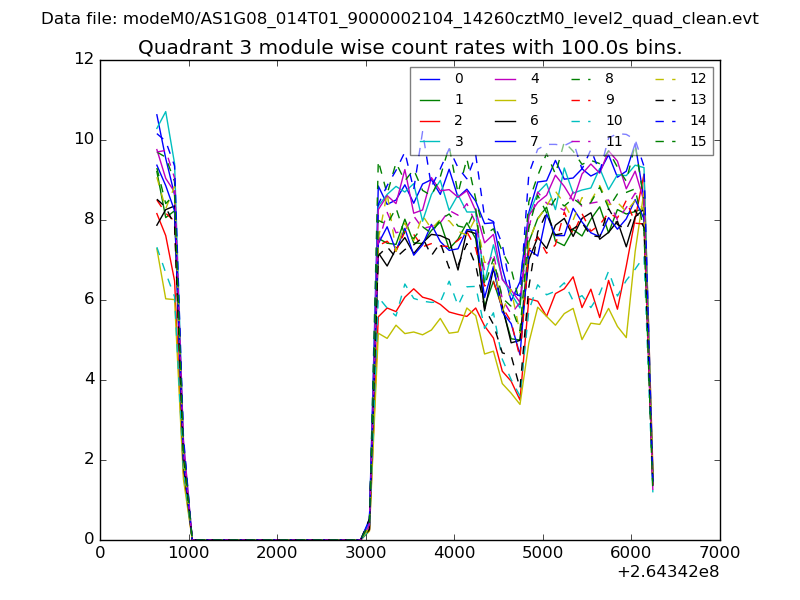
| Module-wise count rates for Quadrant A Data is divided into 100 sec bins |
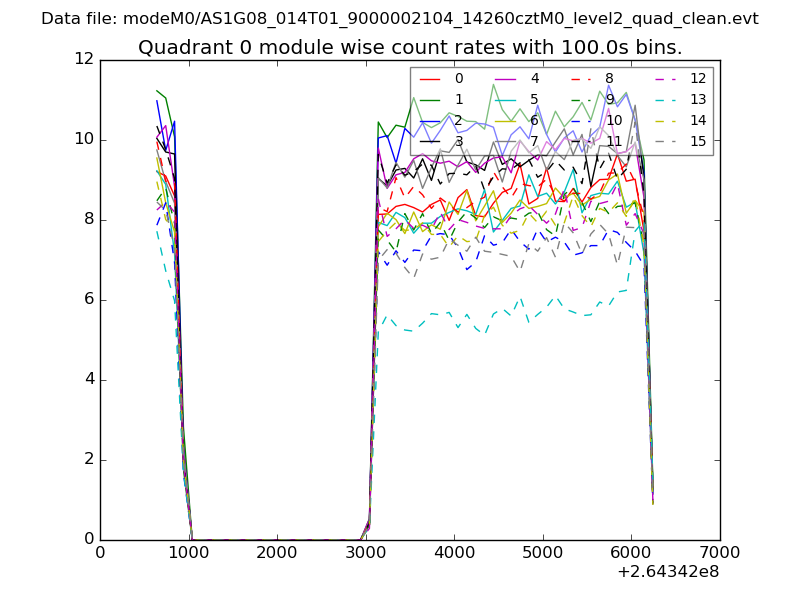 |
 |
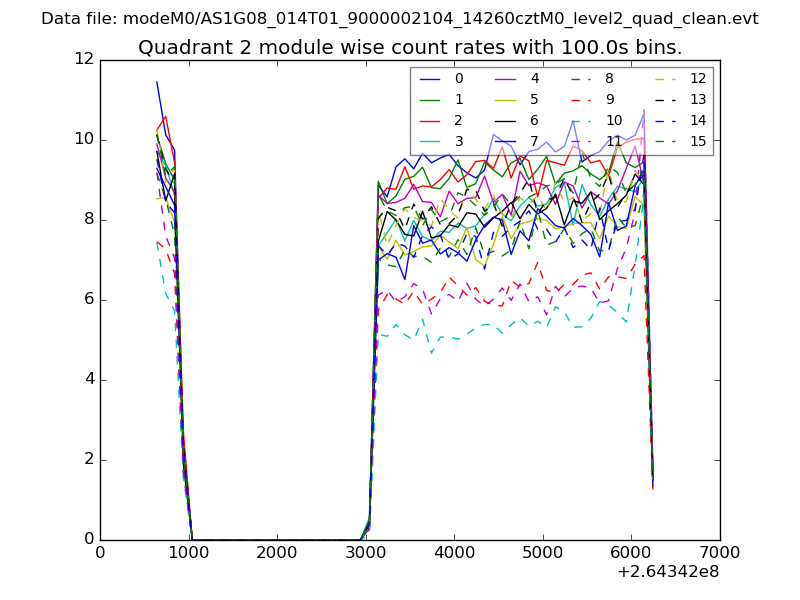
| Module-wise count rates for Quadrant B Data is divided into 100 sec bins |
 |
 |
| Module-wise count rates for Quadrant C Data is divided into 100 sec bins |
 |
 |
| Module-wise count rates for Quadrant D Data is divided into 100 sec bins |
 |
 |
| Parameter | Plot |
|---|---|
| CZT HV Monitor | 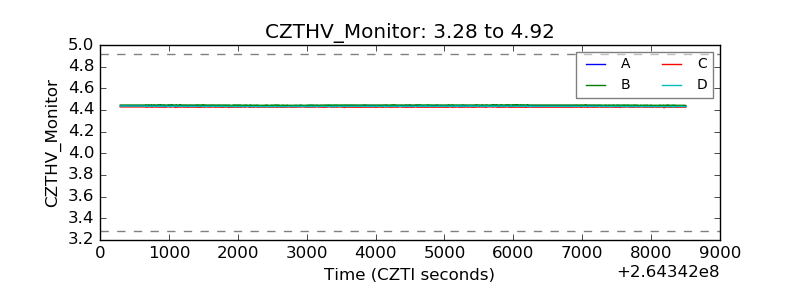 |
| D_VDD | 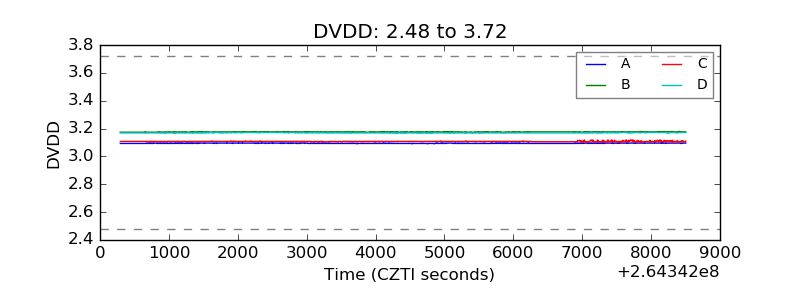 |
| Temperature 1 | 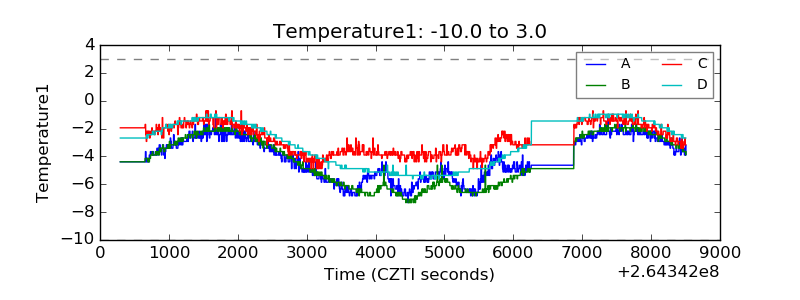 |
| Veto HV Monitor |  |
| Veto LLD |  |
| Alpha Counter | 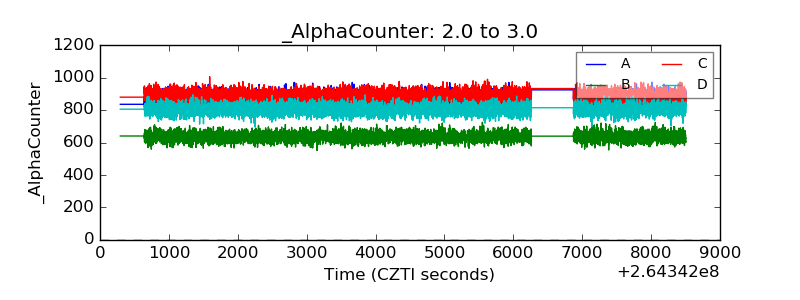 |
| _CPM_Rate | 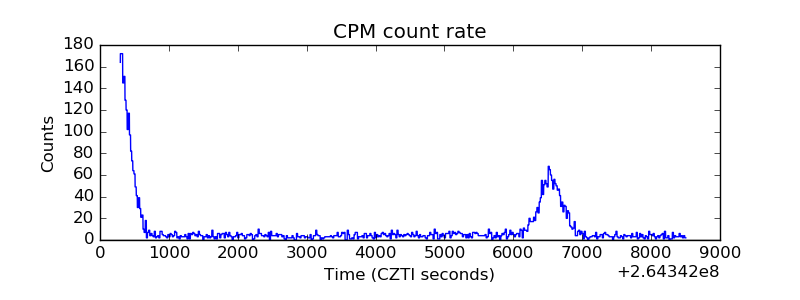 |
| CZT Counter | 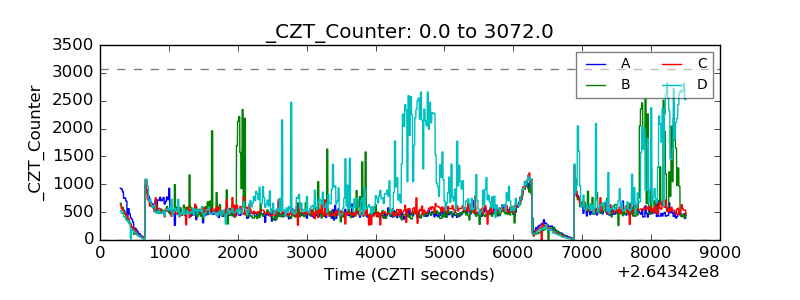 |
| +2.5 Volts monitor | 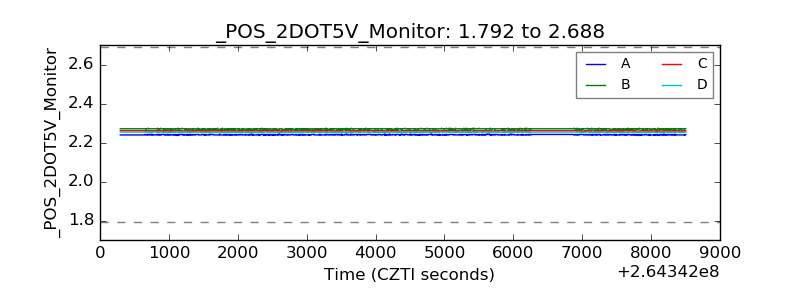 |
| +5 Volts monitor |  |
| _ROLL_ROT | 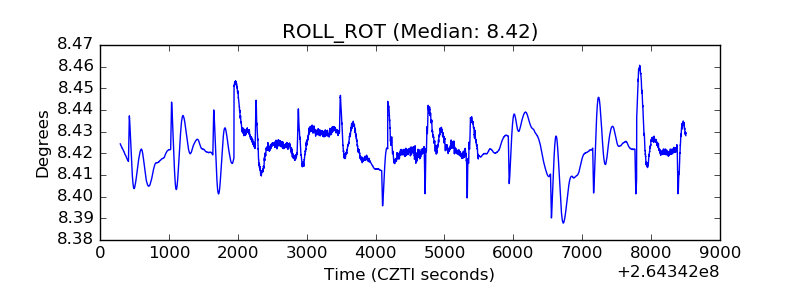 |
| _Roll_DEC | 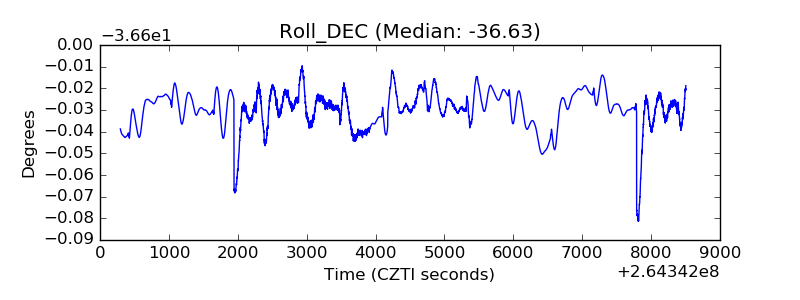 |
| _Roll_RA | 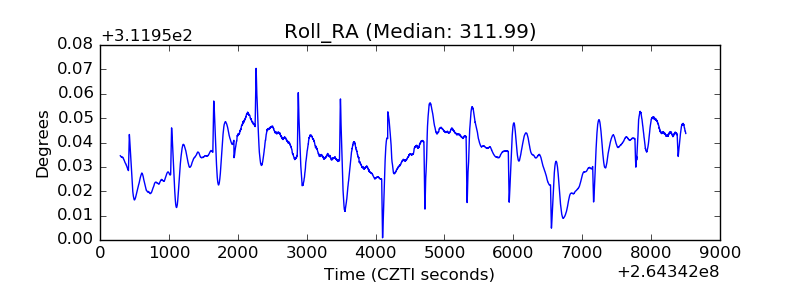 |
| Veto Counter | 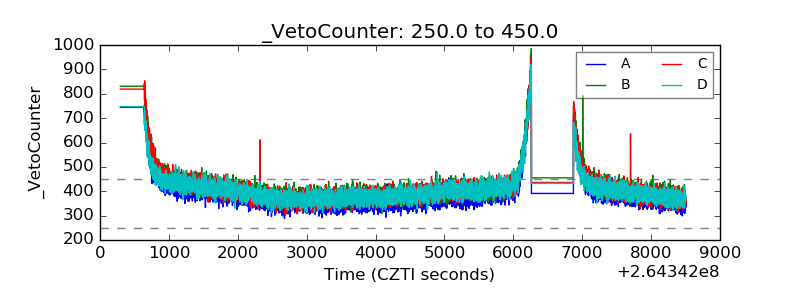 |